
Abstract
The study objective was to investigate a possible sodium dichloroacetate (DCA) pharmacological mechanism causing an increase in diuresis in rats. The aim was to define characteristics of 24-hour urinary Na+, K+, Cl−, Ca2+, and Mg2+ excretion in Wistar male rats and to evaluate effect of a single-dose DCA and repeated DCA dosage on diuresis. Six control and 6 DCA-treated male rats aged 5 to weeks after a single DCA dose and repeated dosage were tested. The single DCA dose treatment caused a significantly higher 24-hour diuresis when compared to control (P < .05), and it was related to increased Cl−, Na+, and K+ urine excretion and a significant increase in Ca2+ and Mg2+ excretion (P < .05); after the repeated 4-week DCA dosage, the diuresis was not increased, but the excretion of the Na+, Cl−, Ca2+, and Mg2+ ions was significantly higher. Kidney immunohistochemistry has revealed that DCA continuous treatment results in an increase in the size of Henle loop thick ascending limb epithelial cells (P < .001). The study results show a significantly reduced RNA expression of Na-K-2Cl co-transporter (NKCC1) in thymus of 4-week DCA-treated rats (P < .03). The study data have indicated a possible mechanism of such pharmacological effect to be NKCC inhibition.
Introduction
Sodium dichloroacetate (DCA) is an investigational medicinal product which acts as a pyruvate dehydrogenase kinase (PDHK) inhibitor. 1 The dichloroacetate ion is a small molecule rapidly absorbed from the gastrointestinal tract. 2 It can be brought through the plasma membrane by an electroneutral monocarboxylate transporter or an electrogenic Na+-coupled monocarboxylate transporter SLC5A8 in cells. Mediating the DCA entry into cells, SLC5A8 is much more effective for the antitumor activity of DCA, as its affinity for the DCA anion is greater than that of the monocarboxylate transporter. 3,4
The principal target of DCA is to keep active the pyruvate dehydrogenase (PDH) complex; PDH is present in all tissues, and its deficiency is a cause of primary or acquired lactic acidosis. 1,5 The DCA inhibits all isoforms of PDHK, keeping PDH in the unphosphorylated catalytically active form and facilitating the oxidative removal of pyruvate; PDHK isoforms are inactivating PDH, thus maintaining the glycolytic profile of proliferating cells. 1,6 -8 The DCA has been investigated in clinical trials for the chronic treatment of congenital lactic acidosis, 9 pulmonary arterial hypertension, 10 and glioblastoma. 11 The PDHK has been suggested as a specific target in cancer cells, and DCA may be beneficial in treating tumor types based on their molecular expression of different PDHK isoforms. 5,6,12 The DCA induces apoptosis, cell cycle arrest, and reverses the Warburg effect in cancer cells. 1,13 The DCA increases apoptosis via the intrinsic mitochondrial pathway due to the production of high reactive oxygen species, causing mitochondrial depolarization and decreased adenosine triphosphate production in cancer cells. 14 -16
Recent experimental data show DCA to synergistically potentiate the efficacy of other anticancer medicines, playing a role in reducing resistance to chemotherapy. Experimental treatment with DCA reduced the expression of ABC transporters (ABCB1, ABCC1, ABCC5, and ABCG2) in wild-type p53-expressing cells in vitro and in animal models. The ABC transporters control the export of drugs from cancer cells and render tumors resistant to chemotherapy. 17 The vemurafenib-DCA combination may provide a potential target in melanoma treatment. 18 The paclitaxel-induced expression of PDHK2 in lung cancer cells is related to an important mechanism for acquired paclitaxel resistance, and additional treatment with DCA could be a novel therapeutic intervention in resistance to paclitaxel 19 ; also, DCA could improve the doxorubicin efficacy in breast cancer chemotherapy. 20
During the study, we found DCA to increase diuresis in rats. The study data have indicated a possible mechanism of such pharmacological effect to be the Na-K-2Cl co-transporter (NKCC) inhibition. The study aim was also to determine the effect of DCA on NKCC2 in the kidney and on NKCC1 RNA expression in rat thymocytes, as well as on the thymus weight. The results have indicated that DCA inhibits the NKCC2 in the kidney and decreases the NKCC1 RNA expression in the thymus, which is accompanied by a loss of thymus weight of DCA-treated rats.
Materials and Methods
Twelve 5- to 6-week-old Wistar male rats were used: 6 rats were examined for a 1-day dose and a repeated dosage of DCA, and 6 age-matched control rats were used as a control group. Before the treatment, the mean age of control rats was 35 ± 8 days for males, and the mean age of DCA-treated rats was 36 ± 9 days. The body weight of rat before treatment did not differ between the groups. The mean weight of the control male rats at the beginning of the experiment was 243.3 ± 6.8 g for the control group and 236.8 ± 17.9 g for the DCA group. All investigated rats survived the period of 28 days.
The permission from the State Food and Veterinary Service of Lithuania to use experimental animals for research was obtained (2017-01-02 Nr. G2-53). The animals were purchased from the Animals Facility of the Veterinary Academy at the Lithuanian University of Health Sciences (Kaunas, Lithuania). The animals were housed in standard colony cages with free access to food, in the conditions of a constant temperature (21°C ± 1°C), humidity, and the light–dark cycle (12-hour/12-hour). A commercial pellet diet was provided ad libitum. The animals had been acclimated for at least 3 days before experiment. The experiments were performed in compliance with the relevant laws and according to the institutional guidelines for animal care in order to avoid any unnecessary distress to the animals.
Treatment With DCA
Effects of 1-day DCA treatment and a repeated dosage for 28 days were investigated; during the first 24 hours, rats were treated with the first-day DCA 200 mg/kg/d, and the repeated dosage was 100 mg/kg/d of the DCA for 4 weeks. The first-day dosage was 200 mg/kg DCA as a single intragastric dose, and the treatment was continued with 100 mg/kg/d of DCA as a drinking solution. After the first-day dosage treatment, the repeated dosage treatment with 100 mg/kg/d of the DCA in the drinking water solution was used for 28 days; the DCA concentration in the solution was recalculated according to the rat weight once a week (evaluating the average rat weight in the group and the volume of the consumed average drinking solution per 24 hour for 1 rat). The DCA solution was offered to animals ad libitum as their only source of drinking (in aluminum foil-wrapped bottles to avoid light decomposition). The control groups were given fresh drinking water ad libitum. The DCA dosage was chosen in accordance with the data of preclinical pharmacodynamic DCA studies. 21 The DCA was purchased from Sigma-Aldrich GmbH (Saint Louis, MO, USA).
Diuresis and Ion Level Analysis in Urine and Blood Serum
The 24-hour urine was collected after the first day of the DCA dosage and after the repeated dosage on the 28th day of DCA treatment. The 24-hour urine was collected keeping a rat alone in a special cage (diuresis cage for rats 3700D000/3701D000; Tecniplast, Buguggiata, Italy) for 24 hours (from 9:00
Histological Investigation
The right kidney of each rat was separated and weighed, and the histological examination of the kidney was performed with the aim to evaluate the morphological changes caused by the possible DCA toxicity. Kidneys were fixed in a 10% neutral-buffered formalin solution, embedded in paraffin, sectioned into 3-µm sections, and stained with hematoxylin and eosin. The histological evaluation of the samples was performed with a cold light microscope OLYMPUS BX40F4 (Olympus Optical Co LTD, Tokyo, Japan) under 4×, 10×, and 40× magnification using the CellSensDimention 1.9 Digital Imaging Software for Research Applications (Olympus Corporation of America, Center Valley, Pennsylvania, USA).
Immunohistochemical Investigation of Rat Kidneys
A formalin-fixed and paraffin-embedded 3-μm-thick kidney specimens were placed on ultra plus glass slides. After rehydration, the target antigen epitope heat retrieval was performed on the sections at pH 6 and 95°C for 20 minutes. After blocking endogenous peroxidase, the antigen was detected with the rabbit anti-SLC12A1 (2.5 μg/mL; Abcam, Cambridge, United Kingdom, Cat. #ab191315, dilution 1:100) at 4°C overnight. The immunoreactivity was detected with a secondary antibody (Flex+Mouse Linker) for 30 minutes at room temperature. Both the first and the second antibodies were diluted with the DAKO antibody diluent containing background-reducing components (DAKO, Carpinteria, CA, USA). A DAB chromogen kit (DAKO, Glostrup, Denmark) was used for visualization of immunoreactivity. The sections were counterstained with Mayer hematoxylin, cleared, mounted, and studied under the microscope. The negative control was performed without applying the primary antibody in 1 slide in each of the series of stained slides. Four high-power images of the outer medulla were obtained to measure the height of epithelial lining cells (n = 50 per kidney) of a thick ascending limb (TAL) of the loop of Henle.
Thymus Preparation
To minimize contamination of the thymus with red blood cells, the carotid arteries and the aorta were cut and the animals exsanguinated. Upon killing the animals, their thymus was harvested, and the contaminating blood was removed by rinsing with RPMI-1640 (Biological Industries, Bet Haemek, Israel). The weight of the thymus was measured, and the left rat thymus lobe of the study groups was isolated after thymus surrounding the connective tissue was removed, and the thymus lobe was stored in the RNAlaterRNA stabilization reagent (Qiagen, Hilden, Germany) at −80°C until the further RNA extraction. The right lobe of the thymus was taken for the RNA analysis.
Extraction of RNA From the Thymus
The frozen tissue was ground in liquid nitrogen. Total RNA was extracted using the TRIzol Plus RNA Purification Kit (Life Technologies, Carlsbad, CA, USA), according to the manufacturer’s instruction. The RNA quality was assessed using a NanoDrop2000 spectrophotometer (Thermo Scientific, Waltham, MA, USA) using the A260–A280 ratio. The extracted RNA samples were stored at −80°C until further analysis.
Determination of the NKCC1 Expression in Thymus
RNA expression assays were performed for Slc12a2 (Rn00582505_m1) and Glpdh (Rn01775763_g1) genes. Reverse transcription was performed with High-Capacity cDNA Reverse Transcription Kit with RNase Inhibitor (Applied Biosystems, Carlsbad, CA, USA) in 20 μL reaction volume containing 50 ng of total RNA incubated at 25°C for 10 minutes, transcripted at 37°C for 120 minutes, and terminated by heating at 85°C for 5 minutes using Biometra TAdvanced thermal cycler (Analytik Jena AG, Jena, Germany). The synthesized cDNA was stored at 4°C until use or at −20°C for longer time. Real-time polymerase chain reaction (PCR) was performed using an Applied Biosystems 7900 Fast Real-Time PCR System (Applied Biosystems, Carlsbad, CA, USA). The reactions were run in triplicate with 4 μL of cDNA template in a 20-μL reaction volume (10 μL of TaqMan Universal Master Mix II, no UNG (Applied Biosystems, Carlsbad, CA, USA), 1 μL of TaqMan Gene Expression Assay 20× (Applied Biosystems, Carlsbad, CA, USA), 5 μL of nuclease-free water (Invitrogen, Carlsbad, CA, USA) with the program running at 95°C for 10 minutes, followed by 40 cycles of 95°C for 15 seconds and 60°C for 1 minute.
Statistical Analysis
The statistical analysis was performed using the Statistical Package for the Social Sciences, version 22.0 for Windows (IBM SPSS Statistics V22.0). The normality assumption was verified by the Kolmogorov-Smirnov test. The animals and their kidney weight data are expressed as the mean ± standard deviation. When the normality assumptions are not met, data are expressed as median and range (minimum and maximum values). Differences between the 2 independent groups were evaluated using the nonparametric Mann-Whitney U test. The Spearman rank correlation coefficient (r) was used to assess the relationships between the rat and the rat kidney weights and among ion levels in the urine. To investigate the NKCC1 (Slc12a2) RNA expression changes in the DCA-treated group, the threshold cycle (CT) values were normalized with the control Glpdh gene; for the gene expression study, the ΔΔ CT (2−ΔΔCT) method was used to calculate the expression ratio between the DCA-treated (test) and control conditions of the target gene when compared to the reference gene. Differences at the value of P < .05 were considered significant.
Results
Animal Weight Data Analysis
The mean weight of the control male rats and DCA-treated rats at the beginning of the experiment and at the 14th and 28th days was as follows: 243.3 ± 6.8 g, 284.2 ± 14.9 g, and 340.5 ± 22.5 g in control male rats and 236.8 ± 17.9 g, 256.2 ± 18.9 g, and 290.0 ± 15.5 g in DCA-treated rats. The weight dynamics during 4 weeks and the significance difference among the control and DCA-treated rat groups are shown in Figure 1. The weight of the control during the first 14 days (P < .028) and from the 14th to the 28th day (P < .028) as well as from the 1st to the 28th day (P < .028) was found to be significantly increased (Figure 1). In the DCA-treated rat group, there was no significant increase in the weight during the first 14 days, but it significantly increased from the 1st to the 28th day (P < .027). The weight of the control rat and DCA-treated rat groups showed significant differences at the 14th (284.2 ± 14.92 g vs. 256.2 ± 18.9 g, P < .037) and the 28th days (340.5 ± 22.5 g and 290.0 ± 15.5 g, P < .004, respectively). The changes in the weight of DCA-treated rats could be related to the DCA diuretic effect.

Rat weight dynamics during the experiment in the control and sodium dichloroacetate (DCA)-treated male rats aged 5 to 6 weeks. Weight was measured at the first day as the initial weight and at the 14th and 28th days in the control and in repeated DCA dosage treated rat groups. Data are presented as the mean ± standard deviation.
Diuresis in the Control and DCA-Treated Rats
The first-day DCA dosage treatment caused a significantly higher 24-hour diuresis in DCA-treated when compared to the control rats (P < .041; Table 1), but the repeated 4-week DCA treatment was not related to significant diuresis/aquaresis changes when observed at day 28 (Figure 2). In the DCA-treated rats aged 5 to 6 weeks, the correlation of diuresis with ions was similar to those of control ones, where r with Na+ excretion was significant (r = 0.85, P < .03), and correlation of diuresis with Na+, K+, and Cl− in the control and DCA-treated rats showed no significant differences after 28 days of the DCA treatment (Table 2).
The 24-Hour Diuresis and Urine Ion Excretion of the Control and DCA-Treated Male Rats.

Abbreviations: DCA, sodium dichloroacetate; min, minimum; max, maximum.
a P is significant when comparing the DCA-treated group with the control (for the P value, see Results).

The 24-hour diuresis per 100 g body weight in control and sodium dichloroacetate (DCA)-treated male rat groups. The weight after single dose of DCA (200 mg/kg body weight per os) in male rats aged 5 to 6 weeks and after DCA repeated dosage (100 mg/kg body weight daily per os) treatment at 28th day in male rats aged 9 to 10 weeks. Data are presented as the mean ± standard deviation.
Correlation (r) Among Diuresis and Urinary Ion Excretion and Among Ion Excretion in the Control and DCA-Treated Male Rats in DCA-Treated Groups After DCA Single Dose and Repeated Dosage.a

Abbreviation: DCA, sodium dichloroacetate.
a Value in bold: A significant correlation (for the P value, see Results).
Urine pH and Its Correlation With Urine Ion Excretion in the Study Groups
There were no urine pH changes and no pH correlation with ion excretion regarding the first 24-hour DCA dose or repeated DCA treatment, and the 24-hour urine pH in the DCA-treated group showed no statistically significant differences compared to the controls (P > .05; Table 1).
K+ Excretion in Control and DCA-Treated Rats
During the first 24 hours of the DCA treatment, the 24-hour K+ excretion in the DCA-treated males aged 5 to 6 weeks was higher than those in the controls, but the difference was at the significance limit (P = .055; Figure 3A). The single DCA dosage in the DCA-treated group caused a high correlation of the urine K+ excretion with Na+ (r = 0.98, P = .001) and with Cl− (r = 0.97, P < .001); in the control males, these correlations were also high but not significant. The K+ excretion in the respective control was found to be significantly correlated with diuresis (r = 0.91, P < .012); thus, it is possible to state that the first-day DCA dosage caused a more active K+ urine excretion in rats.

The 24-hour urine ion excretion of control and sodium dichloroacetate (DCA)-treated male rats. A, Urinary 24-hour K+, Na+, and Cl− ion excretion per 100 g body weight in the control and DCA-treated male rat groups after treatment with a single dose of DCA (200 mg/kg body weight per os) in rats aged 5 to 6 weeks rats. B, Urinary 24-hour K+, Na+, and Cl− ion excretion per 100 g body weight after the repeated DCA dosage (100 mg/kg body weight daily per os) at the 28th day in rats aged 9 to 10 weeks. Data are provided as median with minimum and maximum values.
After the repeated DCA dosage, on the 28th day of DCA treatment, the 24-hour K+ urine excretion was not increased (Table 1; Figure 3B), and its excretion correlation with Na+ as well as with Cl− was without changes when compared to the control (Table 2).
Urinary Na+ Excretion in Control and DCA-Treated Rats
Compared to control males, the 24-hour urinary Na+ excretion was found to be increased in DCA-treated rats after the first 24-hour DCA dosage, but this change was not significant (P = .065). In the 24-hour urine of DCA-treated rats aged 5 to 6 weeks, a significant r correlation was found between Cl− and Na+ (r = 0.94, P < .006) and between Cl− and K+ (r = 0.97, P < .001; Table 2); also, after the repeated DCA treatment at the 28th day, the urinary Na+ excretion was found to be significantly increased (P < .004), and the correlation of Na+ with Cl− was high (r = 0.89, P < .018).
Excretion of Cl− in Control and DCA-Treated Rats
Compared to controls, the 24-hour urinary Cl− levels were significantly higher in rats treated with the first 24-hour DCA dosage (P < .041) and in rats after repeated DCA dosage at the 28th day (P = .002; Table 1; Figure 3A and B). The increased excretion of Cl− in both cases was accompanied by significant Cl− correlations with Na+ and K+ ions in the 24-hour urine (P < .05; Table 2).
Urinary Ca2+ Excretion in the Study Groups
Compared to control, the 24-hour urinary Ca2+ levels per 100 g rat weight were significantly higher in animals treated with the first 24-hour DCA dosage (P < .004) and in urine after the repeated DCA dosage at the 28th day (P = .002; Table 1; Figure 4). In the 24-hour urine of control rats aged 5 to 6 weeks, the r coefficient was moderate for the correlation between diuresis and Ca2+; the DCA treatment increased it significantly (r = 0.85, P = .032), and the correlations of urinary Ca2+ with Na+ and K+ were found to be higher in the DCA-treated rats. In the repeated DCA treatment at the 28th day, the correlations among urine Ca2+ and K+, Na+, and Cl− levels as well as between diuresis and Ca2+ excretion were found to be different from the adverse relationship with the direct one (Table 2).

The 24-hour urine Ca2+ and Mg2+ excretion of the control and sodium dichloroacetate (DCA)-treated male rats. Urinary 24-hour Ca2+ and Mg2+ ion excretion per 100 g body weight in the control and DCA-treated male rat groups after administration of a single DCA dose (200 mg/kg body weight per os) in rats aged 5 to 6 weeks and after the repeated dosage (100 mg/kg body weight daily per os) at the 28th day in rats aged 9 to 10 weeks. Data are provided as median with minimum and maximum values.
Excretion of Mg2+ in Control and DCA-Treated Rats
Compared to control, the 24-hour urinary Mg2+ levels were significantly higher in animals treated with the first 24-hour DCA dosage (P < .026) and after the repeated DCA dosage on the 28th day (P = .004; Table 1). In the 24-hour urine of control animals aged 5 to 6 weeks, the r was low among Mg2+ and diuresis, Na+, K+, and Cl−, but these correlations were found to be increased after the treatment with a single DCA dose.
The repeated DCA dosage markedly changed the correlation character of urinary Mg2+ excretion with diuresis and Mg2+ with Na+, K+, and Cl− excretion on the 28th day. In male rats aged 9 to 10 weeks, these correlations became adverse (Table 2; Figure 4). It is notable that correlations among urinary divalent and monovalent cations in young 5- to 6-week-old control rats have a positive expression, but in mature 9- to 10-week-old control males, these correlations became negative. These changes could result from rat maturity and gonad hormone influence, and this phenomenon needs further investigation in relationship with the impact of gonad hormones and possible gender-related differences.
Analysis of the Data by Evaluating the Kidney Function
The blood serum urea (median [minimum-maximum]) at the 28th day of DCA treatment was 5.8 mmol/L (4.6-6.2) and in control was 6.3 mmol/L (4.3-7.2; P > .05); the blood serum creatinine in control rats was 0.07 µmol/L (0.06-0.07), and the DCA repeated dosage treatment for 4 weeks had no influence on the blood level of creatinine (0.07 µmol/L [0.06-0.08]). In control rats, the blood serum Na+ level was 145.0 mmol/L (142.0-149.0), Cl− 99 mmol/L (96.0-100.0), Ca2+ 2.7 mmol/L (2.4-2.7), and Mg2+ 1.3 mmol/L (1.1-1.3). The DCA repeated dosage treatment for 4 weeks had no influence on these ions in blood serum levels: Na+ 144.0 mmol/L (138.0-146.0), Cl− 99.0 mmol/L (97-138.0), Ca2+ 2.6 mmol/L (2.4-2.7), and Mg2+ 1.3 mmol/L (0.9-1.6); no differences in blood serum ion levels were determined comparing data of control and DCA-treated animal groups (P > .05).
Analysis of Animal Kidney and Thymus Weight Data
The weight of the kidney in the control and in the DCA-treated groups of both genders showed no difference: The kidney weight of the control and DCA-treated males was 1.23 ± 0.1 g and 1.21 ± 0.1 g, respectively (P > .05). After 28 days of DCA treatment, significant effect was observed on thymus weight decrease in rats (0.25 ± 0.03 g vs control 0.37 ± 0.03 g; P = .004). No significant thymus and kidney weight correlations with the rat body weight were found in the study groups (P > .05).
Histological and Immunohistochemical Investigation of the Kidney Parenchyma
The histological investigation of the kidney parenchyma did not reveal any necrosis or inflammatory changes. Immunohistochemical staining showed the NKCC2 to be located mostly in the apical cytoplasm of the TAL epithelial cells of the loop of Henle as well as in the macula densa cells. The NKCC2 expression in the DCA-treated group was strong and did not differ from the controls. The NKCC2 reactivity was used in the histomorphometrical investigation of the TAL. The TAL of epithelial cells were higher than in the control group, the median values being 7.80 and 8.43 µm (P < .001), respectively (Figure 5).
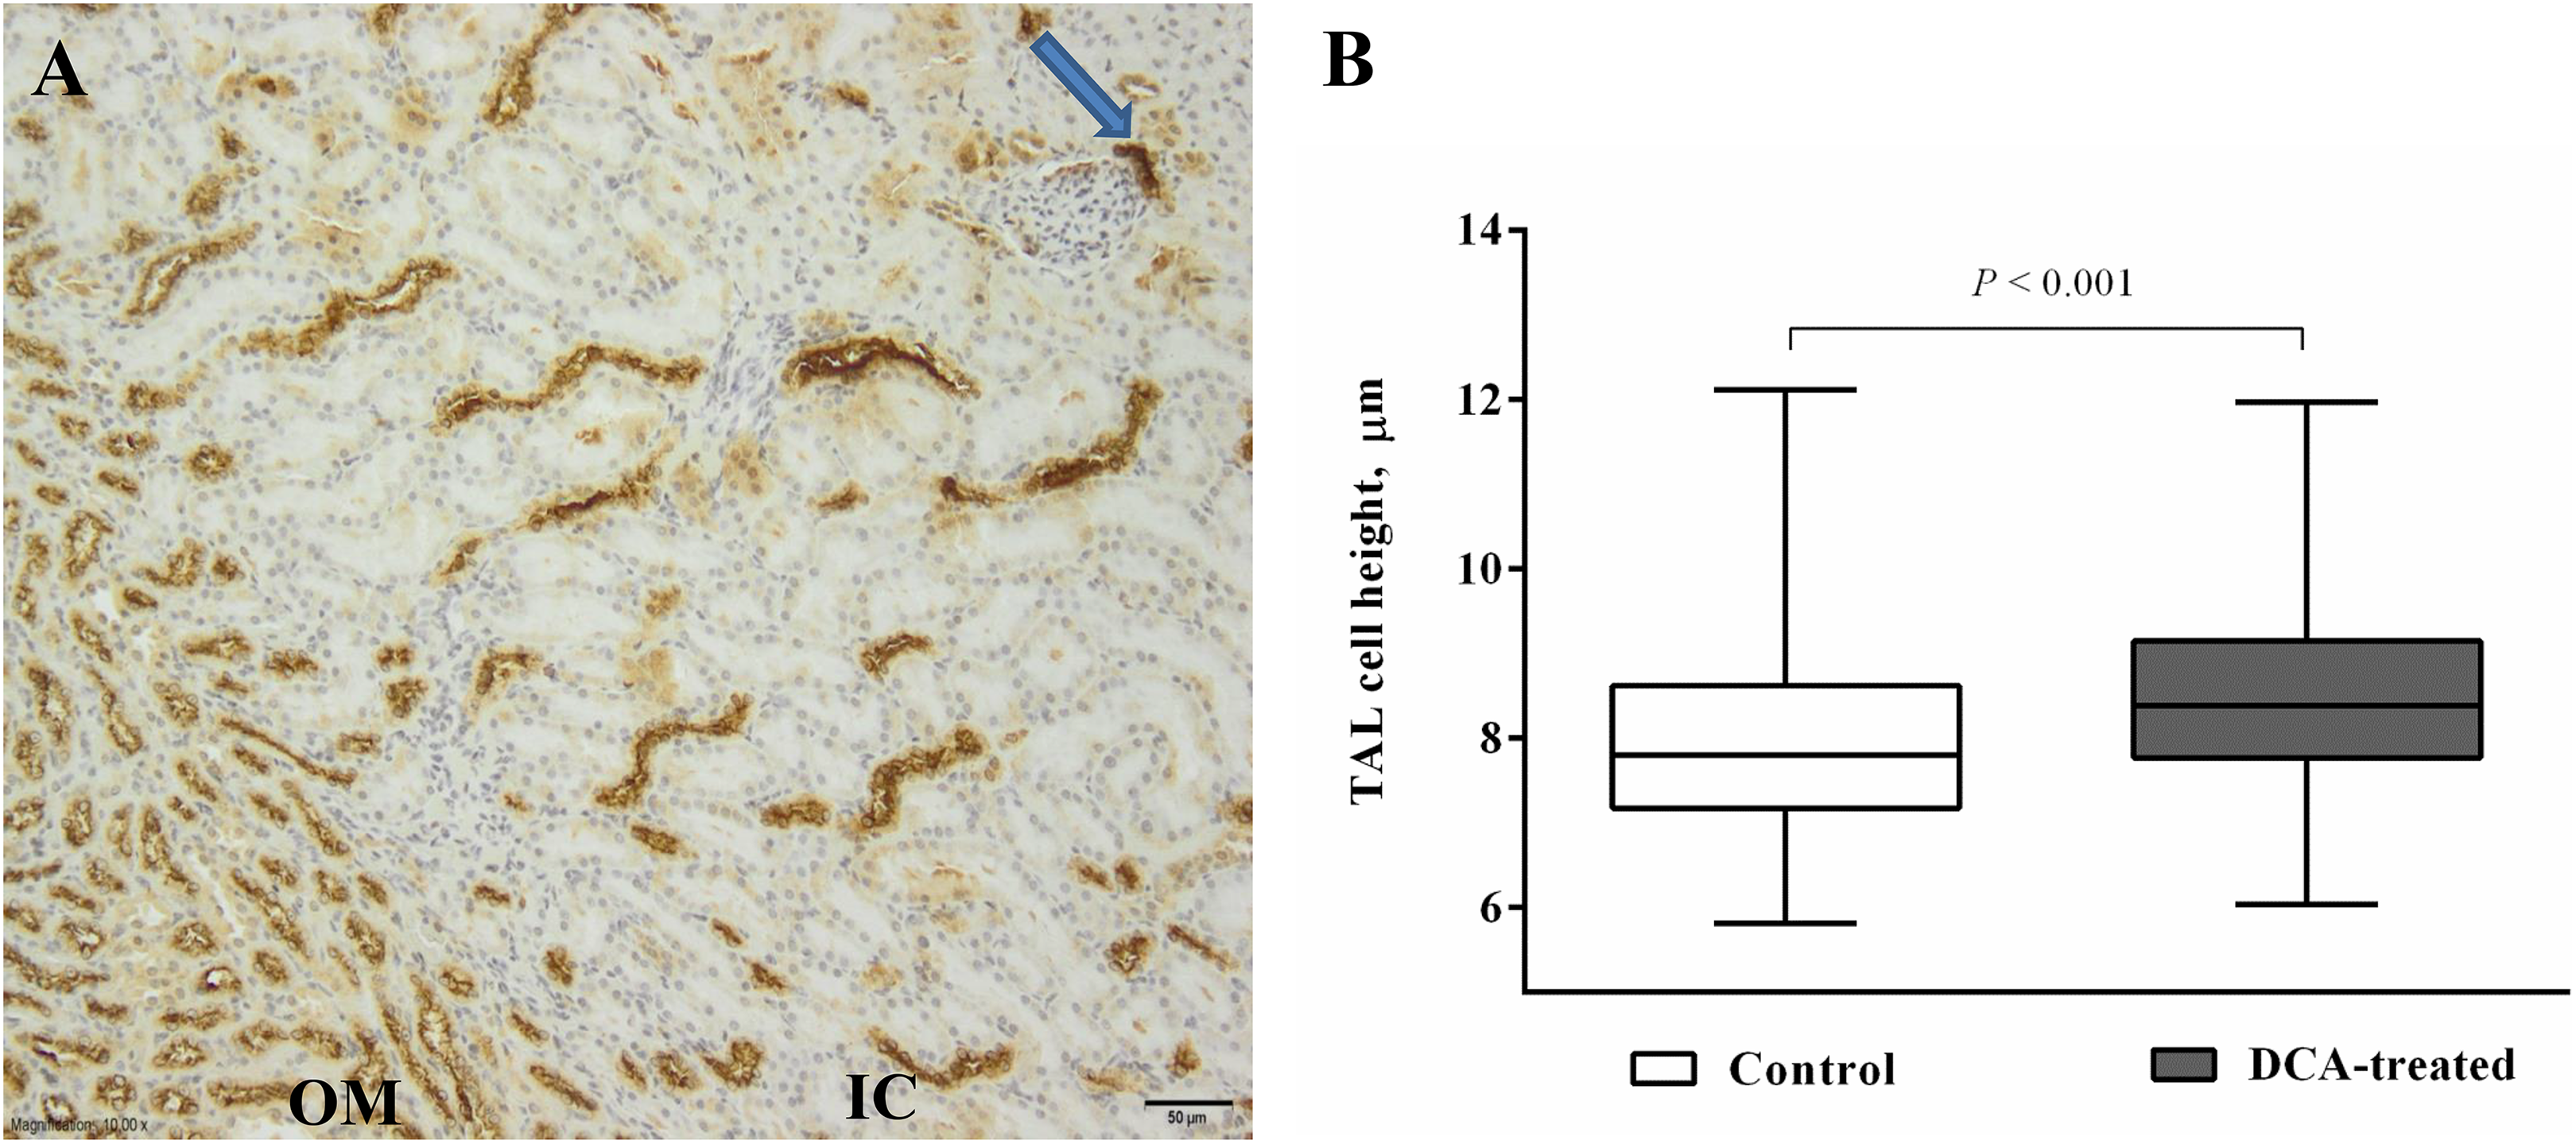
The kidney immunohistochemistry and the height of the thick ascending limb epithelial cells (TAL) in the sodium dichloroacetate (DCA)-treated and control groups. A, Immunohistochemical reaction of anti-SLC12A1 against NKCC2 in the DCA-treated and control groups was strong and did not differ; it was observed in TAL epithelial cells of the outer medulla (OM) and the inner cortex (IC) as well as the macula densa cells (arrow). Scale bar 50 µm, medium magnification. B, The height of TAL cells was measured in immunohistochemically stained slides ×400. Data are provided as median with minimum and maximum values.
Effect of DCA on RNA Expression of NKCC1 in Thymus
The CT values were determined by the real-time PCR. Differences in the expression of the Slc12a2 and Glpdh genes between the DCA-treated and the control groups are considered as ΔCT values. The Mann-Whitney U test revealed significant differences between the ΔCT values of the analyzed groups (P < .03). Figure 6A shows the Slc12a2 RNA levels in experimental groups after normalization with the Glpdh gene. The ΔΔCT is the difference between the ΔCT of the target and reference genes. The expression level (2−ΔΔCT) in the experimental conditions is 0.053-fold change lower than in the control. This indicates 94.7% downregulation of expression, as the expression level is decreased by 94.7% to the level 5.3% under control conditions (Figure 6B).
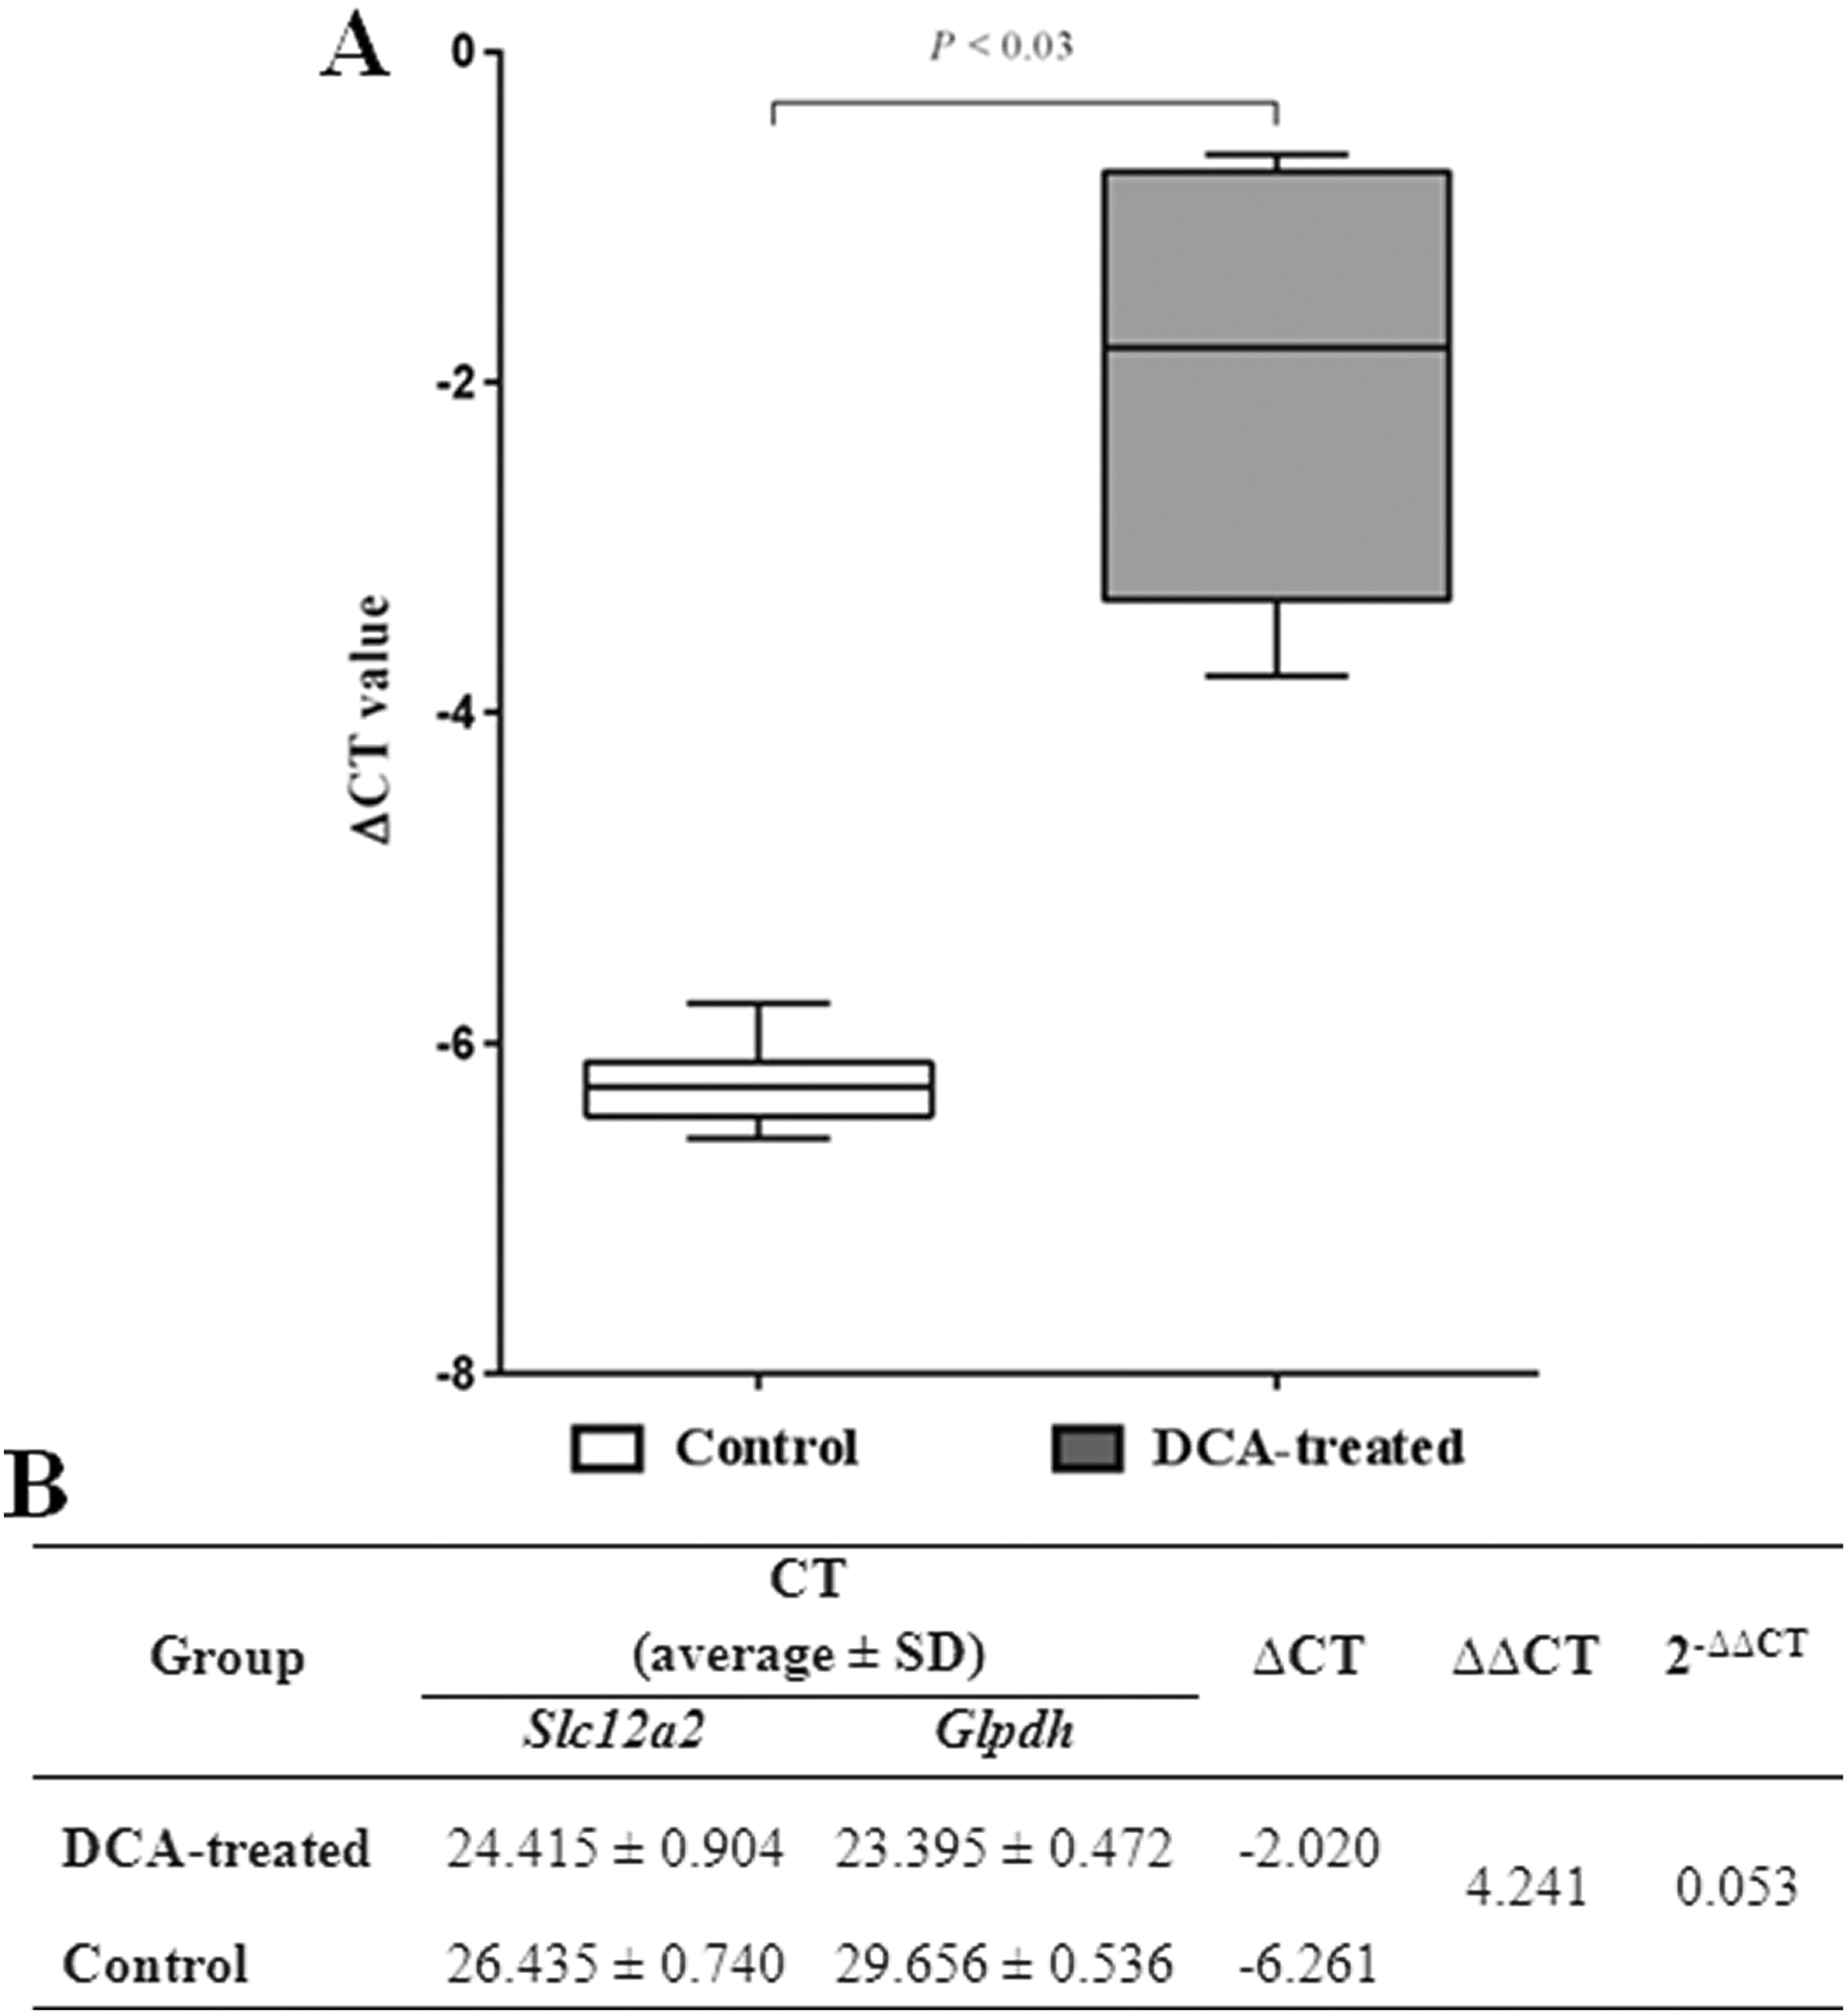
Slc12a2 RNA expression in analyzed rat groups. A, The expression ratio between sodium dichloroacetate (DCA)-treated rats and control groups (results in averages). B, Slc12a2 RNA levels in the rats after normalization with Glpdh gene. Delta threshold cycle (ΔCT) method (CT average of Slc12a2 minus CT average of Glpdh) was used for this analysis; the lower the ΔCT, the higher the expression (the horizontal bars represent the median; the minimal and maximal values are shown with short horizontal lines).
Discussion
The study shows that in rat kidney, DCA could target the NKCC2 protein and the mechanisms important for the tubular reabsorption of Na+, K+, and Cl− with significant alterations in renal Ca2+ and Mg2+ handling, which are known to be dependent on tubular Na+ and Cl− transport processes. Also, the study results show a reduced expression of the NKCC1 in thymus of DCA-treated rats. The single DCA dose treatment caused a significantly higher 24-hour diuresis in male rats when compared to the control, and this significantly increased diuresis was related to the induction of Cl−, Na+, and K+ as well as Ca2+ and Mg2+ excretion in urine. In the study, after the repeated 4-week DCA dosage, the diuresis was not increased, but the excretion of the tested Na+, Cl−, Ca2+, and Mg2+ ions was significantly higher. The increase diuresis and excretion of Na+, K+, and Cl− accompanied with an increase in divalent Ca2+ and Mg2+ in the urine are characteristic of the NKCC inhibition in kidneys. 22,23 The DCA diuretic effect was found to be related to significant loss in rat body weight during the treatment.
The NKCC belongs to the cation-dependent chloride cotransporter family; there are 2 NKCC isoforms: NKCC1 and NKCC2. The activation of NKCC is primarily controlled by phosphorylation of the N terminus of its structure. The phosphor-acceptor sites are highly preserved between NKCC1 and NKCC2; both isoforms are activated by phosphorylation in a similar manner.
24,25
The NKCC1 is distributed in various tissue types, and the NKCC2 is expressed in the kidney tubules of different species.
24,26
The NKCC1 usually acts in concert with other cation-dependent chloride cotransporters.
27
The mechanisms controlling the tubular epithelial upregulation of salt transport rates in relationship with the diuretic effect in kidney have been elucidated,
23,28
but little information exists on the adaptative processes that bring about a decrease in diuretic effect, ion transport capacity, and morphological tubular epithelial cell changes during prolonged treatment. The inward entry of Na+, K+, and Cl− across the apical membrane occurs via NKCC2.
29
Due to the limited K+ in tubular fluid, the uptake of monovalent ions via NKCC2 is highly dependent on an efficient recycling of K+ across the apical membrane.
30
The alteration in ion transport within the TAL significantly affects the Ca2+ and Mg2+ excretion in urine.
31,32
If the Na-K-2Cl co-transport is blocked, then about 25% of filtered Na+ is not reabsorbed, and some Na+ is retrieved at the expense of exchange for K+, which is excreted, and the other consequence of inhibiting Na-K-2Cl is the reduced reabsorption of Ca2+ and Mg2+; blocking NKCC2 would lead to a substantial natriuresis, some kaliuresis with calciuria and magnesiuria.
22,23
The loop diuretic furosemide as an NKCC2 inhibitor causes hypercalciuria and hypermagnesemia in experimental animals,
33
because the Ca2+ and Mg2+ transport in TAL is inhibited.
34
The furosemide targeting NKCC2 of the TAL-dependent transport by competing for the Cl− binding site
35
also leads to a marked natriuretic response.
36
As estimated by classical micropuncture studies, approximately 3% to 7% of the filtered Ca2+ and 5% to 6% of filtered Mg2+ are reabsorbed in the distal convolution.
37
The dosing regimens determine the loss of Ca2+ and Mg2+ following the diuretic effect, and systemic Ca2+ concentrations are in general much more tightly regulated than Mg2+, and this explains why a reduction in serum Ca2+ levels is rare when hypomagnesemia occurs in some patients treated with loop diuretics.
38,39
The study results show that DCA causes a more pronounced urinary Mg2
The activity of NKCC in different cell types is regulated by oxidation and nitration; the oxidative/nitrosative stress on the NKCC activity may depend on the levels of free radicals or nitric oxide (NO) donors. Free radicals and protein tyrosine nitration can affect the NKCC structure and result in changes of its function. 40,41 The inhibition of the NKCC1 activity was found in endothelial cells exposed to the oxidant tertbutylhydroperoxide. 41 The endogenously produced NO inhibits NKCC activity in the isolated TAL of the Henle loop 42,43 and in the renal epithelial cells exposed to the NO donors sodium nitroprusside and S-nitroso-N-acetylpenicillamine. 44 The DCA effect on NKCC2 might be related to the oxidative stress, as the DCA increases the generation of reactive oxygen species. 45 The DCA was found to produce time- and concentration-dependent increases in superoxide anion and NO, and DCA-induced toxic effects in zebra fish are in association with the production of reactive oxygen species. 46
The DCA single dose and repeated dosage treatment had no damaging impact on the rat kidney function: There were no changes in the blood serum creatinine and ion levels, and no changes in kidney weight were determined after a 4-week treatment. The 4-week DCA treatment caused no significant increase in K+ urine excretion, and there are no literature data that DCA could cause hypokalemia; however, further safety investigations could be purposeful. The histological investigation of the kidney parenchyma did not reveal any inflammatory changes. The immunohistochemical staining showed NKCC2 to be located mostly in the apical cytoplasm of the TAL epithelial cells of the loop of Henle as well as in the macula densa cells of control and treated rats. This corresponds to the electron microscopy findings described by Ortiz. 47 A significant amount of intracellular NKCC2 labeling has been reported in subapical vesicles. 48 We observed immunohistochemical NKCC2 staining in the apical cytoplasm and not only in the TAL apical plasma membrane, and no quantitative changes in the NKCC2 staining were observed when compared to the control and the DCA-treated rat kidney. The NKCC2 reactivity was used in the histomorphometrical investigation of TAL: The height of TAL epithelial cells was significantly higher in DCA-treated rat kidney than in the control group. The possible mechanisms involved in cellular morphological changes during DCA treatment might be the toxicity of the drug, independent of its Na-K-2Cl inhibition pharmacological effect or a consequence of their specific effect on apical transport in DCT cells. Continuous treatment with furosemide results in a substantial increase in the size of distal tubule epithelial cells, which were evaluated as cell hypertrophy. 49 -51 The elucidation of the determined changes in the height of TAL epithelial cells in DCA-treated rats requires further studies.
The rat thymus is recognized to be a valuable model for investigating the impact of medicinal products on thymocyte proliferation. The repeated DCA treatment in the study had a significant effect on thymus weight, which was found to be decreased by 32.4%. The DCA treatment was reported to significantly reduce the thymus weight in the gonad-intact rats, and such thymus weight loss could be related to the DCA-induced significant increase in thymocyte percentage in the G2-M cycle phase and the reduced percentage of the G0-G1 phase. 21 The DCA-induced G2-M phase arrest in multiple myeloma cell lines was also reported. 52 The described DCA effect might be related to the oxidative stress, as the DCA increases the generation of reactive oxygen species with a concomitant cellular shift from glycolysis to oxidative metabolism, resulting in an increased apoptosis. 45 Besides, the DCA effect is related to the p53 accumulation, and the p53-dependent pathway regulates the G2-M transition in response to the reactive oxygen species toxic stress generation. 53 The effects DCA has on T-cell differentiation were shown to be dependent on production of reactive oxygen species: DCA possesses Treg induction and Th17 suppression, which is independent of PDHK and dependent on reactive oxygen species. 54
The study showed the effect of DCA on the RNA expression of NKCC1 in rat thymus. Differences in the expression of the Slc12a2 and Glpdh genes between the DCA-treated and the control groups were found significant, and the expression of the target gene level (2−ΔΔCT) was found to be 0.053-fold lower than in the control of the reference gene, indicating the 94.7% downregulation of Slc12a2 expression in the DCA-treated thymus. The NKCC1 activity in rat thymocytes was found to be related to the chloride anion influx which is sensitive to NKCC inhibitor furosemide, indicating that the Cl− influx is partly mediated by NKCC1. 55 -57
Researchers suggest that the regulation of the cytosolic Cl− concentration would enhance the antitumor effect of anticancer medicines and that the cytosolic Cl− would be one of the key targets for anticancer therapy. 58,59 The reduction in intracellular Cl− level by inhibiting the NKCC1 could be an important factor in the cell proliferation and apoptosis mechanisms. The DCA induced the urine excretion of NaCl ions as well as induced changes in extracellular and intracellular Cl− concentration which have an important antitumorigenic effect. In cancers with a high NKCC1 expression, the NKCC1 has a potential role in the progression of cancer. 60 The NKCC1 stimulation in the early G1 phase is essential for cell proliferation in certain cell types. 24 The recent review shows the importance of NaCl ions in a tumor microenvironment as involved in disease progression mechanisms. 61 The NKCC1 is an important biomarker of extracellular and intracellular ion homeostasis regulation; it participates in cell cycle progression by modulating cell volume 24 , and the cell regulatory volume increase is regulated by the NKCC1 activity. 62 The NKCC1 is recognized as a therapeutic target, as it plays an important role in cancer cell proliferation, apoptosis, and invasion. 57,59,62
Conclusion
The study results show that the DCA has the pharmacological mode of action as an inhibitor of NKCC. The diuretic effect of DCA is related to the increased saliuresis, which is characteristic of the NKCC2 inhibition. The prolonged DCA treatment causes a decreased NKCC1 RNA expression in the rat thymus and thymus weight loss. The inhibition of NKCC with DCA may be a suitable therapeutic strategy for the treatment of cancer.
Footnotes
Declaration of Conflicting Interests
The author(s) declared no potential conflicts of interest with respect to the research, authorship, and/or publication of this article.
Funding
The author(s) disclosed receipt of the following financial support for the research, authorship, and/or publication of this article: The present study was partially funded by research fund of the Lithuanian University of Health Sciences and by the Research Council of Lithuania.