
Abstract
We considered, in general form for a 22 full factorial experiment, linear approximations of the organism’s dose–response relationship for some factors operating alone and modification of this relationship by another factor operating in the background. A typological classification of such modifications is suggested. An analysis of the outcomes obtained in a number of subchronic animal experiments on rats in which this response was assessed by changes in a large number of biomedical indices revealed that all theoretically possible variants (types) of the modification under consideration are actually observed depending on a specific index and specific harmful exposure. Statistical significance estimation procedures are formulated for each of them.
Introduction
Dose–response functions of the form Y = f (X) (where Y is the extent to which some index of the organism’s status departs from the control value, and X is the dose of a presumably harmful factor acting on it) are widely used for analyzing toxicological and epidemiological data. 1 -5 At the same time, they present a particular case of the general methodology that is used for studying the effects of various factors on any system considered as a “black box” and are important both theoretically and practically.
First of all, the presence of some functional relationship between the strength of exposure and the extent of departure in the system is certainly an important indication, if not evidence, of a causal relationship between the exposure and the departure (ie, effect or response).
Furthermore, once found, the dose–response function can be used as a statistical model («model of data») for predicting the magnitude of response under an exposure of a strength that has not been tested in a real study, that is, to make sufficiently reliable predictions within the boundaries of actual data (interpolation) or, with the degree of uncertainty growing higher, the further we go beyond these boundaries (extrapolation).
Finally, by analyzing this function or considering its geometric representation (the dose–response curve), the researcher can find grounds for constructing a conceptual or even mathematical «model of the system» or, at least, for evaluating the consistency of this or that hypothesis about the structure of the system, intrasystem relations, and processes that control them. Thus, for example, the paradoxical 2-phase pattern of the dose–response curve served as a premise for developing the concept of hormesis. 6,7 Typical power functions for the dependence of toxic agent accumulation in this or that organ on the cumulative dose under a long-term exposure to this agent served as a prerequisite to the construction of a number of multicompartmental system models of toxicokinetics reflecting some or other theoretical hypotheses concerning its control mechanisms. 8,9
It may be assumed a priori that the characteristics of the dose–response relationship depend both on the properties of the influencing chemical or physical harmful agent and on the initial status of the responding biological system. As concerns the animal organism, one can expect a priori not only interspecies, intergender, and age-related differences in the response to an increase in the dose 10,11 but also response modifications due to a disease or some prenosological health condition or due to the effect of factors changing the reactivity of the organism, including enhancing its resistance to the effect of a toxic agent. 12,13
From the same perspective, it is particularly interesting whether the dose–response relationship can be affected by a change in the organism’s reactivity due to the effect of the factor being considered (toxic agent) and another harmful exposure accompanying it. This issue takes us to the domain of a practically very important and theoretically complex problem of combined toxicity, to which our group has devoted a series of publications on the outcomes of its experimental and mathematical modeling. 14 -20 In these publications, based on our experiments involving a range of binary combinations, we gave primary consideration to the contradictory assessment of the so-called “type of combined action.” In particular, we postulated that (1) for this assessment, the widely recognized paradigms of effect additivity and dose additivity (Loewe additivity) are virtually interchangeable and might be regarded as different methods for modeling combined toxicity rather than as concepts reflecting fundamentally differing processes; (2) within both paradigms, there exist more than 3 traditionally recognized types of combined toxicity (additivity, subadditivity, and superadditivity), and we found at least 10 variants of it, depending on exactly which effect is considered and what its level is, as well as on dose levels and their ratio; (3) when dealing with multi-outcome chronic or subchronic combined intoxication, one may find some indices in respect to which 2 toxic agents act oppositely, and we proposed to discriminate between “hidden antagonism” (in the case of subadditivity of unidirectional effects) and “explicit antagonism” (in all cases of opposite effects).
At the same time, given the special scientific and practical value of the dose–response relationship, we believe it useful to analyze the same experimental material from another angle by putting the question as follows: could this relationship, as established for some harmful factor, be modified more or less substantially if the organism is exposed not only to this factor but also to another one at the same time? The initial data for answering this question tentatively can be found in our analysis of the combined toxic effect of lead (Pb) and cadmium (Cd). 14 The aim of the present study was to look for solving this problem more consistently based on the entirety of the results obtained in the experiments with a range of binary toxic combinations.
Materials and Methods
The General Design of the Animal Experiments
In this article, we analyze the results of several subchronic experiments of similar design in which we compared the effects of factors acting alone or together in the following binary combinations: Pb and Cd, Pb and fluoride (F), manganese (Mn) and chromium (Cr), Mn and nickel (Ni), Ni and Cr in the chemical form of water-soluble salts; Mn and Ni in the form of metal oxide nanoparticles (NPs); and fluoride and static magnetic field (SMF).
All experiments were carried out on outbred female white rats (from our own breeding colony) with an initial age of about 4 months and body weight around 200 g, 15 animals in each exposed and control group. All rats were housed in conventional conditions, breathed unfiltered air, and were given standard balanced food and bottled water. The study was planned and implemented in accordance with the “International Guiding Principles for Biomedical Research Involving Animals” developed by the Council for International Organizations of Medical Sciences (1985) and was approved by the ethical committee of the Ekaterinburg Medical Research Center for Prophylaxis and Health Protection in Industrial Workers.
The model of each subchronic intoxication with soluble salts of the toxic elements listed above was created by their repeated intraperitoneal injections to rats 3 times a week during 6 weeks (totally, 18 injections). The dosage of the salts in the different experiments were equivalent to 0.025 median lethal dose (LD50) or 0.5 LD50 or 0.1 LD50 estimated preliminary. In each experiment, the doses for the paired toxics given separately or in combination were equivalent in respect to their LD50. Animals in the control (zero dosage) groups were administered normal saline in the same volume (0.5 mL per rat).
The general design of the experiments with metal oxide NPs was the same but their dosage was not isoeffective in respect to LD50 but equal in mass: 0.25 mg per rat in 1 mL of the NP suspensions.
In 1 experiment, rats were exposed to sodium fluoride intraperitoneally as described above and/or to the whole body impact of an SMF with induction 25 ± 0.05 mT for 2 or 4 hours a day, 5 times a week. We assumed the doubling of a single exposure time to be equivalent to the doubling of the dose of magnetic energy.
After the exposure period, the following was performed for all rats: weighing; estimation of the central nervous system (CNS) ability to perform temporal summation of subthreshold impulses in a variant of the withdrawal reflex and its facilitation by repeated electrical stimulations in an intact, conscious rat 21 ; recording of the number of head dips into the holes of a hole board, which is frequently used for studying the behavioral effects of toxicants and drugs 22,23 ; collection of daily urine for analysis of its density, urine output, coproporphyrin, delta-aminolevulinic acid, creatinine, and relevant toxic element contents.
Then, the rats were killed by decapitation, and their blood was collected by exsanguination. The liver, spleen, kidneys, and brain were weighed. The biochemical indices of the blood usually included total serum protein, albumin, globulin, triglycerides, cholesterol, high- and low-density lipoproteins, bilirubin, ceruloplasmin, reduced glutathione, malondialdehyde, alkaline phosphatase, alanine transaminase and aspartate transaminase, catalase, gamma-glutamyl transferase, creatinine, and in some experiments also thyrotropic hormone of hypophysis, thyroxin, and triiodothyronine, follicle-stimulating and luteinizing hormones, progesterone, dehydroepiandrosterone, estradiol, and neuron-specific enolase. We used the MYTHIC-18 (Orphee, Switzerland) auto-hematology analyzer for determining the hemoglobin content, hematocrit, thrombocrit, mean erythrocyte volume, and red blood cell, white blood cell, and thrombocyte counts. The proportion of reticulocytes was counted using the routine technique. Cytochemical determination of succinate dehydrogenase (SDH) activity in lymphocytes was based on the reduction of nitrotetrazolium violet to formazan, the number of granules of which in a cell was counted under immersion microscopy.
In all experiments, histological changes were described and estimated morphometrically in the liver, spleen, and kidneys, additionally, in the brain in the experiments with Mn and nickel oxide (NiO) NPs and in the femoral bone in the experiments with fluoride, Pb, and magnetic field. Thus, the total number of indices the shifts in which under a harmful exposure served as indicators of its effect on the organism amounted to 30 to 50.
Methods of Mathematical Analysis
Irrespective of the specific objectives that were set for the above experiments, we had 4 groups of rats in each of them (one of which was control), which places them within the category of the so-called type 22 full factorial experiment. 24,25 Thus, we have only 2 groups for determining dose dependence, with a toxicant both acting alone and in combination with another toxic agent. Using group mean values of the effect indices, we have data only for linear representation of the dose–response function. Irrespective of whether such linear approximation of this function is adequate for a 22 experiment, its linear representation is unavoidable. At the same time, linear approximation appears to be quite satisfactory in some ranges of doses in the case of a nonlinear dose–response relationship as well. For example, if the dose–response curve is S-shaped, then this relationship near its point of inflection can be described by a linear function to the second-order accuracy.
We plot such a linear dose–effect relationship in the form of a graph in which the x-axis labels the values 0 and D coding zero exposure to this toxicant and exposure to it at dose D, whereas the y-axis shows mean values by which index Y departs from the control. For certainty, we number the toxic chemicals as X1 and X 2; accordingly, D 1 and D 2 are their experimental doses. Figure 1 shows the effect of the first toxicant, X 1, in the absence of a second one (X 2 = 0); the same graph may be plotted for the effect of the toxicant X 2 for X 2 = D2.

Linear representation of the dose–response relationship for 1 toxicant.
For clarity, both graphs are, as a rule, plotted in the same Cartesian coordinates (Figure 2), also called interaction plots. 26 They help describe geometrically the combined effect of toxicants. However, in what follows we will mainly be using them for comparing the action of a given toxicant alone and in combination with another toxicant. In Figure 1 and all subsequent plots, we use symbols for the group mean values of index Y as follows: □—the mean value of an index in the control group, ○—the mean value of an index in the group exposed to one of the toxicants alone. In Figure 2 and subsequent plots ▪ denotes the mean value of an index in the group exposed to a given toxicant in the presence of another toxicant (at a dose as defined by the experiment).

Typical cases of mutual positions of the dose–response lines for toxicant X 1 and index Y (the line connecting □ and ^) and the same toxicant X 1 and index Y in the presence of toxicant X 2 (the line connecting ^ and ▪). A, Parallel lines; B, nonparallel lines with differing slopes of the same sign; C, nonparallel lines with slopes of opposite signs; D, significant dose dependence on toxicant X 1 and absence of this dependence in the presence of toxicant X 2; E, absence of dose dependence on toxicant X 1 and presence of such dependence in a combination with toxicant X 2.
For the linear dose–response function, the basic indicator to characterize its behavior is the slope of the line. Hence, in a comparison of the behavior of a dose–response relationship for 1 toxicant alone and for the same toxicant with another toxicant acting in the background, the coinciding slopes of the straight lines will correspond to an identical behavior of these functions, whereas the differing slopes will show a modification of the dose dependence in the combined effect in comparison with the isolated action. The case where both straight lines are horizontal, that is have a zero slope, will correspond to a situation in which an index does not depend on exposure either to each of the toxicants alone or to their combination. The latter situation is not interesting for the toxicologist, and we are not considering it here. The case where 1 straight line is horizontal and the other has a significant slope presents interest, and we consider it below.
An analysis of possible cases of the behavior demonstrated by the dose–response straight lines for a separate effect of 1 toxicant and its effect in a combination with another toxicant leads to the following types of plot (Figure 2), which are described in more detail below. Figure 2 shows model plots for typical cases of mutual positions which linear approximations of the dose–response relationship could occupy. In the section Results and Discussions, however, we consider concrete indices, toxicants, and their doses corresponding to the above case studies.
Note that in all our experiments, all variants of the interaction plots presented in Figure 2 were always present for this or that index, which fact confirms the universal character of the proposed classification. Specifically, these theoretically possible variants are as follows: Parallel lines, pointing to the same character of response to a toxicant, both alone and in the presence of a second factor. It is important to note that the parallelism of the lines means not only the qualitative sameness of the first toxicant’s effect but also its quantitative expression, which in the presence of a second factor differs from the separate action only by the presence of an additive constant. Nonparallel lines having different slopes of the same sign. As well as in the previous case, this situation means that a given toxicant in combination with another toxicant acts in the same manner as when operating alone, but the “strengths” of the respective responses displayed by the index (expressed by the slopes of the lines) differ depending on whether the toxicant acts alone or in the presence of another toxicant. In other words, the addition of a second toxicant leads only to the slowing down or acceleration of the change in the response in comparison with the separate effect of the first factor. Nonparallel lines having slopes of opposite signs. In this case, the character of the response to an agent changes under concomitant exposure to the second one not only in magnitude but also in direction. For example, the first toxicant acting alone reduces an index while enhancing the same index when acting in the presence of the second toxicant. It is obvious that this is a more radical change in the response than in the case of Figure 2B, reflecting some qualitative changes in the response of the organism to the toxic impact.
The dose–response linear function has a significant nonzero slope (of any sign) with a toxic agent acting alone, whereas the same function in the presence of another toxicant is constant and equal to zero (to be more exact, the magnitude of the response does not differ from zero statistically significantly). For example, the effect of the first factor alone is significant, whereas in the presence of a second factor, the corresponding dose–response line has a nonsignificant slope. Thus, in this case, it is possible to state that the second factor operating in the background renders the action of the first factor nonsignificant.
In this case, the dose–response linear function is constant (in the same sense as above) for the separate action of the first toxicant but becomes significantly distinct from zero in the presence of another toxicant. Thus, it is the presence of the other agent that makes the effect of the first toxicant evident.
Note that the plots shown in Figure 2 can have various forms but nevertheless they remain within the described classes (Figure 2A-E). For example, in Figure 2A and B, the lines can decrease rather than increasing. Besides, the positions of the lines are estimated allowing for the statistical significance of the corresponding differences, that is, after testing some statistical hypotheses, which we will now describe in more detail.
For formalizing the problem, let μ
ij
denotes the expectation of a response in exposed group X
1 = i, X
2 = j, where i, j = 0, 1, and by convention, μ00 = 0, and Null hypothesis The test of whether the 2 straight lines have slopes of the same sign breaks down into cases in accordance with the possible signs of these slopes. Since the slope of the single-factor dose–response line for the first toxicant is defined by the difference μ10 − μ00, we first test the hypothesis A similar reasoning holds for testing the hypothesis that the slopes of the dose–response lines have opposite signs. This case takes place when the following pairs of hypotheses are true: The test of the hypothesis that the effect of the first toxicant becomes nonsignificant in the presence of a second one is defined by the validity of the hypotheses: Similarly, the test of the hypothesis of a significant effect produced by the first toxicant in the presence of another toxicant is defined by the validity of the hypothesis:
Mathematical methods required for testing the above-described cases are the standard methods of ANOVA, and thus, we will not describe them here. The reader is referred to the corresponding literature. 26,27 The possibility of exact mathematical formulation of the above types of effect modification in the form of statistically tested hypotheses enables one to apply to the problem of estimating the character of dose-dependent modification of 1 factor in the presence of another factor, the concepts of statistical significance, errors of the first or second kind, power of the test, etc.
Results and Discussion
Specific toxicological effects of this or that separate or combined impact were presented and discussed in original publications. 14 -20 In the framework of the present paper, it should suffice to state that we dealt with moderate subchronic intoxications without lethal outcomes. The various systems of the organism respond to toxic impacts in various ways, which is reflected in a variety of possible types of mutual positioning of the linear dose–response functions. In what follows, we will discuss the basic types that express this variety, illustrating the discussion by actual dose–response-dependent plots. In these plots, the response will be denoted as ▵Y, meaning a difference between the mean value of some index for the organism’s status in an exposed group and its mean value in the control group. Since departures from the control values can go in the direction of both greater and lower values, ▵Y can take positive or negative values. For example, negative values for albumins in Figure 3 mean that the effect of any of the toxicants or of their combination reduces the blood serum level of albumins in comparison with the control level.

Parallel dose–response lines for cadmium impact on albumin (A) and globulin (B) serum levels. 14 The top lines in both plots show the behavior of an index for the effect of cadmium (Cd) alone. The bottom lines show the response of a corresponding index for the effect of Cd in the presence of lead (Pb) at a dose of 0.05 median lethal dose (LD50). In both cases, the dependence of the index on the effect of Cd, both alone and in combination with Pb, is of the same character (the straight lines have the same slope); however, the presence of Pb results in the extent of the response being lower than for the effect of Cd alone.
Besides, when estimating the character of dose-dependent modification, one should consider the presence or absence of any statistical significance in the differences between group mean values. As a rule, we will not expand on any corresponding instances specially since they will be clear from which type of dose-dependent modification a particular case may be referred to.
Figure 3 shows a plot for 2 indices (albumin and globulins in blood serum, g/L), which demonstrate an identical linear response to an isolated impact of Cd and to its impact in the presence of lead. For albumins, the effect of both toxicants is manifested in a reduction of the index (unidirectional action of the toxicants). On the contrary, for globulins, the impact of Cd, both alone and in combination with Pb, increases the index, whereas Pb alone reduces it (contradirectional action of the toxicants).
The situation of parallel dose–response lines is a case where the presence of a second toxicant influences the type of the dose–response dependence for the action of the first toxicant, changing only the absolute response value while keeping the speed of its change invariable.
All other cases of mutual positioning of dose-dependent linear approximations present a more complex modification of the single-factor dependence of this toxicant’s effect in the presence of a second toxicant. Some typical plots of this kind are shown below.
As an example, let us consider the following 2 plots (Figure 4), which demonstrate the same behavior of dose dependence for a single factor alone and in the presence of another toxicant. As described in Methods of Mathematical Analysis, the plots in Figure 4 can be interpreted as attenuation of the dose dependence of the corresponding indices on the dose of 1 agent, SMF (Figure 4A) or Cr (Figure 4B), against the background effect of another one, fluoride (Figure 4A) or Mn (Figure 4B), respectively. Indeed, the top line in Figure 4A represents a 1-factor effect of SMF leading to a significant decrease in the index “Number of osteocytes” in comparison with the control group. With fluoride added, the effect of SMF remains similarly inhibitory but less sharp (the slope of the corresponding line is less steep). Figure 4B is interpreted similarly with the only difference that a sharp increase in the 1-factor line due to the impact of Ni is replaced by a less steep growth under the effect of Ni with Cr operating in the background.
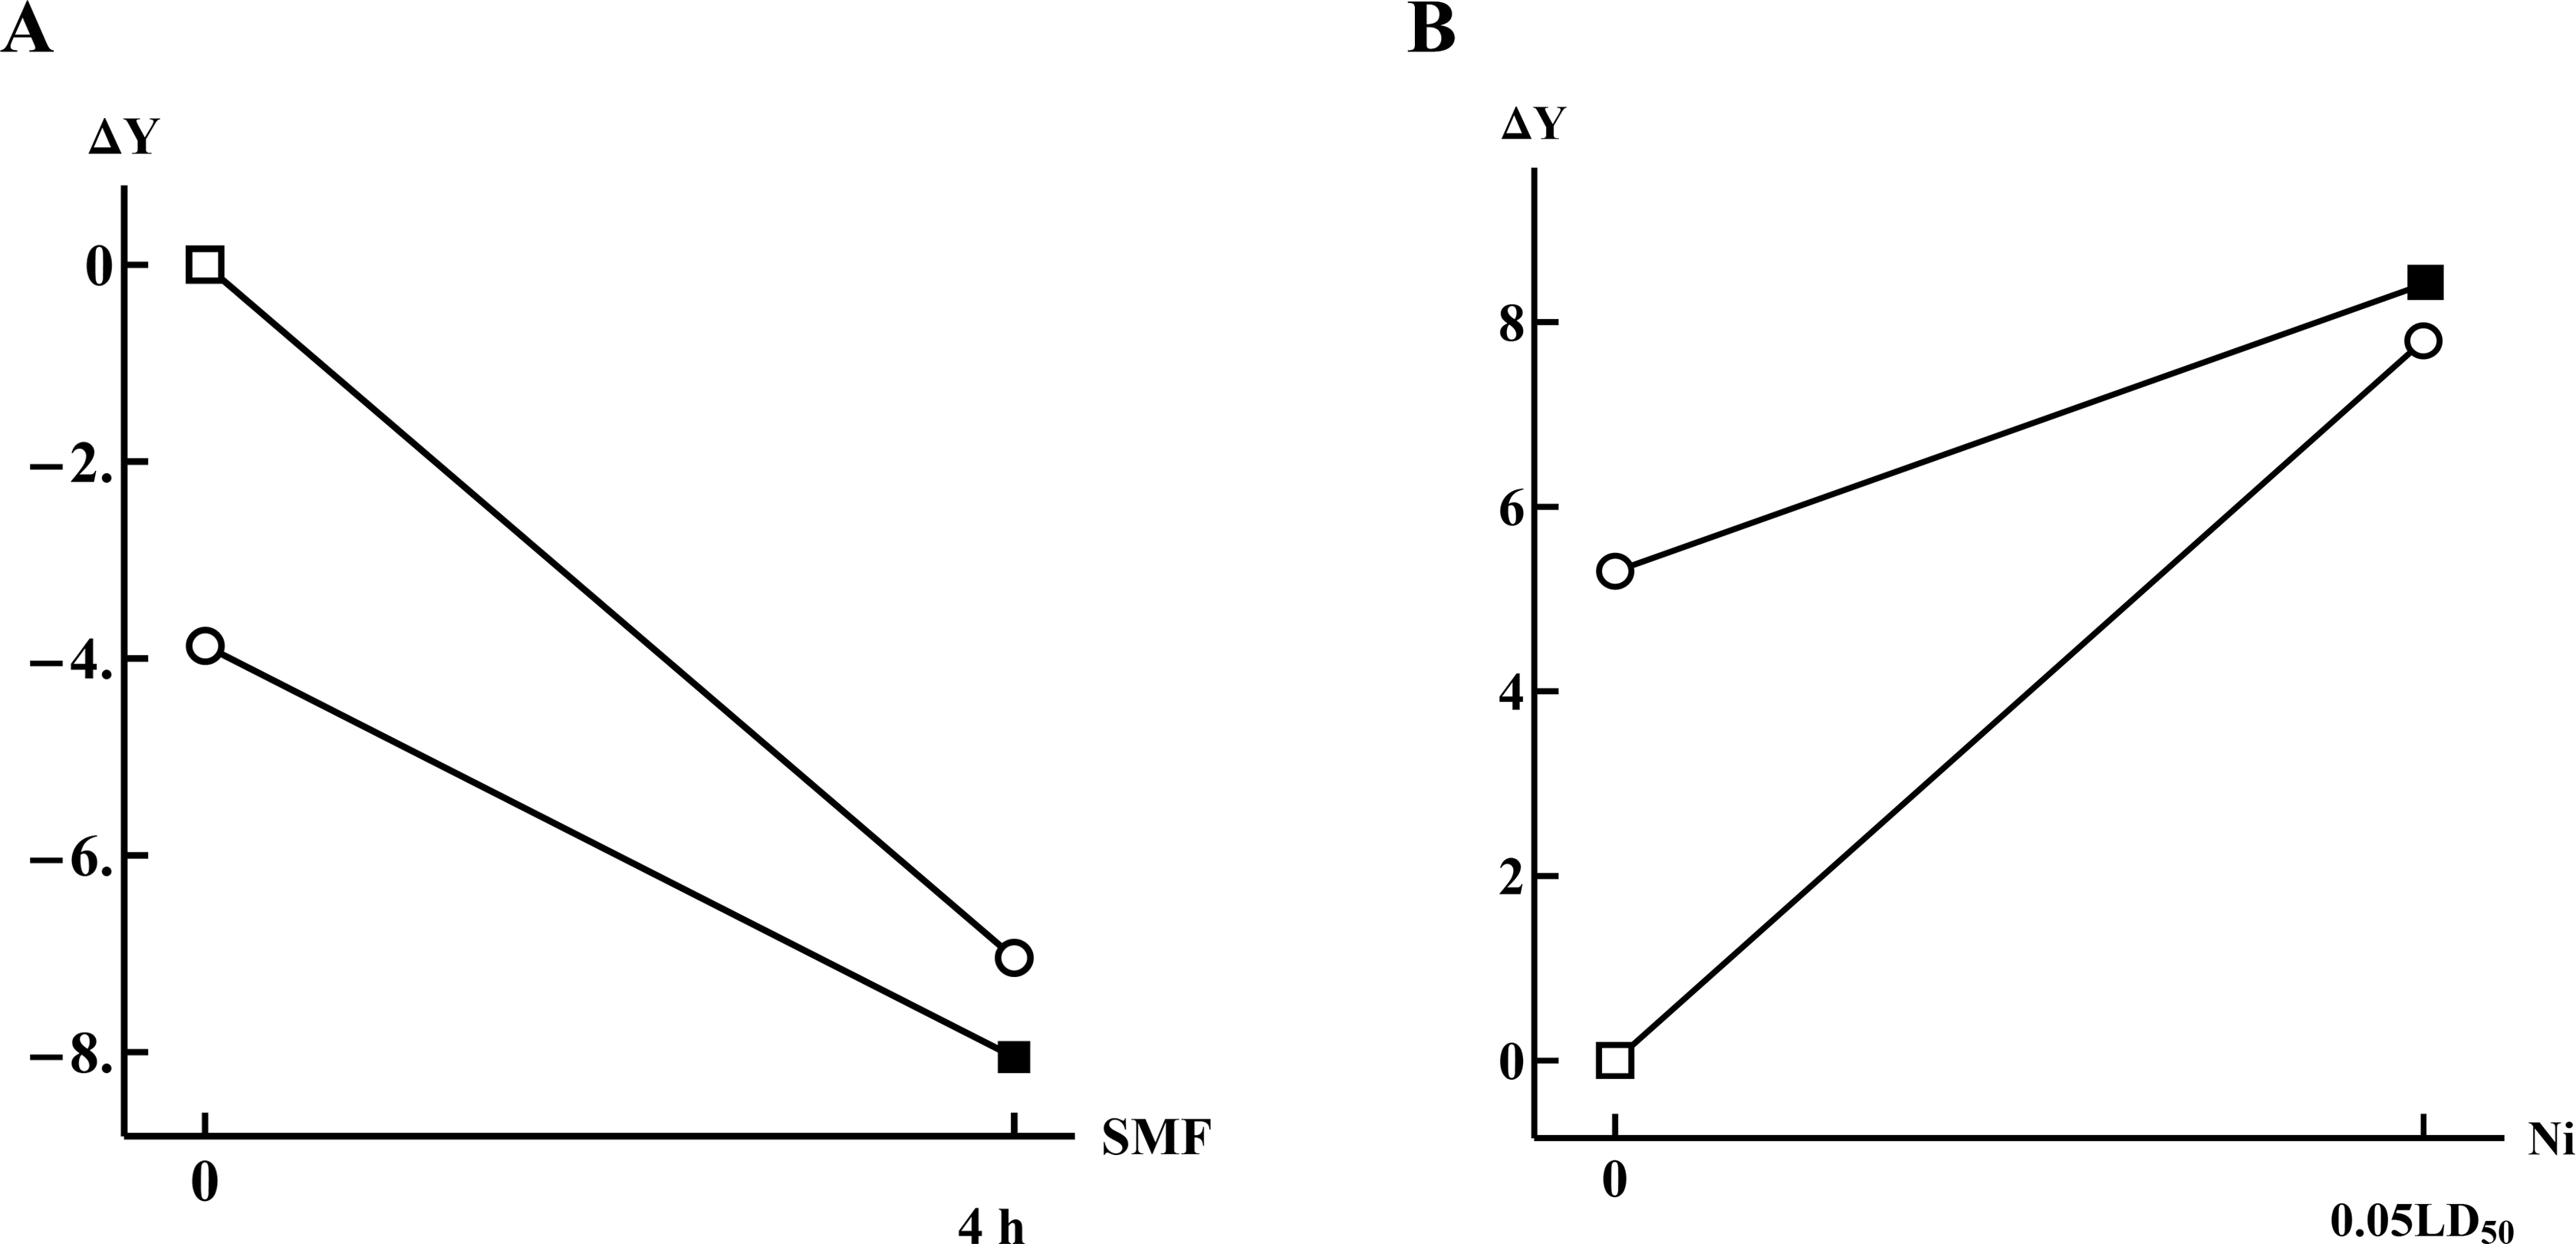
The dose–response lines having identical signs of their slopes: A, negative slope for the effect of the static magnetic field (acting alone or in the presence of fluoride) on the number of osteocytes in the compact bone tissue 20 ; B, positive slope for the effect of the nickel (acting alone or in the presence of chromium) on the of banded neutrophil percentage in blood smears. 19
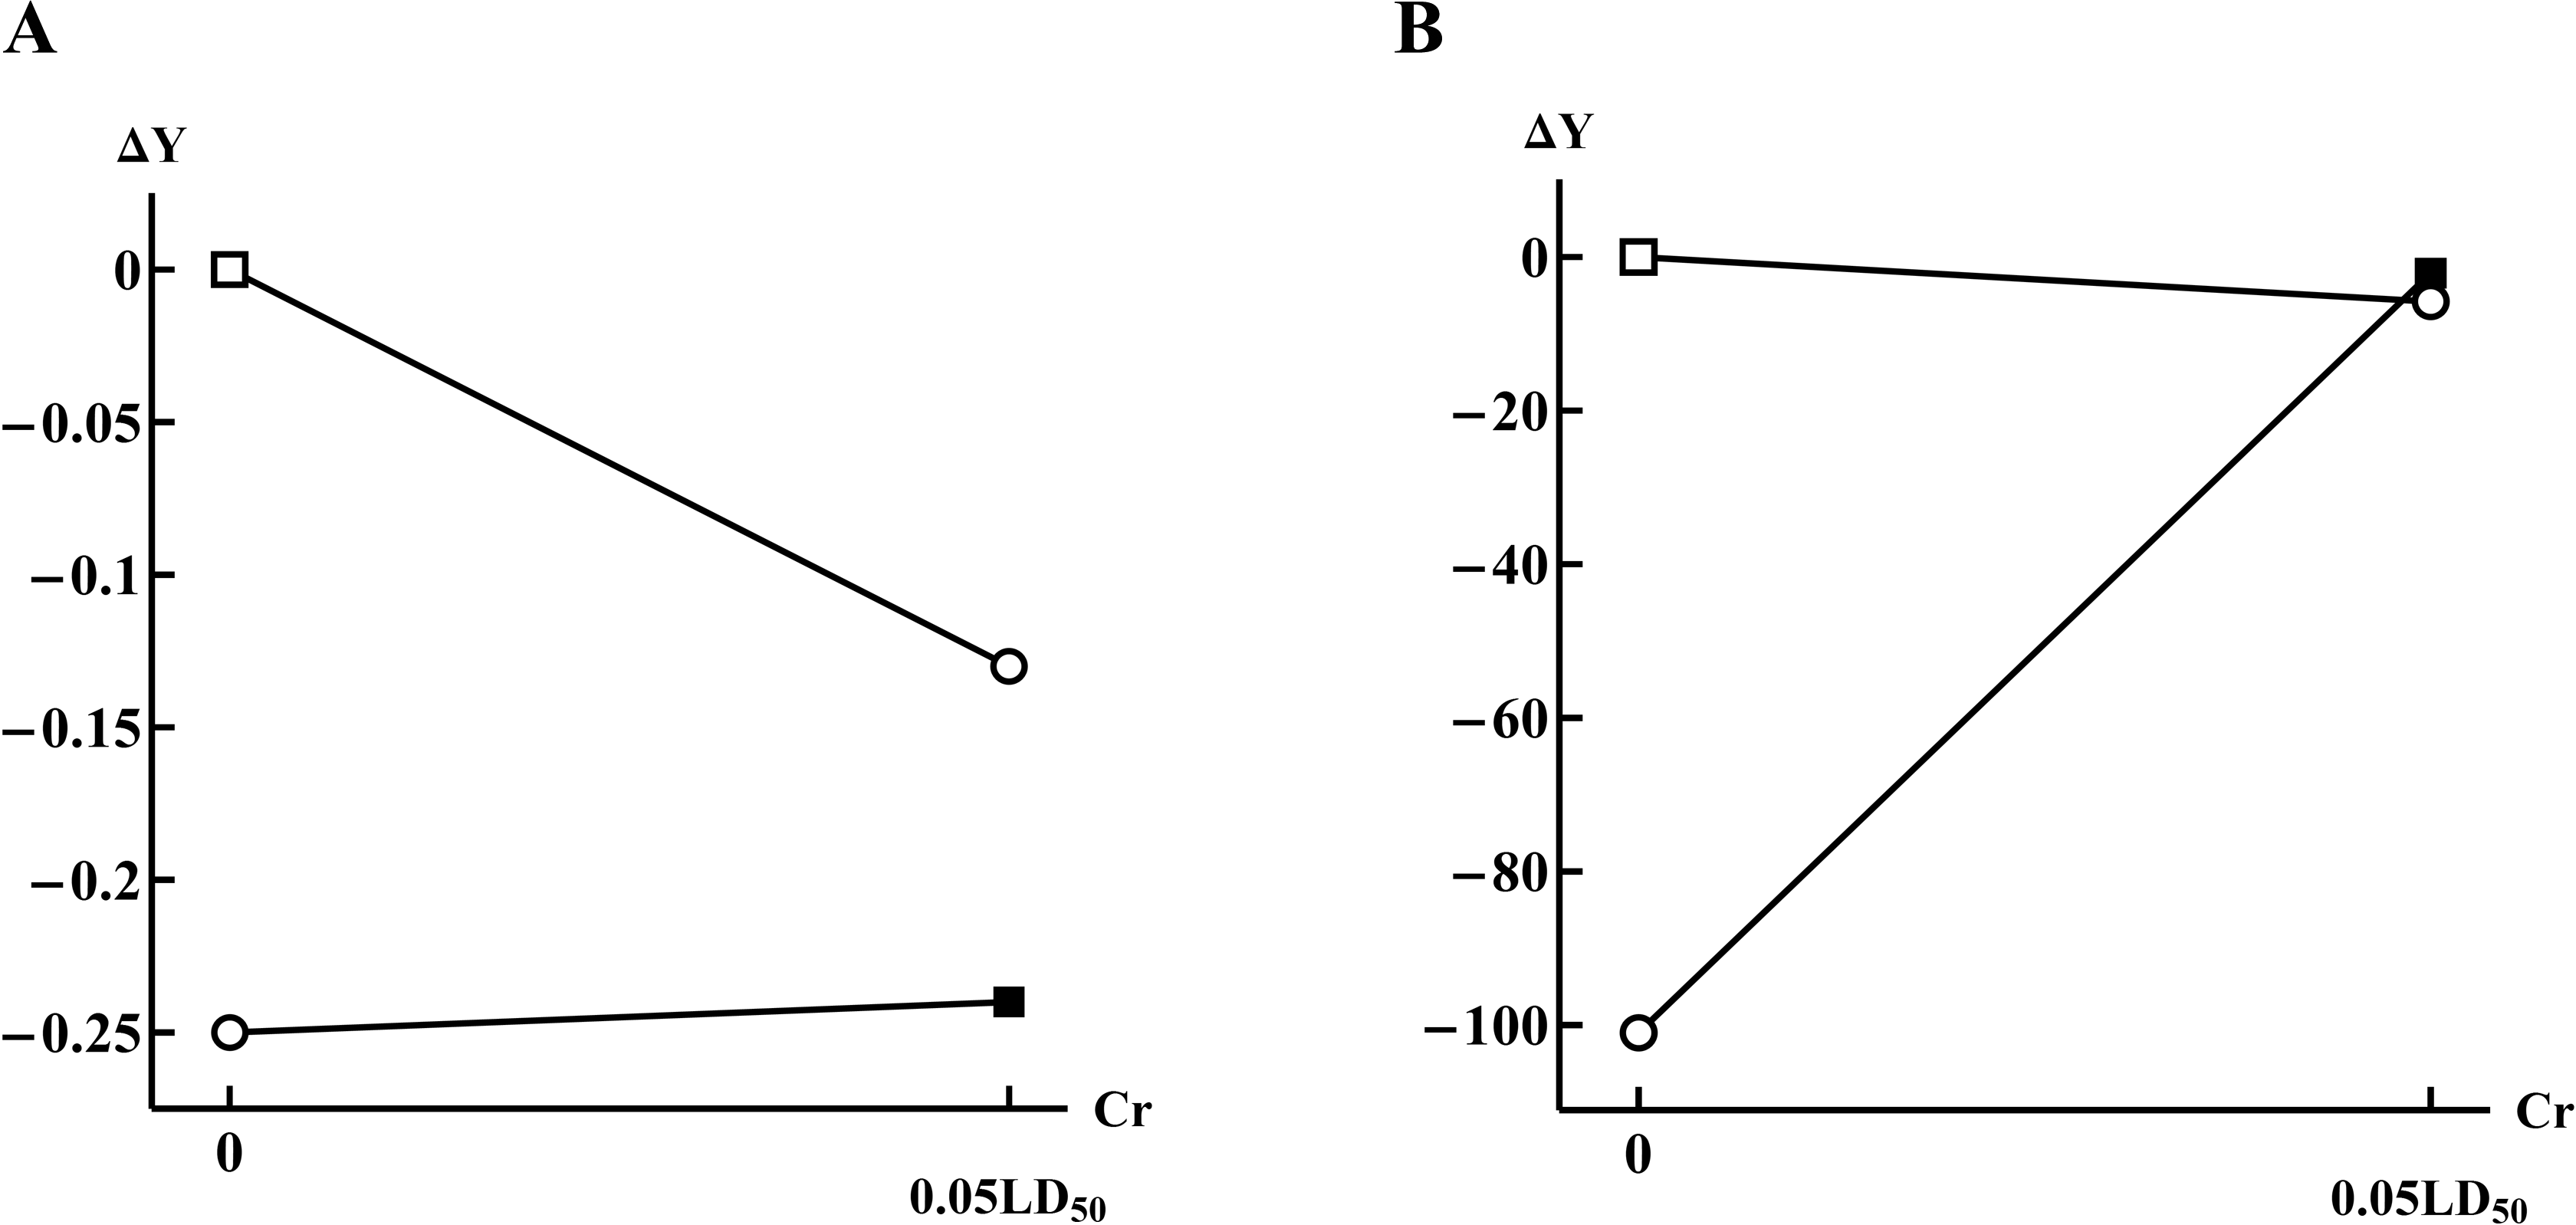
To illustrate the case where a single-factor dose dependence of the response is opposite in character in comparison with the same dependence in the presence of a second toxicant, let us consider the following 2 indices (Figure 5). Figure 5A shows linear dose–response functions for the index “the percentage of undamaged neurons in the brain caudate nucleus” after repeated intraperitoneal injections of NiO NPs and/or Mn (II,III) oxide (Mn3O4) NPs at a dose 0.50 mg per rat 18 and “the number of osteocytes in the compact bone tissue” (counted per a square of Avtandilov grid). 15

Dose-response lines having slopes of the opposite signs: A, for the effect of the nickel oxide nanoparticles (acting alone or in the presence of manganese oxide nanoparticles) on the percentage of undamaged neurons in the brain caudate nucleus 18 ; B, for the effect of the lead (acting alone or in the presence of cadmium) on the number of osteocytes in the compact bone tissue. 15
The top line in Figure 5A shows 1-factor dependence of the index “the percentage of undamaged neurons in the brain caudate nucleus” under the effect of NiO NPs, expressing a statistically significant reduction in the number of such cells in caudate nucleus. If Mn3O4 NPs are added, the dose–response dependence for the effect of NiO NPs on the same index becomes opposite, increasing the number of such cells (which, however, remains markedly lower than in the control group or even compared with a full dose of Ni alone). Nevertheless, the opposite effect of Ni NPs in the presence of Mn3O4 NPs in comparison with the effect of Ni NPs alone is statistically significant.
Similar analysis of Figure 5B shows that the effect of Pb alone leads to a significant increase in the Number of osteocytes in the compact bone tissue, while Pb in the presence of F reduces the number of these cells to a level that is approximately equal to their group mean number for the effect of Pb alone.
Thus, both these cases demonstrate the possibility of oppositely directed linear approximations for the dose–response relationship under a single-factor effect of 1 toxicant and for its action with another toxicant being present. It should be emphasized that such behavior is one of the widespread types of effect modification observed in various experiments (thus, in the examples of Figure 5A, this is the impact of NPs, whereas in Figure 5B, it is one of soluble chemicals).
Finally, a remarkable type of dose-dependent modification is described in Methods of Mathematical Analysis (Figure 2D and E), in which the effect of one of the toxicants in the presence of another one becomes either more significant or, on the contrary, nonsignificant as exemplified here by Figure 6.
Dose-response lines in cases when a significant effect of a separate impact becomes insignificant in the presence of another (A, for the effect of chromium (acting alone or in the presence of nickel) the RBC count 17 ) or vice versa (B, for the effect of chromium (acting alone or in the presence of manganese) on the lymphocyte succinate dehydrogenase activity. 19
In the case of Figure 6A, the single-factor effect of Cr leads to a significant reduction in the erythrocyte count in comparison with the control group. However, the presence of Ni in the background leads to a lack of response in the index to a change in the Cr dose. On the contrary, in another experiment with Cr, 19 the index “SDH activity” does not respond to a change in the dose of Cr while sharply increasing to the level of the control group if Mn is added in the background.
The above examples demonstrate typical cases of modification experienced by linear approximations of the dose–response relationship in a 22 full factorial experiment. Despite the variety of possible types of line positioning in corresponding plots, it seems reasonable to highlight the 5 types presented in Figure 2 and described in detail there as well. Not only do these types reflect the quite clear picture of dose-dependence modification in the presence of another toxicant, they also allow a correct way of statistically testing the significance of the effect observed. In Methods of Mathematical Analysis, we have described the basic ideas of such computations for each of the types of dependence modification considered.
Conclusion
Type 22 full factorial experiment is widely used in toxicological research. The outcomes of such an experiment are often employed for assessing the type of combined effect produced by potentially harmful chemical (and, less often, physical) factors. However, the same outcomes can be used for assessing modifications in the dose–response dependence for an isolated effect of any factor in the presence of another factor operating in the background.
By assuming that a linear approximation of dose dependence obtained by applying ANOVA or regression analysis is correct (which is tested by the standard statistical procedures mentioned below), we are enabled to identify the character of the modification of this dependence as established for 1 factor that is or is not caused by the simultaneous influence of another factor. A preliminary theoretical analysis has shown that all conceivable variants of this modification naturally break down into 5 basic types, which can be given unambiguous informative (in this case, toxicological) interpretation. Moreover, these types can be identified by adequate statistical procedures, allowing the use of the concepts of statistical significance, error of the first or second kind, strength of the test, and so on.
The theoretical constructions have been tested on a broad range of experimental studies which our group has carried out in recent years. All the presumably possible types of dose-dependent linear approximation modifications depending on specific index and specific harmful exposure have been found to be really present in all of these studies, thus confirming the universal character of the proposed classification.
Footnotes
Declaration of Conflicting Interests
The author(s) declared no potential conflicts of interest with respect to the research, authorship, and/or publication of this article.
Funding
The author(s) received no financial support for the research, authorship, and/or publication of this article.