
Abstract
Because bisphenol A (BPA) is a high production volume chemical, we examined over 500 peer-reviewed studies to understand its global distribution in effluent discharges, surface waters, sewage sludge, biosolids, sediments, soils, air, wildlife, and humans. Bisphenol A was largely reported from urban ecosystems in Asia, Europe, and North America; unfortunately, information was lacking from large geographic areas, megacities, and developing countries. When sufficient data were available, probabilistic hazard assessments were performed to understand global environmental quality concerns. Exceedances of Canadian Predicted No Effect Concentrations for aquatic life were >50% for effluents in Asia, Europe, and North America but as high as 80% for surface water reports from Asia. Similarly, maximum concentrations of BPA in sediments from Asia were higher than Europe. Concentrations of BPA in wildlife, mostly for fish, ranged from 0.2 to 13 000 ng/g. We observed 60% and 40% exceedences of median levels by the US Centers for Disease Control and Prevention’s National Health and Nutrition Examination Survey in Europe and Asia, respectively. These findings highlight the utility of coordinating global sensing of environmental contaminants efforts through integration of environmental monitoring and specimen banking to identify regions for implementation of more robust environmental assessment and management programs.
Introduction
As countries develop and urbanize, production demands, such as food and beverage packaging, medical equipment, electronics, flame retardants, adhesives, building materials, automobiles, and paper coatings increase globally (Staples et al. 1998; vom Saal and Hughes 2005; Kanga et al. 2006; Calafat et al. 2008; Chapin et al. 2008; Flint et al. 2012). As a result, consumption of bisphenol A (BPA), 2,2-bis(4-hydroxyphenyl) propane (CAS No. 80-05-7), a common industrial chemical component in many products, has steadily grown over the last 58 years. Commercial production of BPA began in the United States in 1957 and then in Europe a year later. Growth of global production has consistently ranged between 0% and 5% annually, with the latest strongest growth occurring in China (Burridge 2008). In fact, between 2000 and 2006, the BPA market in Asia alone grew at an average of 13% annually (Huang et al. 2012). In 2004, the estimated production of BPA in the United States was approximately 1 million tons (2.3 billion pounds) and just above 1 million tons was also produced in Western Europe in 2005 and 2006 (European Commission Joint Research Center 2008; U.S. National Toxicology Program 2008). Therefore, BPA is classified as a high production volume chemical in the United States.
The purpose of this review was to examine the occurrence of BPA in the natural environment throughout different regions of the world. We included over 500 peer-reviewed studies that reported specific concentrations of BPA measured in aquatic systems, wildlife, and humans. This compilation of data on BPA was intended to support an understanding of region-specific environmental occurrence, exposure, and bioaccumulation.
Sources of BPA
Bisphenol A does not occur naturally but has become ubiquitous in the environment as a result of its high production, consumption, and subsequent environmental introduction (Tsai 2006). Environmental sources of BPA can be classified as preconsumer and postconsumer products. Preconsumer sources include those attributed to the manufacture of BPA and BPA-containing products, where the first source of BPA release is from effluent discharge of manufacturing plants (Staples et al. 1998; Cousins et al. 2008; Klecka et al. 2009). Transport and processing of BPA and BPA-containing products are additional sources for its preconsumer release (Staples et al. 1998; Flint et al. 2012).
Postconsumer sources include those associated with disposal or waste including effluent discharge from municipal wastewater treatment plants (WWTP), leaching from landfills, combustion of domestic waste, and degradation of plastics in the environment (Teuten et al. 2009; Fu and Kawamura 2010; Flint et al. 2012). In 2000, Fürhacker et al. reported that 90% of BPA was removed during wastewater treatment in a plant located in southern Austria; similar findings were reported in the United States (Dorn et al. 1987). However, despite efforts to treat BPA, detection in the environment continues to be reported (Fromme et al. 2002; Leusch et al. 2006; Mussolf et al. 2010; Xu et al. 2014a, b). For example, detection of BPA was reported up to 17.2 mg/L in hazardous waste landfill leachates from Japan (Yamamoto et al. 2001) and 12 μg/L in effluents in the United States (Kolpin et al. 2002). In addition to environmental occurrence, contact with heat and acidic or basic conditions accelerates the hydrolysis of the ester bonds between BPA molecules, which results in human and domesticated animal exposure from heating of cans to sterilize food, the presence of acidic or basic food or beverages in cans and polycarbonate plastic, and repeated heating and washing of these products (Howdeshell et al. 2003; Kang et al. 2003; Vanderberg et al. 2007; von Goetz et al. 2010). Inhalation of indoor dust and dental sealants represents other sources of human exposure (Olea et al. 1996; Calafat et al. 2008; Geens et al. 2009b).
Bisphenol A is synthesized by the condensation of phenol with acetone in the presence of a catalyst, a strongly acidic ion-exchange resin. The molecular structure of BPA consists of a central tetrahedral carbon atom with 2 methyl groups and 2 phenol groups (Table 1). Bisphenol A is a moderately water-soluble compound (120-300 mg/L at room temperature; US Environmental Protection Agency, 2014), and it dissociates in alkaline matrices (pKa 10.29 ± 0.69). The U.S. National Institutes of Health Hazardous Substances Data Bank reports a log Kow of 3.64 ± 0.32 for BPA. Thus, BPA would be historically considered to possess moderate bioaccumulation (Staples et al. 1998; Heinonen et al. 2002), although more recent studies highlight the importance of understanding bioaccumulation and the toxicological relevance of moderately lipophilic substances (Valenti et al. 2012, Nichols et al. 2015). In addition, low volatility results from low vapor pressure, high melting point, and moderate solubility (Staples et al. 1998). Rapid photo-oxidation and breakdown in the atmosphere explains the low half-life of BPA in air (0.2 days). Despite the low half-life and only a moderate potential for bioaccumulation, BPA has been detected in multiple environmental matrices (eg, water, soil, and air), including wildlife and humans as subsequently discussed further below.
Physicochemical Profile of Bisphenol A.

aRange reported in the U.S. Environmental Protection Agency’s EPI Suite program, a physical/chemical property and environmental fate estimation program (U.S. Environmental Protection Agency for Estimation Programs Interface (EPI) Suite v4.11, November, 2012).
bRange reported in the US National Institutes of Health’s Hazardous Substances Data Bank TOXNET, representing values for aquatic organisms in peer-review articles.
Bisphenol A in Effluent and Surface Water
Detection of BPA in water began in the late 1990s, with publications of environmental occurrence steadily increasing since these earlier observations (Figure 1). Publication topics span from chemical and biological detection and quantification method development studies to best management practice studies on the transformation of BPA prior to environmental release (e.g., ozonation and bacterial degradation). Although BPA is a highly studied compound, we examined the literature to gain an understanding of its relative distribution in various parts of the world (Figure 2). For example, water occurrence studies largely have occurred in Europe, Asia, and North America with 86, 69, and 27 articles, respectively (Figure 2; Supplemental Table S1). Notably, no published studies were identified from Russia, India, South America (with Brazil as an exception), Central America, or Africa (with Tunisia as an exception). Thus, although we report and analyzed global patterns of freshwater BPA contamination, it is largely comprised of data from 3 continents and lacks data from the majority of developing countries around the globe (Figure 2).

Historic overview of the number of publications per year among geographic locations reporting detection of bisphenol A (BPA) in (A) surface water and effluent; (B) sediment, soil, biosolids, and air; and (C) wildlife collected in the field including mammals, birds, fish, reptiles, amphibians, invertebrates, and plankton through December 2014.

Number of publications by continent or global region reporting detection of bisphenol A (BPA) in (A) surface water and effluent; (B) sediment, soil, biosolids, and air; and (C) wildlife collected in the field including mammals, birds, fish, reptiles, amphibians, invertebrates, and plankton through December 2014. Color intensities from white to black indicate increasing number of studies; the number in the center of each region indicates the total number of publications.
Bisphenol A concentrations in WWTP effluent ranged from nondetect to 370 μg/L, but in most cases, effluent levels were less than 5 μg/L (Supplemental Table S1). Limit of detection among studies also displayed a wide range from 0.006 ng/L to 10 μg/L, which inherently resulted from inconsistencies among the specific analytical methods employed in each study. Technological advances often result in analytical improvements for instrumental precision, accuracy, and sensitivity through time. However, water detection limits appear to be comparatively similar for BPA over the last 2 decades. Moreover, gas chromatography coupled with mass spectrometry (MS) continues to be the most common method employed followed by liquid chromatography coupled with MS.
In surface water, BPA ranged from nondetect to 56 μg/L (Supplemental Table S1). While surface water samples in most studies represented river sites upstream of a WWTP, BPA was also measured in coastal and marine systems (Sánchez-Avila et al. 2011; Sánchez-Avila et al. 2012; Martinez et al. 2013; Rocha et al. 2013). In the Baltic Sea, surface water samples had the highest concentrations (193 ng/L) of BPA compared to slightly lower observations (39 ng/L) in subsurface and bottom waters (Staniszewska et al. 2014). Slightly lower levels of BPA were reported in 291 potable tap water samples (Colin et al. 2014) with mean and maximum levels of 14 ng/L and 1.3 μg/L, respectively.
After reviewing the peer-reviewed literature, we compared measured environmental concentrations of BPA in effluent and surface water among Asia, Europe, and North America studies (Figure 3). Because reports of minimum, median, and mean values were not consistently described and raw data were not obtained, we conservatively focused on maximum reported concentrations (Supplemental Table S1). We then employed probabilistic hazard assessment approaches to compare observations from different regions. Seventy-eight maximum values of BPA in effluents from Europe (41), Asia (21), and North America (16) were ranked using the Weibull formula using approaches previously reported by our research team (Dobbins et al. 2008,2009; Berninger and Brooks 2010; Berninger et al. 2011; James et al. 2011; Connors et al. 2014; Dreier et al. 2015). These distributions were fairly similar; for example, 5th centiles of 1.29, 2.80, and 3.41 ng/L were observed for Asia, Europe, and North America, respectively. For surface water, a total of 105 data points were utilized to represent Asia (45), Europe (49), and North America (11; Table 2). These observations were generally higher than those detected in effluent; for example, 5th centile values identified that the likelihood of encountering higher surface water concentrations of BPA exists in Asia compared to Europe and North America (Figure 3; Table 2).

Measured Environmental Concentration distributions of maximum reported bisphenol A (BPA) concentrations in effluent (A) and surface water (B) in Asia, Europe, and North America. Vertical lines correspond to Predicted No Effect Concentrations (PNECs) in Canada (750 ng/L), the European Union (1500 ng/L), and Japan (1600 ng/L).
Equations for Regression Lines and Values Corresponding to Various Centiles for Measured Environmental Concentration Distributions of the Maximum Reported BPA Concentrations (ng/L) in Surface Water and Effluent in Asia, Europe, and North America.a

Abbreviation: BPA, bisphenol A.
aPercentage exceedence values are based on Predicted No Effect Concentrations from Canada (750 ng/L), the European Union (1500 ng/L), and Japan (1600 ng/L).
We then further employed probabilistic hazard assessment to examine the likelihood of encountering exceedences of proposed Predicted No Effect Concentrations (PNECs), which ranged from 750 ng/L in Canada, to 1500 ng/L in the European Union (EU) and 1600 ng/L in Japan. As noted earlier, distributions among regions were quite similar; thus, it was not surprising to observe similar patterns of PNEC exceedences. For example, the highest exceedance of the Canadian PNEC in effluent was observed in Europe, followed by North America, and Asia with exceedence values of 63.4%, 56.3%, and 52.4%, respectively (Figure 3A). However, such patterns were reversed for BPA exceedances in surface water among geographic regions where reports from Asian surface waters exceeded the Canadian PNEC 80% of the time (Figure 3B), whereas the likelihood of Europe and North America exceedences was observed 53.1% and 34.6% of the time, respectively. Thus, it is also important to note that Europe and North America had higher percentage of exceedances in effluent than in surface water. Future research efforts to understand environmental exposure of BPA and other industrial chemicals in surface waters are necessary in effluent-dominated and dependent systems, which often represent worse-case scenarios in urbanizing inland and coastal waters (Brooks et al. 2006).
Biosolids, Sediments, Soil, and Air
Concentrations of BPA in Sewage Sludge and Biosolids
A total of 20 studies of BPA in sewage sludge and biosolids were found in the literature, most of which were from Europe (8) and North America (8), with the remainder originating from Asia (3) and Australia (1). Bisphenol A is a ubiquitous environmental contaminant in these sludge and biosolid reports, with concentrations ranging from 10 to >100 000 μg/kg dry weight (DW; Supplemental Table S2). Concentrations depended largely on the amount and type of influent source loading and effluent treatment processes involved (such as primary and secondary treatment). For most municipal WWTPs, concentrations of BPA ranged from 10 to 10 000 μg/kg DW. However, higher levels (>100 000 μg/kg) were found in the sludge of WWTPs receiving elevated industrial effluent (Meesters and Schroder 2002). Geographic differences of BPA in sludge were recently examined by Staples et al. (2010) who developed probabilistic exposure distributions of BPA in sewage sludge and proposed median (50th percentile) and 95th percentile values of 780 and 14 200 μg/kg for North America and 160 and 95 000 μg/kg for Europe.
Concentrations of BPA in Soil
Only 6 studies on the occurrence of BPA in soil were found in the literature, of which 2 each were from Asia and North America and 1 was from Europe (Supplemental Table S2). Primary sources of BPA to terrestrial soils include the application of sewage sludge (Kinney et al. 2008; Langdon et al. 2012), irrigation with wastewater effluent (Chen et al. 2011), discharge of landfill leachate (Fent et al. 2003), and disposal and recycling of electronic waste (Huang et al. 2014). Concentrations in soil varied across several orders of magnitude (ie, <0.01-1000 μg/kg) depending on the amount and type of effluent or waste received (Supporting Table S2). Soils specifically treated with sewage sludge generally contained BPA concentrations ranging from 1 to 150 μg/kg (Kinney et al. 2008; Langdon et al. 2012). Although the presence of BPA in agricultural fields irrigated with wastewater effluent is limited, Chen et al. (2011) reported BPA concentrations of less than 10 μg/kg. However, BPA levels greater than 100 μg/kg have been observed at electronic waste recycling and disposal sites in China (Huang et al. 2014).
Once BPA has reached the soil, it is relatively immobile due to its high soil–water partitioning coefficient of 314 to 1524 (Fent et al. 2003) and can form nonextractable residues within 3 days. Sorption to soils and sediments is highly dependent on organic matter concentrations and particle grain size (Sun et al. 2012). Ionization of BPA could occur in extreme soils if pH values approach its pKa (Zeng et al. 2006), which could result in enhanced leaching or percolation to groundwater. The fate, transport, and bioavailability of the bisphenolate anion or nonextractable residues of BPA soil compartment have not been thoroughly investigated (Fent et al. 2003; Huang et al. 2014a).
Concentrations of BPA in Sediments
Fifty studies on the presence of BPA in sediments were identified and spanned multiple continents including Asia (29), Europe (17), and North America (4) (Supplemental Table S2). No studies were found for Australia, Antarctica, Central America, South America, or Africa. Like in soils, reported concentrations of BPA in sediments span several orders of magnitude and depend on loading from upstream sources, such as municipal and industrial WWTP effluent. Concentrations between 100 and 1000 μg/kg DW were commonly reported downstream of heavily populated urban areas, WWTPs, and industrial discharges (Yang et al. 2005; Gong et al. 2011).
Not surprisingly, most studies focused sampling efforts on heavily urbanized watersheds and conveyances downstream from WWTPs. The highest concentrations reported in the literature were from Taiwan (10,500 μg/kg, Lin 2001), China (3,400-3,600 μg/kg, Yang et al. 2005; Zhang et al. 2011), and Germany (1,630 μg/kg, Stachel et al. 2005). Maximum detected BPA concentrations from Asia were comparable to those of studies in Europe (Figure 4). Specifically, 95th and 99th percentile (Table 3) sediment concentrations for Asia (3458 and 20 136 μg/kg DW) were higher than those of Europe (3384 and 13 392 μg/kg DW). It is important to note the limited number of studies conducted in North America (4) or Europe (17) compared to Asia (29) (Supplemental Table S2).

Measured environmental concentration distributions of maximum detected bisphenol A (BPA) concentrations in sediments from Asia and Europe.
Equations for Regression Lines and Values Corresponding to Various Centiles for the Maximum Reported BPA Concentrations (μg/kg dry weight) in Sediments From Asia and Europe.

Abbreviation: BPA, bisphenol A.
Beyond total organic carbon content, the ability to predict partitioning of BPA to sediments is dependent on pH (Zeng et al. 2006), black carbon (Zeng et al. 2006), ionic strength (Zeng et al. 2006; Xu et al. 2008), and temperature (Xu et al. 2008). Bisphenol A has a pKa of 10.29 ± 0.69 (Table 1), which results in enhanced sorption at lower pH values and higher solubility or desorption at pH values closer to the pKa. At lower pH values (eg, pH
Concentrations of BPA in Air
Only 6 studies were identified which reported BPA levels in air (3 in Asia, 2 in North America, and 1 in Europe; Table 2). These studies investigated the presence of BPA in outdoor air (Berkner et al. 2004; Fu and Kawamura 2010), in indoor air of homes (Rudel et al. 2001; Wilson et al. 2007) and workplace offices (Rudel et al. 2001), and occupational exposure in plastics factories (He et al. 2009). Maximum indoor air concentrations were reported in BPA at resin factories in China (>50,000 ng/m3), whereas lower (<100 ng/m3) concentrations are found in residential and commercial buildings (Rudel et al. 2001; Wilson et al. 2007).
Sources of BPA to outdoor air include the burning of domestic and electronic waste (Owens et al. 2007; Fu and Kawamura 2010) and paint spraying (Peltonen and Pukkila 1988). Due to the low volatility of BPA, low air emissions, and rapid photo-oxidation half-life (<7 hours), BPA is expected to have a negligible presence in the atmosphere (Cousins et al. 2002). Fu and Kawamura (2010) investigated atmospheric aerosol concentrations of BPA in a wide range of geographic and demographic locations. For example, in urban areas of India, China, Japan, New Zealand, and the United States, BPA levels ranged from 0.004 to 17 ng/m3, while BPA ranged from 0.005 to 0.2 ng/m3 in rural areas of China and Germany. In marine areas of the Pacific, Atlantic, and Indian Oceans, BPA was detected between 0.001 and 0.03 ng/m3, with the highest concentrations in urban coastal regions. Furthermore, in aerosol samples collected from polar regions, BPA concentrations ranged between 0.001 and 0.017 ng/m3. Because BPA does not occur naturally and it is in high demand by society, it is expected to be reported in highest concentrations in urban areas, but BPA is also present in remote areas of the globe. How much and at what rate atmospheric BPA is differentially deposited to the world oceans remains to be determined.
Bioaccumulation of BPA in Wildlife
Since 1999, a total of 63 studies have been published on BPA concentrations in wildlife (Supporting Table S3). Sixty-two percent of these articles reported BPA in wildlife from the field, while the remaining reports are derived from controlled laboratory studies. About half of the field studies occurred in Europe and Asia (Figure 1C). Only 2 studies reported tissue data collected in North America (Supplemental Table S3), and no data have been reported on BPA levels in wildlife from other regions of the world. Such observations appear to be increasing recently; for example, from 1999 to 2012, between 0 and 3 publications were released each year, but an average of 6 articles were published in each of 2013 and 2014 (Supplemental Table S3).
Bisphenol A has been detected in tissues of several different aquatic species collected from marine and freshwater systems. In fish, the group of organisms for which most of the data on wildlife tissue levels exists, BPA has been detected at concentrations ranging from 0.2 to 13 000 ng/g (Supplemental Table S3). Bisphenol A has also been measured in amphibians, mollusks, gastropods, crustaceans, aquatic insects, polychaetes, algae, and diatoms (Supplemental Table S3) at concentrations similar to those reported in fish in the ppt to low ppb range. The only terrestrial organisms for which field BPA accumulation data are available is for the earthworm (Eisenia fetida). In this species, Markman et al. (2007) measured BPA tissue levels in adult earthworms collected from sewage percolating beds.
Based on laboratory-derived data, BPA shows little ability to accumulate significantly from water in tissues of biota. Bisphenol A bioconcentration factors (BCFs) for fish range from 1.7 to 182 (Supplemental Table S3), values that are well below the lower thresholds used by regulatory agencies to identify a substance as bioaccumulative. Similar to those of fish, BCFs for marine and freshwater bivalves are fairly low, with values ranging from 4.5 to 144. In amphibians and phytoplanktons, BCFs have been reported up to 458 and 382, respectively (Supplemental Table S3). The BCFs for these organisms are higher than fish but still below typical regulatory thresholds.
The low BCFs reported previously correlate well with results gathered from toxicokinetic experiments using BPA in fish. Lindholst et al (2001) demonstrated that after an intraperitoneal injection of 154 µmol BPA/kg of fish, BPA was readily absorbed from the body cavity into the liver, plasma, and muscle of rainbow trout. In this study, each of the compartments reached maximum (100%) BPA concentrations 2 hours after injection. Twenty-four hours following injection, only 1.5%, 2.0%, and 1.7% BPA remained in the liver, plasma, and muscle, respectively. Similar to observations from injected fish, inhalational exposure of BPA through water had a relatively short (<6 hours) half-life in fish plasma and tissues (Lindholst et al. 2001; Lindholst et al. 2003). The fast elimination of BPA in fish is likely due to its metabolism. In an aqueous exposure, rainbow trout and zebrafish rapidly converted BPA to BPA glucoronic acid and, to a much lesser extent, BPA sulfate; BPA glucoronide was reported to be primarily excreted in bile through the intestine (Yokota et al. 2002; Lindholst et al. 2003). Introduction of a glucoronyl group reduces the Kow of a chemical by 2 orders of magnitude (Giroud et al. 1998). As with injected and aqueous exposed fish, rainbow trout dosed orally also demonstrate quick elimination of BPA (Bjerregaard et al. 2003).
Although laboratory BCFs are fairly low, field bioaccumulation factors (BAFs) for BPA are typically much higher. Yang et al. (2014), for example, reported BAFs for common carp (Cyprinus carpio) ranging from 3583 to 14178. These values are over an order of magnitude higher than the highest reported laboratory BCF for fish. The large difference between fish BCFs and the accumulation factors calculated by Yang et al. (2014) could be attributed to several different factors. First, the authors measured BPA in carp, a benthic species that was never used in any of the laboratory-derived BCF experiments with pelagic fish. Thus, differences between Yang et al. (2014) findings and previous investigations could be due to sediment exposure in the field. These differences could also have resulted from species-specific differences in metabolism. For example, Lindholst et al. (2003) demonstrated that zebrafish metabolized BPA faster than rainbow trout, which could be attributed to the lower estrogenic sensitivity of zebrafish to BPA. Second, Yang et al. (2014) measured BPA in bile, but previous laboratory-derived BCF studies determined accumulation levels in plasma and tissues. In fish, bilary excretion is the main route of BPA elimination, and more BPA accumulates in bile than in plasma, muscle, and liver (Lindholst et al. 2003). Finally, if BPA primarily accumulates through another route, such as dietary exposure from benthic organisms inhabiting contaminate sediments, laboratory-derived BCFs would be much lower than BAFs because in these controlled laboratory studies fish were only exposed via water.
Bioconcentration factors can be estimated using a regression equation that assumes bioconcentration is a thermodynamically driven partition process between the water and the lipid phase of an exposed organism (Meylan et al. 1999). The equation, originally developed by Veith et al. (1979), is based exclusively on the compound’s log Kow. Given that BPA has a Log D of 3.64 at a pH of 7.4, the estimated BCF is 344 (Scifinder 2015). In addition, we observed the BCF estimate of 71.85 (log P = 3.32) derived by the U.S. Environmental Protection Agency’s Estimation Programs Interface (EPI) Suite software (http://www.epa.gov/opptintr/exposure/pubs/episuitedl.htm) to be much closer to laboratory-derived BCFs. Although this prediction is higher than laboratory-derived values for fish, invertebrates, and bivalves, it still falls below common regulatory thresholds (EPA = 1000; EU = 2000), as demonstrated with the experimental BCFs. The higher value derived from the equation could be attributed to the equation’s lack of metabolism component. As stated earlier, BPA has been demonstrated to undergo glucoronate and sulfate conjugation in fish. Unfortunately, comparative metabolism and detoxification differences among fish and other species are not understood but are necessary to advance an understanding of bioaccumulation and risks to wildlife from BPA and other contaminants.
Whether BPA displays trophic transfer is yet to be determined. Ishihara and Nakajima (2003) suggested that BPA can accumulate in zooplankton via phytoplankton. This conclusion was grounded on the observation that in water and marine phytoplankton (Nannochloropsis sp) spiked with 24 µmol/L BPA, recovery of the compound was 11% and 46%, respectively; while the recovery from medium and zooplankton (Artemia sp. or Brachionus sp) was >80% and <7%, respectively, in a separate study (Ishihara and Nakajima 2003). However, >40% of the spiked BPA was recovered in the zooplankton when phytoplankton and zooplankton were exposed concurrently.
To better characterize the accumulation potential of BPA in aquatic species and food chains, more experimental data are needed. In particular, in vitro metabolism experiments, such as fish S9 assays, would help clarify the rate at which BPA undergoes metabolism and the degree to which metabolic processes affect bioconcentration and bioaccumulation of BPA in aquatic biota. This in vitro data would aid in the development of methods to model and estimate accumulation of industrial compounds such as BPA, which undergo metabolism in aquatic species. Similarly, field and mesocosm studies aimed at calculating trophic magnification or dilution factors for BPA, particularly in effluent-dependent surface waters (Du et al. 2014), are necessary to further understand bioaccumulation in wildlife.
Bisphenol A in Humans
Numerous studies have documented the presence of BPA in canned foods (see Aerts et al. 2012; Geens et al. 2012a). Heat associated with sterilization of the container and acidity of the contents appear to be important determinants of the rate of migration (Goodson et al. 2004; Robin et al. 2004). In humans, the scientific consensus is that the primary route of exposure is consumption of canned food. For example, Carwile et al. (2011) and others observed a 1200% increase in urine BPA concentrations following consumption of 1 serving of canned soup versus fresh food over a 5-day period (Ye et al. 2011). Diet modification that removes canned or packaged foods was also shown to sharply reduce urinary BPA concentrations (Gray et al. 2011; Rudel et al. 2011).
Moreover, BPA migrates out of polycarbonate in reusable containers for food and water; for example, the product that has by far received the most attention is baby bottles (Hauser et al. 2007; Vandenberg et al. 2013; EFSA 2015). The EU banned the use of polycarbonate in baby bottles in 2011, and the US Food and Drug Administration followed in 2012. A definitive review of the presence of BPA in simulated food in polycarbonate baby bottles in the EU was recently published by Hoekstra and Simoneau (2013). The authors concluded that contact time, temperature, and pH are the main determinants of migration of BPA into the food. For children, the estimated exposure range from 0.01 to 13 μg/kg/d, with the highest for children who were bottle fed; for adults, the highest estimated exposure was 4.2 μg/kg/d (Aerts et al. 2012; Geens et al. 2012a).
Thermal paper, as used in credit card receipt printers and other types of retail applications, represents an additional source of BPA (20 mg/g paper) as a reactant in the process of heat printing (Hormann et al. 2014; Vom Saal et al. 2014; vom Saal and Welshons 2014). Tens to hundreds of micrograms of BPA can be transferred from heat-printed receipts in relatively transient contact. Although the rate of skin penetration for BPA is unclear, a study of a limited number of volunteers indicates that these exposures are associated with significant increases in unconjugated BPA in serum (Hormann et al. 2014; Vom Saal et al. 2014). Furthermore, elevated levels of BPA in urine have been observed in cashiers (Braun et al. 2011; Kalkbrenner et al. 2011; Calafat et al. 2014; Ehrlich et al. 2014). It has been estimated that dermal exposures of this type amount to between 0.1 and 0.58 μg/kg/d, although it could account for as much as 51% of total exposure in occupationally exposed persons (Geens et al. 2011; Liao and Kannan 2011; Aerts et al. 2012; Heinala et al. 2014; Porras et al. 2014). This application is likely also responsible for widespread environmental contamination with BPA as well as contamination of paper currency (Shiraishi et al. 2007; Terasaki et al. 2007; Liao and Kannan 2011; Aerts et al. 2012; Geens et al., 2011, 2012a; Schwartz and Landrigan 2012).
Dental fillings comprising composite epoxy resins frequently contain BPA (Rubin 2011; Aerts et al. 2012; Geens et al. 2012a). A meta-analysis by Van Landuyt et al. (2011) concluded that 0.013 to 30 mg of BPA may be released within 24 hours of implantation (Nawrot et al. 2011; Van Landuyt et al. 2011). The worst-case scenario of 30 mg represents a significant exposure (10-fold higher than the EPA RfD) although it is of short duration (Aerts et al. 2012; Geens et al. 2012a). Other minor sources of exposure include medical devices, mouthing of toys by children, cigarette filters, household detergents, and personal care products (Aerts et al. 2012; Geens et al. 2012a; Hunt et al. 2013; Vandenberg et al. 2013).
The current U.S. EPA (Environmental Protection Agency) reference dose for BPA is 50 μg/kg/d, based on a Lowest Observed Adverse Effect Level (LOAEL) (reduced body weight in a National Toxicology Program chronic rat oral study published in 1982) and a safety factor of 1000 (http://www.epa.gov/iris/subst/0356.htm). The European Food Safety Authority (EFSA) has recently lowered their safe exposure level from 50 to 4 μg/kg/d based on observations from a 2-generation toxicity study in mice and notes that another reevaluation may take place following completion of an NTP (National Toxicology Program) study in 3 years (http://www.efsa.europa.eu/en/press/news/150121.htm; EFSA 2015, http://www.efsa.europa.eu/en/efsajournal/pub/3978.htm). The EFSA’s evaluation estimated the highest aggregate exposure at 1.449 μg/kg/d for adolescents, and thus concluded that “there is no health concern for any age group from dietary exposure or from aggregated exposure” to BPA. However, Geens et al. (2012a) estimated exposure from food sources alone to range from 0.1 to 5 μg/kg body weight/d and up to 13 μg/kg/d for children. This discrepancy is possibly due to differences in default and refined exposure parameters (eg, diet) between the EU and other geographic regions.
When assessing BPA bioaccumulation, the scientific and regulatory communities have frequently relied on a study conducted by Volkel et al. (2002) and Colnot et al. (2002), which concluded that BPA was rapidly eliminated (t1/2 5.3 hours), primarily through glucuronidation. However, concerns have been raised about these conclusions, including the limits of detection (Vandenberg et al. 2007, 2010; Chahoud et al. 2010; Rubin 2011). Although ingestion of canned food is thought to be the primary route of exposure for most persons, a study of BPA levels in fasting adults did not demonstrate the rapid clearance that was expected (Colnot et al. 2002; Volkel et al. 2002; Stahlhut et al. 2009; Welshons et al. 2009).
There is significant disagreement about the half-life of BPA in humans. The scientific and regulatory community has frequently relied on a study conducted by Voelkel et al. (2002) who used humans and nonhuman primates to demonstrate that orally administered BPA is quickly absorbed by the gastrointestinal tract. Other studies have shown that BPA undergoes extensive first pass metabolism in the gut wall (Inoue et al., 2003) and in the liver (Pritchett et al., 2002), whereby the compound is primarily conjugated to BPA-glucorononide and, to a lesser extent, BPA-sulfate (Ye et al. 2005; Hanioka et al. 2008). After conjugation, BPA is rapidly removed from the blood by the kidneys and excreted in urine (Völkel et al. 2002; Teeguarden et al. 2011). More than 90% of BPA is excreted in urine within the first 6 hours following uptake, with the majority of the compound being released as BPA-G (Völkel et al. 2002).
Only a few studies have measured BPA in tissues. In adults, BPA has been detected in the brain at concentrations up to 2.36 ng/g (Geens et al. 2012b), in the liver from 0.9 to 2.77 ng/g (Geens et al. 2012b), and in adipose tissue from 1.12 to 12.28 ng/g (Fernandez et al. 2007b; Geens et al. 2012b). These levels are close to what has been measured in plasma, suggesting that BPA may not partition significantly from blood to the lipophilic compartment. Data from human pharmacokinetic studies indicate that BPA does not accumulate in tissues but instead is rapidly eliminated in urine (Völkel et al. 2002; Volkel et al. 2008; Teeguarden et al. 2011). However, evidence from Stahlhut et al. (2009) suggests that BPA accumulates in body compartments with long elimination times and/or that it enters humans through nonfood exposure routes in addition to dietary routes. This conclusion was based on statistics gathered from the Center for Disease Control and Prevention’s (CDC) 2003 to 2004 National Health and Nutrition survey (NHANES), whereby the authors modeled BPA urine concentrations as a function of fasting time. The researchers found that BPA levels did not decline rapidly with fasting time. Human biomonitoring studies using lipophilic tissue are quite limited due to the invasive procedures necessary to isolate the matrix. Thus, the degree to which BPA is accumulated and eliminated from these compartments is still fairly uncertain.
Because fetuses, young children, and infants often have a reduced capacity to metabolize xenobiotics, the risk of BPA exposure and accumulation is greater in these populations (Nahar et al. 2013). Bisphenol A has been measured in fetal cord blood (Ikezuki et al. 2002; Schonfelder et al. 2002; Tan and Mohd 2003; Lee et al. 2008; Unal et al. 2012; Aris 2014), fetal liver (Zhang et al. 2011; Cao et al. 2012; Nahar et al. 2013), and amniotic fluids (Ikezuki et al. 2002; Yamada et al. 2002; Engel et al. 2006; Chen et al. 2011; Edlow et al. 2012) at concentrations ranging from 0.14 to 9.2, 1.3 to 50.5, and 0.36 to 5.62 ng/g, respectively, indicating that the fetus is likely exposed to BPA via maternal uptake (Vandenberg et al. 2012). Using a human ex vivo model, Balakrishnan et al. (2010) revealed that environmentally relevant concentrations of BPA can transfer across the human placenta. Furthermore, BPA has been measured in placental tissue at concentrations up to 273.9 ng/g (Troisi et al. 2014) and in maternal blood up to 66.48 ng/ml (Lee et al. 2008). However, BPA may be released from medical devices, and thus exposure in some or all of the above-mentioned studies may have occurred by routes other than maternal uptake (Hengstler et al. 2011).
Due to the limited amount of data available, the degree to which BPA accumulates in the more lipophilic compartments of humans is unclear. Additionally, few studies have been conducted to determine BPA body burdens in fetuses and the degree to which uptake from the maternal to fetal compartment occurs. For these reasons, future research should aim to include experimental pharmacokinetic studies of chronic BPA exposure and further investigate the presence of BPA in human adipose and fetal tissues.
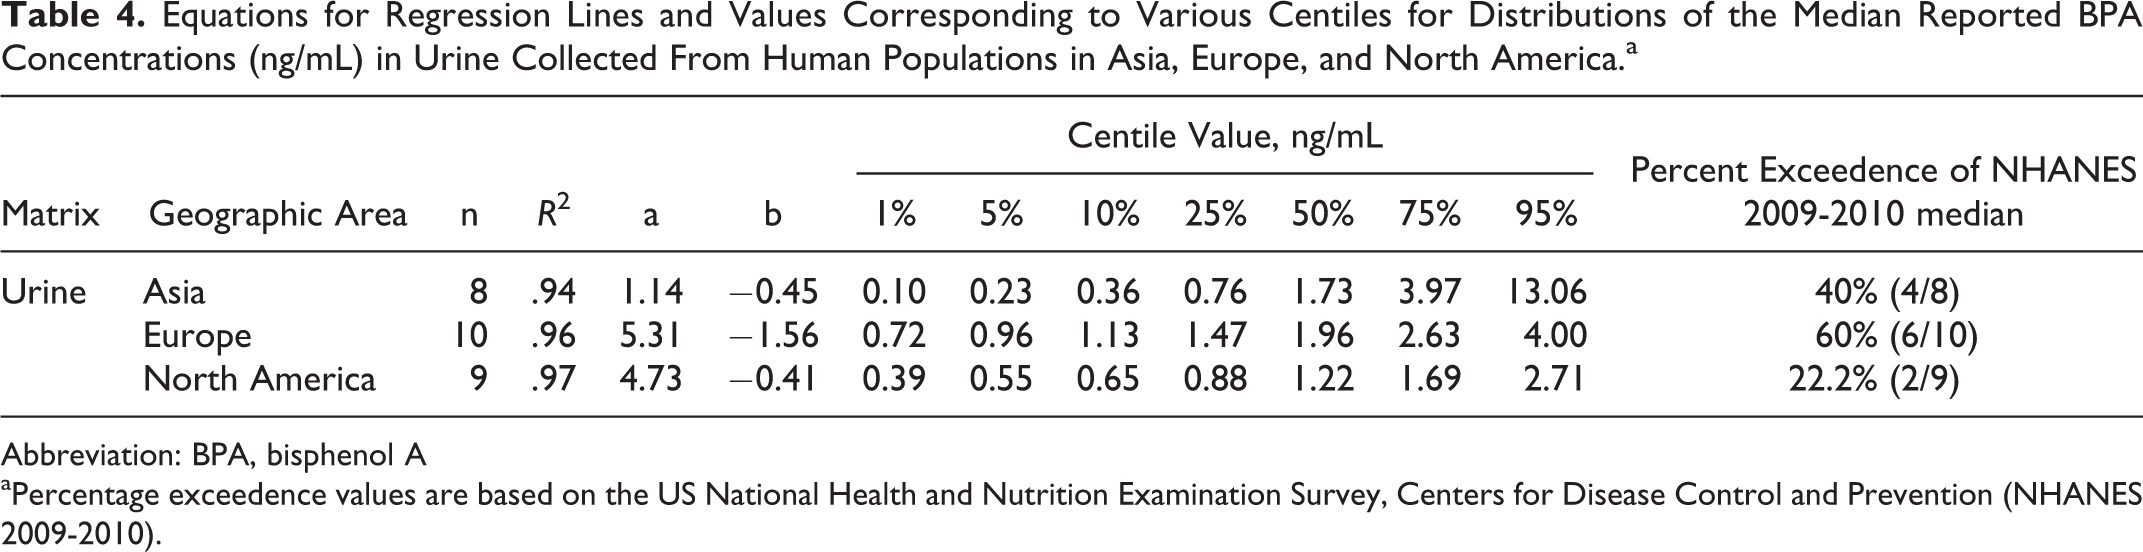
Because BPA is relatively nonpersistent (biological half-life <6 hours) and a sufficient amount of it undergoes rapid excretion in urine as a major metabolite or unchanged, urinary measurements of BPA are most preferred in estimating human uptake or exposure (Geens et al. 2012a). Hence, the majority of human biomonitoring studies on BPA report urinary concentrations. The concentrations reported from these studies are typically <10 ng/mL, values similar to what has been reported in plasma (Supplemental Table S4). The median BPA concentration for urine samples collected from 2749 Americans ≥6 years of age during the 2009 to 2010 CDC NHANES was 1.90 ng/mL. This median is fairly close to those gathered from other biomonitoring studies in Asia, Europe, and North America (Table 4). We examined the likelihood of exceeding this NHANES median value based on available literature values from Asia, Europe, and North America (Figure 5). Although urine levels from Europe exceeded the 2009 to 2010 CDC NHANES median 60% of the time, lower exceedence frequencies were reported from Asia (40%) and North America (20%; Supplemental Table S4).
Equations for Regression Lines and Values Corresponding to Various Centiles for Distributions of the Median Reported BPA Concentrations (ng/mL) in Urine Collected From Human Populations in Asia, Europe, and North America.a
Abbreviation: BPA, bisphenol A
aPercentage exceedence values are based on the US National Health and Nutrition Examination Survey, Centers for Disease Control and Prevention (NHANES 2009-2010).

Measured human concentration distributions of median bisphenol A (BPA) concentrations in urine sampled from populations in Asia, Europe, and North America. Vertical line corresponds to the median BPA urinary level reported by the US National Health and Nutrition Examination Survey, Centers for Disease Control and Prevention (NHANES 2009-2010).
Conclusion
Herein, we examined over 500 articles from the peer-reviewed literature to understand global distribution of BPA levels in effluent discharges, surface waters, sewage sludge, biosolids, sediments, soils, air, wildlife, and humans. Unfortunately, such information is decidedly lacking from many large geographic regions, megacities, and developing countries. When data were available from environmental matrices, probabilistic hazard assessments were performed to understand potential global “hot spot” environmental quality concerns. Based on the approach taken here and data availability, PNEC values proposed by Canada were exceeded the majority of the time in effluent discharges and surface waters of Asia, Europe and North America. For example, the likelihood of exceeding this PNEC value was observed 80% of the time in surface water reports from Asia. These findings highlight the utility of coordinating global sensing efforts using integration of environmental monitoring and specimen banks for environmental contaminants to identify regions for implementation of more robust environmental assessment and management programs.
Footnotes
Declaration of Conflicting Interests
The author(s) declared no potential conflicts of interest with respect to the research, authorship, and/or publication of this article.
Funding
The author(s) disclosed receipt of the following financial support for the research, authorship, and/or publication of this article: This manuscript was supported by a grant National Science Foundation (CHE-1339637) and Environmental Protection Agency to BWB through the Molecular Design Research Network (![]() ). Additional support was provided by the Department of Environmental Science at Baylor University.
). Additional support was provided by the Department of Environmental Science at Baylor University.
References
Supplementary Material
Please find the following supplemental material available below.
For Open Access articles published under a Creative Commons License, all supplemental material carries the same license as the article it is associated with.
For non-Open Access articles published, all supplemental material carries a non-exclusive license, and permission requests for re-use of supplemental material or any part of supplemental material shall be sent directly to the copyright owner as specified in the copyright notice associated with the article.