
Abstract
The 2 objectives of this subchronic study were to determine the arsenite drinking water exposure dependent increases in female C3H mouse liver and lung tissue arsenicals and to characterize the dose response (to 0, 0.05, 0.25, 1, 10, and 85 ppm arsenite in drinking water for 30 days and a purified AIN-93M diet) for genomic mouse lung expression patterns. Mouse lungs were analyzed for inorganic arsenic, monomethylated, and dimethylated arsenicals by hydride generation atomic absorption spectroscopy. The total lung mean arsenical levels were 1.4, 22.5, 30.1, 50.9, 105.3, and 316.4 ng/g lung tissue after 0, 0.05, 0.25, 1, 10, and 85 ppm, respectively. At 85 ppm, the total mean lung arsenical levels increased 14-fold and 131-fold when compared to either the lowest noncontrol dose (0.05 ppm) or the control dose, respectively. We found that arsenic exposure elicited minimal numbers of differentially expressed genes (DEGs; 77, 38, 90, 87, and 87 DEGs
Introduction
Inorganic arsenic causes cancer in skin, bladder, lung, liver, and kidneys. Arsenic causes lung cancer via inhalation and ingestion of drinking water. 1 In 2001, the United States Environmental Protection Agency (EPA) set the arsenic drinking water standard of 0.01 ppm 2 based on extrapolation of the human cancer data from the high arsenic exposure areas in Taiwan. 3 In 2002, the International Agency for Research on Cancer (IARC) classified arsenic in drinking water as a cause of lung, bladder, and skin cancers. 3
Much is known about arsenic-induced carcinogenic effects in urinary bladder and skin. Lung cancer is the leading cause of cancer-related mortality in the United States and worldwide. The IARC has classified arsenic as a group 1 carcinogen for lung cancer. 3 Humans exposed to inorganic arsenic in their drinking water have demonstrated elevated risks of death from lung cancer in Taiwan, 4,5 Chile, 6 and Argentina. 7 Epidemiologic evidence supports the presence of a causal association between exposure to elevated arsenic concentrations in drinking water and the risk of developing or dying from lung cancer. Beginning in the 1990s, epidemiological studies in Chile showed that the rate of lung and bladder cancer in arsenic-polluted areas was considerably higher than mean cancer rates of nearby areas. 6,8 Less is known about the risk of lung cancer at lower exposure levels than achieved in Taiwan, Chile, or Argentina. Arsenic also causes noncancer pulmonary health effects such as chronic obstructive pulmonary disease and bronchiectasis. 6,9 For these reasons, we conducted our studies primarily in the lung, a lesser studied organ that still is a large contributor to arsenic cancer-induced death in humans.
Inorganic arsenic ingested through drinking water is quickly absorbed into the bloodstream and is transported to the liver where it is metabolized through methylation processes to generate monomethylarsonic acid (MMA) and dimethylarsinic acid (DMA) metabolites. 10 Most of the arsenic metabolites are excreted in the urine; however, some are deposited in lung, liver, kidney, nails, and hair. 11 In earlier toxicological thinking, arsenic was sometimes considered to be a promoter and not an initiator of carcinogenesis, as no mutagenic potential was shown in early experimental models. 12 However, there has been growing evidence that MMA and DMA are cytotoxic and genotoxic in cell lines. 13 –17
Arsenic-induced carcinogenesis may occur through several biological mechanisms, particularly via the highly biologically active MMA and DMA metabolites. 18 These mechanisms include chromosomal abnormalities, oxidative stress, altered DNA repair, altered DNA methylation patterns, altered growth factors, enhanced cell proliferation, promotion/progression, gene amplification, and suppression of p53. 18 –21 Thus, several mechanisms for carcinogenesis with ingested arsenic exposure have been suggested, but the percentage of causality of each pathway and the particulars on how and when these pathways operate to cause lung cancer are not well understood.
Humans are the best model to study arsenic carcinogenesis. However, since it is not possible to study the mechanisms of carcinogenesis in humans (particularly with interior organs such as the lungs), animal models of carcinogenesis are frequently used. Unfortunately, with respect to exterior dose and organ susceptibility, rats and mice are not as sensitive as humans to arsenic-induced toxicity and carcinogenicity. In a recent study, whole-genome DNA methylation and gene expression changes were evaluated in lungs from female C57BL/6 mice exposed for 90 days to 50 ppm arsenate (As) in drinking water. 22 This study reported a subset of 17 genes showing differential methylation that included a substantial number that has been demonstrated to play a functional role in cancer-related processes. 22 Of the available arsenic rodent models (Table 1), we chose a sensitive mouse model to study the mechanisms, that is, female C3H mouse, primarily because of positive carcinogenicity data in a gestational arsenic exposure from the Waalkes group. 24,33 The C3H mouse strain is known to have a high spontaneous incidence of tumors. 34
Some Arsenic-Induced Tumor-Related Health Effects in Mice.

Abbreviations: As, inorganic arsenic; MMA, monomethylarsonic acid; DMA, dimethylarsinic acid; UVB, ultraviolet beta.
Arsenic can elicit many diverse effects in humans as well as in animal models. It is now well accepted that more than 1 causal mechanism may be involved in its carcinogenic potential (eg, oxidative stress, sulfhydryl group occupancy, DNA methylation, etc). With greater use of appropriate animal models, particularly with various chronic or subchronic in vivo exposures using arsenic, a better understanding of the adverse effect can be achieved and an easier extrapolation to human exposures be made. A major question that remains to be answered is the level of risk of cancer with human arsenic exposure, particularly in the low-exposure range of 0 to approximately 200 ppb arsenic. In the United States, some past arsenic exposures might have reached 0.05 to 0.2 ppm in certain areas, but in the future, major regulated American water systems should be at 0.01 ppm or lower. 2
The objective of this subchronic study was to characterize both the dose–response relationship for tissue arsenical accumulation in mouse lung and liver (a well-studied organ for arsenical speciation) and the gene expression patterns involved in arsenical-induced lung effects in female C3H mice. Mice were administered sodium arsenite via drinking water at 0 (control), 0.05, 0.25, 1, 10, and 85 ppm as either elemental arsenic (lowest 2 concentrations) or as arsenite (top 3 concentrations; Table 2). A purified diet (AIN-93M) was used to reduce arsenicals present in the diet and thereby lower the mouse tissue arsenic background levels. As a result, the effects of low arsenite concentrations in drinking water could be seen. Mice were exposed to sodium arsenite in their drinking water for 30 days, and the lung samples from each treatment group were analyzed for gene expression and pathway involvement to identify transcription changes that may be linked to arsenic carcinogenesis.
Mouse Liver Concentrations of Arsenicals After 30-Day Exposure to a Wide Range of Drinking Water Arsenite Concentrations.

Abbreviations: As, inorganic arsenic; EPA, United States Environmental Protection Agency; iAs, inorganic arsenic; MMA, monomethylarsonic acid; DMA, dimethylarsinic acid; SEM, standard error of the mean; MCL, maximum contaminant level.
aValues are the mean ± SEM for 5 or 6 samples. The experimental animals were adult female C3H mice. Data are expressed as ng of the arsenical, for example, arsenate, MMA(V), and DMA(V), and not as elemental arsenic. The total As is the sum of arsenate, MMA(V), and DMA(V). To decrease their background tissue arsenical concentrations, mice were fed a purified diet (AIN 93M) for 14 days prior to the study and also during the 30 days of drinking water arsenite exposure.
bThe limit of detection is about 0.2 ng/g tissue for all analytes. Arsenic drinking water concentrations are expressed as ppm sodium arsenite and as ppm elemental arsenic in 2 different columns.
cThe lower concentrations of 0.087 and 0.434 (as arsenite) were used and not 0.05 and 0.25 ppm to make them match elemental arsenic in the lower groups, as the EPA MCL is expressed as elemental arsenic. The higher groups at 1 to 85 are ppm of the whole compound and not as elemental arsenic. Adapted from Chilakapati et al. 35
dStatistically significant versus control at P < .001 via a Kruskal-Wallis 1-way analysis of variance on ranks followed by individual t tests to determine P values.
Materials and Methods
Chemicals
Sodium arsenite (82.9%—arsenite and 17.1%—As) was purchased from Sigma-Aldrich (St Louis, Missouri). This arsenite–As ratio hydride generation data were obtained after the animal exposure was completed. All other chemicals used were the highest grade commercially available.
Animals
Female C3H mice (52- to 55-day old) were obtained from Charles River Laboratories (Raleigh, North Carolina). The animals were housed in an AAALAC-approved animal facility at the EPA, Research Triangle Park, North Carolina, and maintained according to the National Institutes of Health “Guideline on the Care and Use of Laboratory Animals.” The animal room was kept on a 12-hour light/12-hour dark cycle at a temperature of 22°C ± 1°C and humidity of 50% ± 10%. The animals were group housed 5 per cage in clear polycarbonate cages with Alpha Dri (Shepherd Specialty Papers, Inc., Portage, MI) used as bedding. For gene expression analysis, 4 mice per dose group were utilized. The animal experimentation protocol was approved by an Institutional Animal Care and Use Committee.
High levels of dietary arsenic are found in standard laboratory chow. 36 A diet with high and variable background levels of the toxicant under investigation is expected to skew or mask experimental results (both pharmacokinetic and pharmacodynamics). Laboratory diet can also considerably confound the analysis of gene expression studies. The As level of purified diets (AIN-93G and AIN-93M) with an ultra-trace mineral mix was analyzed for As and found to have 20 ppb. 37 In our study, mice were acclimated on a purified diet, AIN-93M diet (Harlan-Tekland, Madison, Wisconsin), for 2 weeks prior to initiation of the arsenite study to allow for washout of residual arsenic in their system. Mice were provided with carbon-purified water at pH 3.3 to 3.8 as a vehicle for administration because mice consume more water at this pH range. 38 Mice also consume less deionized or distilled water when compared to carbon-purified water at all pH ranges. 38
Experimental Design
Body weights, food, and drinking water consumption were monitored weekly. The water bottles were changed 2 times a week. Female C3H mice were exposed to increasing concentrations of arsenite (0, 0.087, 0.434, 1, 10, and 85 ppm as arsenite or 0, 0.05, 0.25, 0.58, 5.77, and 49 expressed as elemental arsenic ppm) in their drinking water (pH 3.3-3.8) for 30 days.
The EPA regulates drinking water arsenic as elemental arsenic. Therefore, the lower concentrations were selected to be 0.05 and 0.25 ppm as elemental arsenic (which is 0.087 and 0.434 ppm when expressed as arsenite). Thus, the 2 lowest concentrations come out even as elemental arsenic (0.05 and 0.25), while the 3 higher groups (1, 10, and 85) have even numbers when expressed as ppm of arsenite. In much of this article, these 5 water arsenic concentrations are simply referred to as 0.05, 0.25, 1, 10, and 85 ppm.
On day 31, the animals were euthanized using carbon dioxide. Livers were flash frozen with liquid nitrogen and stored at −80°C. The left lungs of 4 selected mice per dose group were instilled with formaldehyde for pathology. All other lungs were removed and flash frozen in liquid nitrogen for later use. Histological examination of the lungs was done by light microscopy of hematoxylin and eosin-stained slides in an unblind manner. 39 A standard lesion scoring system was used for lung histology.
Lung and Liver Analysis
The determination of arsenical species (inorganic arsenic, MMA, and DMA) in tissue samples was performed using a Perkin Elmer 5100 atomic absorption spectrophotometer (Perkin-Elmer, Norwalk, Connecticut). Tissue samples (0.02-0.1 g, N = 5 or more per each treatment group) were digested using 2 mol/L phosphoric acid. 40 This method generates pentavalent arsenicals from both tri- and pentavalent arsenicals in tissues. Thus, we were unable to distinguish whether the arsenicals in the tissue samples were either in the tri- or in the pentavalent oxidation state.
Gene Expression Analysis
Frozen mouse lungs (4 mice/group) were homogenized in TRIzol. Total RNA was isolated from mouse lungs according to the TRIzol RNA extraction protocol (Invitrogen, Carlsbad, California) followed by RNeasy Mini Kit (RNeasy; Qiagen, Valencia, California). RNA quality was ascertained spectrophotometrically (ratio of A260-A280) using a NanoDrop ND-1000 spectrophotometer (NanoDrop Technologies, Wilmington, Delaware) and also by checking ratio of 18S to 28S RNA using the RNA Nano Chip on a 2100 Bioanalyzer (Agilent Technologies, Santa Clara, California). Total RNA (3 μg) was labeled using the Affymetrix One-Cycle complementary DNA Synthesis protocol and hybridized to Affymetrix Mouse Genome 430A 2.0 GeneChips (containing 39 000 probesets; all Affymetrix products from Affymetrix, Inc., Santa Clara, California) as described by the manufacturer. Biotin-labeled complementary RNA (cRNA) was then quantified using NanoDrop and evaluated for quality after fragmentation on a 2100 Bioanalyzer. Following overnight hybridization at 45°C to Affymetrix Mouse Genome 430A 2.0 GeneChips (for 0-85 ppm doses) in an Affymetrix Model 640 GeneChip hybridization oven, the arrays were washed and stained using an Affymetrix 450 fluidics station as recommended by the manufacturer and scanned on an Affymetrix Model 3000 scanner. After scanning, raw data (Affymetrix .cel files) were obtained using Affymetrix GeneChip Operating Software (version 1.4). Data (.cel files) were analyzed and statistically filtered using Rosetta Resolver version 6.0 software (RosettaBiosoftware, Seattle, Washington). Differentially expressed genes (DEGs) were determined using a 1-way analysis of variance (P ≤ .05) by Rosetta Resolver (Microsoft, Inc. Redmond, WA), a Benjamini-Hochberg false discovery rate (FDR) multiple testing correction (<.05), followed by a Scheffe’s post hoc test and a ±1.5-fold change cutoff. The DEGs were evaluated for canonical pathways and biological function using Ingenuity Pathway Analysis (Agilent Technologies, Santa Clara, California). A data set containing gene identifiers and their corresponding expression values of fold-changes was uploaded as a tab-delimited text file. Each gene identifier was mapped to its corresponding gene object in the Ingenuity Pathways Knowledge Base. A fold-change cutoff of 1.5-fold and P ≤ .05 was set to identify genes whose expression was differentially regulated. These genes were then used as the starting point for generating biological networks.
Results
Liver Arsenic Accumulation
As the mice were on a purified AIN-93M diet for over 6 weeks, the control animals accumulated very low arsenic tissue levels. In the liver arsenical level data, biological variation occurred in the exposure range of 0 to 1 ppm arsenite without any clear treatment effects. Mice start accumulating higher concentrations of total arsenic in liver at 10 and 85 ppm (4.3- and 38.7-fold, respectively) as shown in Table 2. Interestingly, at 0.05, 0.25, and 1 ppm concentrations, the MMA and DMA concentrations found were considerably lower than the concentrations of iAs (inorganic arsenic) in the liver.
Lung Arsenic Accumulation
The control animals accumulated almost undetectable arsenic levels in their lungs. With pulmonary iAs, DMA, and total As levels, there were clear elevations observed in the 0.05, 0.25, and 1.0 ppm treatment groups. Interestingly, there was no detectable MMA in the 0.25 ppm group, which also had the lowest number of differential genes expressed. Then, similar to the liver accumulation data, mice continued to accumulate more pulmonary arsenic at 10 and 85 ppm as shown in Table 3. However, the pulmonary inorganic arsenic accumulation started declining at 10 and 85 ppm when compared to 0.05 to 1 ppm treatment groups. Mouse pulmonary arsenic was elevated, that is, 16.3-, 21.8-, 76.1-, and 229-fold in the 0.05, 0.25, 1.0, and 85 ppm treatment groups, respectively. Although the 85 ppm group has an unusually low pulmonary iAs concentration of only 2 ng/g, the pulmonary concentrations of MMA (44.8 ng/g) and DMA (27.0 ng/g) were much higher.
Mouse Lung Concentrations of Arsenicals After 30-Day Exposure to a Wide Range of Drinking Water Arsenite Concentrations.a

Abbreviations: As, inorganic arsenic; EPA, United States Environmental Protection Agency; MMA, monomethylarsonic acid; DMA, dimethylarsinic acid; SEM, standard error of the mean; MCL, maximum contaminant level.
aValues are the mean ± SEM for 5 or 6 samples. The experimental animals were adult female C3H mice. Data are expressed as ng of the arsenical, for example, arsenate, MMA(V), DMA(V), and not as elemental arsenic. The total As is the sum of arsenate, MMA(V), and DMA(V). To decrease their background tissue arsenical concentrations, mice were fed a purified diet (AIN 93M) for 14 days prior to the study and also during the 30 days of drinking water arsenite exposure.
bThe limit of detection is about 0.2 ng/g tissue for all analytes. Arsenic drinking water concentrations are expressed as ppm sodium arsenite and as ppm elemental arsenic in 2 different columns.
cThe lower concentrations of 0.087 and 0.434 (as arsenite) were used and not 0.05 and 0.25 ppm to make them match elemental arsenic in the lower groups as the EPA MCL is expressed as elemental arsenic. The higher groups at 1 to 85 are ppm of the whole compound and not as elemental arsenic. Adapted from Chilakapati et al. 35
dStatistically significant versus control at P < .001 via a Kruskal-Wallis 1-way analysis of variance on ranks followed by individual t tests to determine P values.
eStatistically significant versus control at P < .01.
Pathology
By light microscopy of hematoxylin and eosin-stained sections, no significant changes in mean lesion scores occurred in the treated lung tissue (data not shown). The treated lungs resembled those of the control animals.
Dose Response in Number of Genes
There is no clear dose–response relationship in gene expression for arsenite in drinking water (Figure 1). Exposure to 0.05, 0.25, 1.0, 10, and 85 ppm resulted in 77, 38, 90, 87, and 87 DEGs, respectively.

Total number of differentially expressed genes (DEGs; with a 1.5-fold cutoff) after 0.05, 0.25, 1, 10, and 85 ppm arsenite exposure to lungs of female C3H mice at the end of 30 days of exposure via drinking water.
Venn Analysis
A ±1.5-fold change cutoff was applied to the DEGs to conduct Venn analysis. Overall, there was not much overlap between adjacent doses. The top 3 exposures (85, 10, and 1 ppm) and bottom 3 exposures (1, 0.25, and 0.05 ppm) had 1 common gene, respectively (Figures 2 and 3).

Venn analysis showing the common and unique number of significant differentially expressed genes (DEGs; with a 1.5-fold cutoff) among the top 3 doses (85, 10, and 1 ppm). The names of the common genes are shown in the figure.

Venn analysis showing the common and unique number of significant differentially expressed genes (DEGs; with a 1.5-fold cutoff) among the bottom 3 doses (1, 0.25, and 0.05 ppm). The names of the common genes are shown in the figure.
Pathway Analysis
To identify the unique and common responses to iAs by mouse lung, changes at the pathway and functional level were analyzed. Table 4 shows the results of an Ingenuity Pathway Analysis of the biological process level of the genes across all dose groups.
Ingenuity Analysis of Biological Processes in Significant Differentially Expressed Genes Across All Doses.

Cellular functions such as adhesion, cell cycle control, growth and differentiation, proteolysis, and phosphorylation were modulated by drinking water arsenic exposure (Table 4). This study has shown genomic changes in the pathways of cell death (0.05 and 0.25 ppm), cell cycle (0.05 and 1 ppm), and cell growth and proliferation (0.25 ppm). All 3 pathways could be causally connected to carcinogenesis both in this mouse lung system and in other species and target organs. These 3 pathways were always statistically different at all 5 exposure levels: cell death (P values of 6.9 E-07 to 4.9 E-02), cell cycle (2.4 E-05 to 4.9 E-02), and cellular growth and proliferation (8.0 E-04 to 4.9 E-02; Table 4). Differentially expressed genes were mapped using Ingenuity Pathway Analysis canonical pathways (data not presented). Most biological phenomena occur through interactions of multiple genes, via signaling pathways or other functional relationships. We could identify common pathways in the dose range used, though they were not found in each and every dose used. Interleukin 6 and acute-phase response signaling were the only 2 that showed up at 0.25 ppm dose. Ras homolog gene family, member A (RhoA) signaling, calcium signaling, actin cytoskeleton signaling, protein kinase A signaling, and acute-phase response signaling have been noted as major pathways that overlap somewhat among the different doses. Five signaling pathways that have been significantly impacted in at least 2 dose levels of arsenic exposure (Table 5 shows a partial list of genes exhibiting differential expression in these pathways) are now sequentially presented.
Sodium Arsenite Dose–Response Altered Gene Expression in 5 Common Significantly Impacted Pathways.
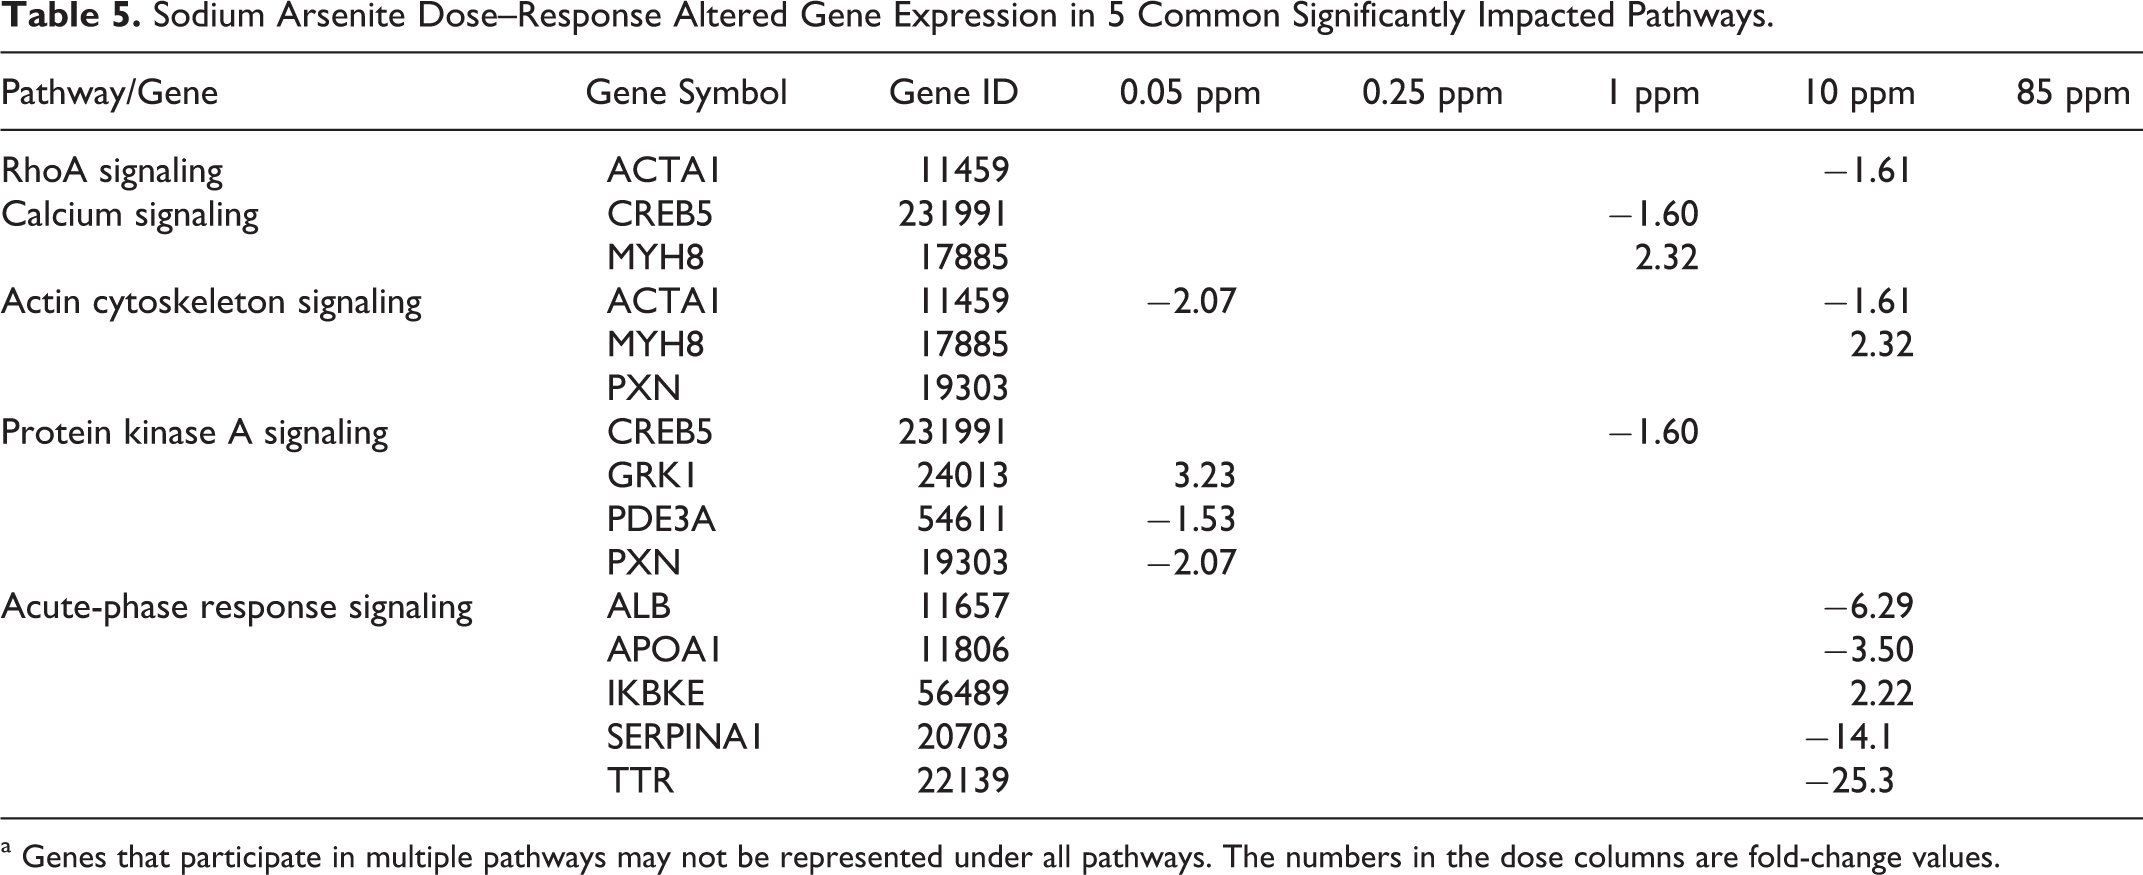
a Genes that participate in multiple pathways may not be represented under all pathways. The numbers in the dose columns are fold-change values.
Ras Homolog Gene Family, Member A Signaling (0.05, 1, and 10 ppm)
Ras homolog gene family, member A is a critical signaling molecule regulating a variety of cellular processes, such as cytoskeletal organization, adhesion, and apoptosis. It is recently considered responsive to reactive oxygen species (ROS). 41 The RhoA is regulated by several proteins and particularly by RhoGDI proteins, which maintain RhoA in its inactive GDP-bound form. 42 DNA microarrays have revealed that arsenite can downregulate messenger RNA levels of RhoGDI proteins. 43,44 Rho-activating effect of MMAIII has been reported recently. 45
Calcium Signaling (0.05 and 1 ppm)
Studies in cells show that the calcium stores and calcium receptors are a primary target of arsenic-induced deregulation, while the disturbance of [Ca2+]i homeostasis is related to reduced cell viability, DNA damage, and apoptosis. 46 –48 But, to introduce toxic effects, arsenic compounds do not necessarily need to be taken up and biotransformed, since they could trigger death mechanisms by interacting with the cell membrane or simply by small amounts of arsenic passing through the membrane. Such instances could be sufficient to modify other physiological processes such as calcium homeostasis. 48 –50
Actin Cytoskeleton Signaling (0.05, 1, and 10 ppm)
Arsenite-caused mitochondrial damage has been shown to play a crucial role in the accumulation of ROS leading to arsenic mutagenicity in vitro. 51 This increase in mitochondria-dependent ROS production by arsenite can be partly attributed to its interference in the dynamics of the actin cytoskeleton. 52,53 Actin carbonylation induced by H2O2 results in an increase in the lag phase and a decrease in both the polymerization rate and the polymerization extent. 54 Protein carbonylation may actually interfere with the actin bundling activity and disturb the integrity of the actin cytoskeleton under arsenite exposure. 55
Protein Kinase A Signaling (0.05 and 1 ppm)
Protein kinase A (PKA) regulates processes as diverse as growth, development, memory, and metabolism. The PKA represents a major regulator in cyclic adenosine monophosphate (cAMP) signal transduction pathway. The PKA is a multimeric protein consisting of 2 catalytic subunits complexed with a regulatory subunit dimer. 56 One study demonstrated the existence of synergism between arsenic and cAMP that triggers maturation pathway for acute promyelocytic leukemia (APL) cells. Although neither arsenic nor cAMP is sufficient alone in promoting terminal differentiation, these 2 signals cooperated to induce the maturation of APL cells. 57
Acute-Phase Response Signaling (0.25 and 10 ppm)
The acute-phase response is a rapid inflammatory response that provides protection against microorganisms using nonspecific defense mechanisms. In addition to infection, it can also be triggered by tissue injury, trauma or surgery, neoplastic growth, or immunological disorders. Typically, it consists of fever, an increase in inflammatory factors (such as proinflammatory cytokines), and a change in concentration of several plasma proteins (the acute-phase proteins) due largely to an altered hepatic metabolism. Arsenic exposure is known to increase the production of ROS. 58 –60 Alterations in intracellular oxidation–reduction (redox) reactions have been shown to activate signal cascades that regulate early response genes. This can also cause the activation of transcription factors (eg AP-1 and nuclear factor κB) and produce oversecretion of proinflammatory and growth-promoting cytokines, 17,61 resulting in increased cell proliferation and finally carcinogenesis. 62,63
Discussion
A lot of past research effort has been directed toward the role of arsenic on carcinogenesis in either skin or urinary bladder with little emphasis on lung as the target organ. This article is directed toward the effects of drinking water arsenic exposure on mouse lung incorporation of arsenicals and genomics. In general, mice are relatively resistant to arsenic toxicity due to their excellent metabolism and/or excretion of arsenic. However, it would be interesting to try longer periods of exposure (Table 1) and then study changes at the genomic level.
This study is unique in terms of the wide dose range studied (as low as 0.087 to as high as 85 ppb, a 977-fold range in exposure). These exterior drinking water arsenite concentrations were found to drive a 39-fold elevation in mouse hepatic total arsenic concentration (Table 2), while in the lung an even higher 229-fold elevation in pulmonary total arsenic (Table 3) was observed. These doses reflect low to high drinking water levels in humans as well as doses required for animal carcinogenesis studies. 24 In this study, we found that female C3H mice do not show any evidence of arsenic-induced major clinical–biological changes at the doses and time of exposure used in this experiment but do show changes at the genomic level. We also did not find any histological evidence of toxicity in the lungs by light microscopy, although we would expect to find histological changes if longer exposure time points were used. For example in 1 time course study, 64 mice showed major redox changes in liver at the 6- to 15-month time points, but few changes were observed at only 3 months after the start of arsenic exposure. Lungs are exposed to the highest oxygen tensions in the body; thus, ROS could preferentially form in pulmonary tissues.
This study is one of the few studies that has used a purified low arsenic diet. Thus, in control mice, we did not detect iAs in liver or lung, and very low total As was found in mouse lungs. Using a purified diet, increases in mouse tissue arsenic levels could be detected with arsenite exposures as low as 0.05 ppm in the case of iAs in both mouse liver and lung. At the intermediate exposure concentrations of 0.25 and 1 ppm, hepatic iAs was elevated along with iAs, DMA, and total As in mouse lungs. At 10 and 85 ppm arsenite exposures, almost all tissue arsenicals were elevated often to a fairly large degree in the 5- to 225-fold range (Tables 2 and 3). This combined pharmacokinetic–pharmacodynamic data set can be useful in better linking exterior drinking water exposure concentrations, interior speciated arsenical tissue concentration, and subsequent adverse biological effects.
This 5 exposure-level dose–response study has resulted in pulmonary and hepatic iAs, MMA, and DMA data over the unusually broad range from 0.05 to 85 ppm. These data sets could be of utility to pharmacokinetic modelers interested in (1) low exposure concentrations applicable to current human exposures and risk assessments and (b) extrapolation from animal to human exposures.
A similar study was previously conducted in K6/ODC mice administered 0, 0.05, 0.25, 1.0, and 10 ppm sodium arsenite in their drinking water for 4 weeks 65 to identify potential biomarkers and modes of action for skin tumorigenicity. K6/ODC transgenic mice are hairless mice, especially useful to detect the skin carcinogenicity of mutagenic chemicals administered at low doses within months of exposure. 28 With respect to the mouse skin study, (1) low exposures to arsenite caused an unexpectedly large number of DEGs (437-511) in the 3 lowest exposure groups and (2) the highest exposure group had the most DEGs (1227), fitting simple dose–response theories. 65 With respect to the present lung study from animals eating a purified AIN-93M diet, (1) the lowest exposure group responded very well (77 DEGs), (2) surprisingly, 0.25 resulted in lower number of DEGs when compared to 0.05 ppm, and (3) at higher arsenic exposures of 10 and 85 ppm which greatly increased total, MMA, and DMA lung arsenical concentrations (Table 3), there was not a dramatic increase in DEGs found (87 DEGS at both dose levels). This lack of responsiveness to tissue total arsenicals of 76 and 229 times control levels is quite unexpected and hard to explain. If the pulmonary responses were largely driven by the arsenite concentration alone, the observed pattern makes more sense. In pulmonary iAs concentration, there is a big jump from not detected to 21 ng/g iAs when compared to the control and 0.05 ppm groups. Increasing the exposure level to 10 ppm did not increase lung iAs concentrations. At 85 ppm arsenite exposure, the pulmonary iAs was actually decreased to 2 ng/g only about 10% of what it was at lower exposures. Venn analysis of the top and bottom 3 doses showed that the effects are fairly different across this wide dose range and that arsenic can be acting differently in different regions of the exposure range, more dependent on the dose than similar based on the same exposure compound. In both of these studies (and the current study), 65 arsenic-induced genomic effects often appear only over certain dose windows and are not simple monotonic (always increasing or decreasing) biological effects. The large dose range used and the large amount of spacing between the drinking water doses in our studies have produced a genomic data set with many nonmonotonic effects, just as in a prior arsenic study in K6/ODC mice. 65
In comparing these 2 similar dose–response studies with arsenite, one is struck with several overall facts: (1) lower arsenite concentrations are responding much more than anticipated or easily explained, (2) simple monotonic dose–response models are not well matching the experimental results, and (3) the lowest arsenite exposures of 50 ppb (the former American maximum contaminant level [MCL]) showed both observable effects and a higher number of DEGs than did at least 1 higher exposure concentrations. From this, we conclude that genomic dose–response studies of arsenicals in vivo after longer exposure times are still in their infancy and we are not close to understanding the types of genomics results that are being obtained. If arsenic operates via multiple mechanisms in multiple dose windows, then one would expect a genomics pattern as complex as the one actually observed. Nevertheless, such low-level subchronic exposures are the key to understanding important chronic diseases such as ar
In the attempt to link mouse lung arsenical concentrations (Table 3) with genomic effects (Tables 4 and 5), one can see where the larger mouse lung arsenicals increases are (e. g. 0.087 ppm for iAs, 10 ppm for DMA) as the exterior arsenite dose is increased. Based on Table 3 data, from control to 0.087 ppm arsenite, the lung iAs appears to be the likely driver of genomic effects. Increasing to 0.434 ppm arsenite, the large increase from 0.67 to 3.96 ng/g lung DMA is notable. At 1, 10, and 85 ppm arsenite, both mouse lung MMA and DMA concentrations rose dramatically, without major increases in lung iAs concentration (Table 3). Thus, depending where you are on the dose–response curve, the more likely genomic drivers are iAs (0.087 ppm), DMA (0.434 ppm), or MMA and DMA together (1, 10, and 85 ppm).
Genes identified via microarray in screening of tissues exposed to arsenic are a valuable tool in determining the mechanism of arsenic toxicity and cancer formation. Gene expression changes can act as sensitive indicators of molecular processes at doses where standard toxicological end points are not responsive and these genomic changes could provide insights into the precursor events that might eventually lead to serious disease outcomes. 66 Moreover, genomic tools have the potential to uncover adverse events at treatment levels below the limits of detection of traditional measures of toxicity, at much earlier times, and provide a wealth of mechanistic information. 66 The list of candidate genes and processes identified in this study will need further investigation to confirm their role in events that occur at low exposures to arsenic and that could potentially lead to carcinogenicity following chronic exposure of iAs to mice.
In summary, this study demonstrates that exposure to drinking water arsenic at levels that have been found in the past in US drinking water (0.05 ppm) is associated with altered genomic expression profiles in the C3H mouse lung. A definitive understanding of the various mechanisms of arsenic action in experimental animal models will both provide useful data and assist in model selection and development in arsenic risk assessment. With further validation, some of these genes may be useful as intermediate biomarkers in studies investigating arsenic-associated chronic diseases. Future investigation of the effects of arsenic on the function of these pathways is warranted. These data identify pathways that will help guide investigations into mechanisms of arsenic’s health effects and help clarify the threshold for biologic effects and potential disease risk. These data not only facilitate understanding the mechanism of lung carcinogenicity of iAs but also provide useful information for establishing an appropriate animal model for pulmonary arsenic risk assessment.
Footnotes
Acknowledgments
We thank Gail Nelson and Janice S. Lee for reviewing this manuscript as part of EPA clearance procedures.
Author’s Note
Although the research described in this article has been supported by the US Environmental Protection Agency through an EPA postdoctoral trainee award to Jaya Chilakapati, it has not been subjected to official Agency review and therefore does not necessarily reflect the views of the Agency and no official endorsement should be inferred. This article has been approved for publication by the US EPA NHEERL clearance procedure. Mention of trade names or commercial products does not constitute endorsement or recommendation for use. This manuscript does not necessarily reflect the views of US EPA.
Declaration of Conflicting Interests
The author(s) declared no potential conflicts of interest with respect to the research, authorship, and/or publication of this article.
Funding
The author(s) disclosed receipt of the following financial support for the research, authorship, and/or publication of this article: This work was funded by the United States Protection Agency. This work was supported by UNC/EPA Cooperative Agreement EPA CR 833237.