
Abstract
This study focuses on xanthated cellulose fiber (XCF), a precursor of cellulose nanofiber (CNF), innovatively integrates orthogonal experiments, two-factor analysis of variance, stepwise regression, and particle swarm optimization to systematically analyze and precisely control its degree of substitution (DS). Based on a three-level four-factor orthogonal design and supplementary tests, a quadratic nonlinear regression model with R2 = 0.9214 was established using 29 datasets, confirming the model’s significance. Carbon disulfide (CS2) dosage was identified as the most influential factor, and all six interaction terms were statistically significant. The optimal process parameters obtained via particle swarm optimization were: NaOH concentration 7.47%, alkali treatment time 4.38 h, CS2 dosage 0.53 mL, and xanthation time 2.74 h. A verification experiment under these conditions yielded a DS of 0.972, with only a 2.8% deviation from the predicted value. This study provides a precise and controllable pretreatment strategy for the efficient and low-energy preparation of CNF, demonstrating significant potential for industrial application.
Keywords
Introduction
Nanocellulose, due to its unique lightweight and high-strength properties as well as superior thermal insulation and electrical insulation performance, has received extensive attention in recent years in fields such as environmental protection, building materials, and lightweight products.1 –3 According to structure and final morphology, plant-derived nanocellulose can be classified into: cellulose nanocrystals (CNC) and cellulose nanofibers (CNF). 4 The latter retains both the crystalline regions and some amorphous regions of the fiber during the preparation process. Compared with CNC, CNF has a higher aspect ratio, which enables materials made from CNF to combine flexibility and strength, and are often applied in fields such as hydrogels, polymer composites, and aerogels. 5
The internal forces of natural cellulose are mainly composed of van der Waals forces and hydrogen bonds, which makes the preparation of CNF difficult. 6 The methods for preparing CNF are mainly divided into three types: physical, chemical and biological treatments. 7 Physical treatment methods destroy the microstructure of cellulose through physical forces. Supian et al. 8 used nano-grinding equipment for mechanical processing to prepare CNF. Ovalle-Serrano et al. adopted ultrasonic disruption as an auxiliary method, combined with mechanical processing, to prepare CNF. 9 Li et al. 10 used the shear effect of high-pressure homogenization to prepare CNF. The chemical treatment methods mainly reduce the crystallinity of the raw materials to make cellulose more susceptible to hydrolysis. Wang et al. 11 carried out chemical pretreatment of the raw materials using an acid hydrolysis process. Xu et al. 12 used a method combining alkaline pretreatment with a high-pressure homogenizer to prepare CNF. The biological pretreatment involves using microorganisms or enzymes to degrade lignin and hemicellulose to improve the extraction efficiency of cellulose. Combined with mechanical processing methods, it can more effectively prepare CNF. The team of Su used a method of coupling cellulase with mechanical processing to prepare CNF. 13
In recent years, with the in-depth research on the role of xanthated groups in fibers, it has been found that cellulose in fibers, after alkalization and sulfidation reactions, generates xanthated cellulose (CX). 14 Due to the introduction of charged groups, namely xanthated groups, heavy metal ions can be separated from wastewater, achieving the purpose of wastewater treatment. Regarding the application of xanthated cellulose fiber, Yamaguchi et al. 15 studied the dispersion stability of xanthated cellulose fiber and explored their application as Pickering emulsion stabilizers in the preparation of nanocomposites. In the preparation of nanocellulose, xanthated cellulose fibers are conducive to the efficient separating of single CNF. A research team has innovatively developed a xanthated substitution pretreatment process. 16 By introducing mutually repulsive charged groups, the hydrogen bonds and van der Waals forces between CNF are disrupted, effectively promoting the efficiency of subsequent mechanical defibrillation, significantly reducing the energy consumption of mechanical treatment. It is also clearly proposed that when the average degree of substitution of xanthated groups is 1, that is, on average, one of the three hydroxyl groups on each glucose unit of the original cellulose is a xanthated group, it is the optimal choice from the perspective of yield and efficiency in preparation. However, a quantitative model capable of accurately predicting and systematically optimizing the degree of substitution of xanthate groups on cellulose remains unavailable. The determination of process parameter values predominantly relies on empirical trial-and-error approaches, thereby impeding precise and efficient control over the pretreatment process.
In the field of experimental parameter optimization, the Response Surface Methodology (RSM) is widely adopted for process parameter optimization. This approach typically employs a second-order polynomial model to characterize nonlinear relationships between factors and responses. For instance, Susi et al. 17 utilized RSM to optimize the carboxymethylation process of cellulose extracted from oil palm empty fruit bunches, systematically investigating the effects of NaOH, isopropanol, and monochloroacetic acid ratios on the degree of substitution. Similarly, Zhou et al. 18 integrated Plackett–Burman and Box–Behnken designs to screen and optimize the carboxymethylation conditions of inulin, leading to a significant improvement in the degree of substitution. In a comparable study, Abd Rauf et al. 19 conducted multi-objective optimization of carboxymethylation parameters for oil palm trunk fiber using a Box–Behnken design, achieving carboxymethyl cellulose (CMC) with a high degree of substitution. These studies illustrate the extensive application of RSM in optimizing the degree of substitution and its efficacy in elucidating main effects and interaction effects among parameters. However, RSM generally relies on a predefined second-order polynomial model that includes all main effects, quadratic terms, and interaction terms. This approach lacks the capability to automatically exclude insignificant variables, which may result in the retention of parameters with negligible influence on the response, thereby leading to model redundancy and reduced interpretability.
To address the aforementioned limitations, this study innovatively establishes a systematic framework integrating orthogonal experiments, two-factor analysis of variance (ANOVA), stepwise regression, and intelligent optimization algorithms for precise regulation of the cellulose xanthation pretreatment process. With the degree of substitution (DS) equal to 1 set as the optimization objective, significant influencing factors and their interactions were identified through a four-factor, three-level orthogonal design coupled with two-factor ANOVA. Based on the experimental data, a quadratic multiple regression model was constructed after variable screening via stepwise regression, and the optimal combination of process parameters was determined using the particle swarm optimization algorithm. The validated model demonstrated accurate prediction of the degree of substitution of xanthate groups, providing a theoretical foundation for the preparation of nanofibers. Ultimately, cellulose xanthate fibers with a DS close to 1 (0.972), fabricated under the optimized conditions, were successfully converted into nanofibers with an average diameter of approximately 20 nm through ultrasonic fibrillation (Figure 7). Furthermore, spectroscopic analysis confirmed the characteristic absorption of xanthate groups at 303 nm and their acid hydrolysis response (Figure 8), thereby jointly validating the success and efficacy of the xanthation pretreatment from both morphological and chemical structural perspectives.
Experimental preparation and data testing
Experimental materials
Cotton pulp was provided by Shandong Yinying Chemical Fiber Co., Ltd. Ammonium chloride (99.5%), carbon disulfide (analytical grade) and starch (analytical grade) were provided by Aladdin Reagent Co., Ltd. Glacial acetic acid (99.5%) and sodium hydroxide (96.0%) were provided by Tianjin Fengchuan Co., Ltd. Standardized iodine titration solution (0.05 mol/L) was provided by Tianjin Comieau Co., Ltd. Phenolphthalein indicator solution (1%) and sodium thiosulfate solution (0.05 mol/L) were provided by Maclean Reagent (China) Co., Ltd. All chemicals were used as received without further purification.
Preparation and principle of xanthated cellulose fibers
The present study primarily employs alkalization and xanthation methodologies, with the pretreatment steps prior to defibration conducted under ambient conditions at a temperature of 24°C ± 1°C. The detailed procedure is outlined as follows:
Alkalization stage: 1 g of cotton pulp board sample was accurately weighed and then processed by a crusher to make it fully dissociate into a fluffy fiber state. The treated fluffy cotton pulp was transferred into a 100 mL round-bottom flask. Referring to the orthogonal test plan, 20 mL of NaOH solution with a specific concentration (concentration gradients were 5%, 7%, 9%) was added into the flask. The round-bottom flask containing the reactants was placed on a magnetic stirrer, and the alkalization reaction was carried out at room temperature(24°C ± 1°C). The stirring time was set according to the orthogonal design (e.g. 2, 3, 4 h).
Xanthate group substitution stage: After the alkalization step was completed, according to the orthogonal test design, a predetermined volume of CS2 solution (0.1, 0.4, or 0.7 mL) was added according to the orthogonal test design. The magnetic stirring state was maintained, and the xanthate group substitution reaction was carried out within the set CS2 reaction time (3, 4, 5 h). This process aimed to synthesize a series of xanthated cellulose fibers with different degrees of substitution. Subsequently, the degree of substitution of the obtained products was determined to evaluate the influence laws of factors such as alkali concentration, alkalization time, CS2 dosage, and esterification time on the degree of substitution.
The principle explanation for the above reaction is as follows: cellulose molecules are closely connected by hydrogen bonds, and most solvent molecules have difficulty penetrating into the interior of the fibers. The specific mechanism of xanthate group substitution is shown in Figure 1.

Formation mechanism of xanthate functional groups across distinct reaction stages.
Degree of substitution test
Determination of degree of substitution: The degree of substitution of xanthated groups was determined by the Bredee method, which was the value relative to all (-OH) groups at the second, third, and sixth positions of cellulose. The specific operation steps were as follows:
Sample pretreatment: Approximately 1.0 g of cellulose xanthate fiber sample was accurately weighed into a 100 mL beaker. 40 mL of saturated ammonium chloride solution was added to the beaker. It was stirred thoroughly with a glass rod to crush the sample and mix it evenly with the solution. The mixture was left to stand for about 15 min. Then, the mixture was filtered using a 2500-mesh filter cloth. During the filtration process, the residue on the filter cloth was thoroughly rinsed with saturated ammonium chloride solution.
Alkali treatment: The filtered sample along with the filter cloth was transferred to a 500 mL tall beaker. 50 mL of 0.5 mol/L sodium hydroxide solution was added to the beaker. It was stirred to mix evenly and was left to stand for 15 min.
Neutralization: After the alkali treatment was completed, the solution was neutralized by adding 1.5 mol/L acetic acid. Phenolphthalein was used as an indicator until the color change of the solution indicated the completion of neutralization (from red to colorless). After the neutralization was finished, 250 mL of distilled water was added to the beaker, and the mixture was stirred thoroughly.
Titrimetric analysis: Using a volumetric pipette, 10 mL of 1.5 mol/L acetic acid solution and 10 mL of 0.05 mol/L iodine solution were sequentially added to the above solution. Immediately, the mixture was titrated with a 0.05 mol/L sodium thiosulfate standard solution. When the titration was approaching the end point, 1% starch solution was added as an indicator. The volume of the sodium thiosulfate standard solution consumed at the end point was recorded.
The sulfidity can be calculated by formula (1) based on the titration volume of sodium thiosulfate and the cellulose content in the sample. Sulfidity is used to characterize the fraction of hydroxyl groups in cellulose fibers that have been substituted by xanthate groups.

The calculation of substitution degree is based on equation (2).

In the above formula, S represents the sulfidity, with the unit of mol%; T is the titration volume of sodium thiosulfate, with the unit of mL; CC is the cellulose content in the sample, with the unit of g.
Orthogonal test
In the experiment for preparing xanthated cellulose fibers, external factors such as ambient temperature and pressure were kept constant. The factors affecting the degree of substitution of cellulose xanthate were the concentration of NaOH (%), alkalization time (h), dosage of CS2 (mL), and xanthation time (h).
To obtain the optimal factor combination for achieving the desired degree of substitution in the preparation of xanthated cellulose fibers, an orthogonal test design was adopted in this study. Orthogonal test design is a multi-factor and multi-level experimental design method, which aims to obtain comprehensive and reliable information on the relationship between dependent and independent variables through a limited number of experiments. Its purpose is to identify the key factors affecting the results, their interactions, and the optimal experimental conditions. As an efficient and rapid experimental design method, it can significantly reduce experimental costs and time, and is widely used in the field of process improvement. The core idea of orthogonal test design is to select representative combinations from all possible level combinations of a full-scale experiment based on the principle of orthogonality for testing. These combinations exhibit the characteristics of “uniform dispersion and neat comparability”; through the analysis of their experimental data, the laws of the full-scale experiment can be inferred, thereby achieving the experimental objectives.
In this experiment, three levels were set for each factor: the concentration of NaOH was set at 5%, 7%, and 9%; the dosage of CS2 was set at 0.1, 0.4, and 0.7 mL; the alkalization time was set at 2, 3, and 4 h; and the xanthation time was set at 3, 4, and 5 h. A full-scale experiment covering all these factors and levels would have required 81 (34) runs. However, in accordance with the requirements of orthogonal test design, only nine experiments were needed to achieve the equivalent effectiveness of a full-scale experiment. This method effectively avoided the influence of interactions between different levels on the experimental results, thus enabling a more accurate analysis of the extent to which each factor affects the outcome.
Objective of the orthogonal test
The fiber diameter decreases with an increase in degree of substitution. The chemical mechanism behind this phenomenon can be explained as follows: a higher degree of substitution leads to more xanthate groups between the fiber molecular chains, resulting in stronger intermolecular electrostatic repulsion. This stronger repulsion makes it easier to defibrate the fibers into thinner ones. However, when the degree of substitution of xanthate exceeds 1, the excess xanthate groups significantly enhance the hydrophilicity of the xanthated cellulose polymer. During defibration treatment, the xanthated cellulose polymer tends to dissolve, which is unfavorable for the preparation of nanocellulose. Existing research has shown that when the degree of substitution is around 1, it not only ensures the complete progression of the xanthation reaction but also avoids adverse effects on the subsequent defibration and shaping experiments of cellulose caused by excessively high degree of substitution. 16 Therefore, a degree of substitution of 1 was selected as the target of the orthogonal test.
Determination of factors and levels
In this study, the concentration of NaOH, alkalization time, dosage of CS2, and xanthation time—all factors influencing degree of substitution—were chosen as the experimental factors, with each factor divided into three levels. The factors and their corresponding levels in the orthogonal test are presented in Table 1.
Factors and their corresponding three levels in the orthogonal experiment.

Design of the experimental table
Based on the factors and levels determined above, an L9 (34) experimental table was designed, as shown below:
Testing and characterization
Scanning electron microscopy
The dried fiber specimens were firmly adhered to the sample stage using conductive adhesive, followed by sputter coating with gold under vacuum. Subsequent observations of the surface microstructure were conducted employing a Hitachi S4800 field-emission scanning electron microscope (Japan). Test parameters were maintained as follows: vacuum pressure of 2 × 10⁻¹ Pa, ambient temperature of 25°C, relative humidity of 30%, and an electron acceleration voltage set between 10 and 15 kV.
Transmission electron microscopy
The XCNFs suspension was initially diluted to a mass fraction of 0.1%, and a droplet of the diluted solution was deposited onto a copper grid. The grid was subsequently frozen in a refrigerator for 3 h and then transferred to a freeze-dryer for lyophilization over 4 h. After pretreatment, the sample-loaded grid was immersed in a 3% phosphotungstic acid solution for negative staining (2–3 s) and air-dried at room temperature for 3 h. The dried grid was mounted into the sample chamber using a TEM-specific holder. Instrumental settings included an acceleration voltage of 120 kV, sample tilt adjustment range of ±20°, and image tilt capability up to ±90%. Observations of the microstructure and internal architecture were performed using a Hitachi H7650 transmission electron microscope (Japan) under high-vacuum conditions (better than 5 × 10⁻³ Pa), at 25°C ambient temperature and approximately 30% relative humidity. Suitable magnifications were selected, and images were acquired and recorded via a CCD imaging system.
Ultraviolet-visible spectrophotometry
A UH5700 UV-Vis-NIR spectrophotometer manufactured by Hitachi Scientific Instruments (Beijing) Co., Ltd. was used to perform ultraviolet (UV) spectral analysis for determining the absorbance.
The sample preparation process was carried out as follows: 1 g of fiber was taken and treated using the optimal process parameters obtained from the optimization calculation of the planning model (i.e. alkalization with 7.47% NaOH for 4.38 h and xanthation with 0.53 mL CS2 for 2.74 h). The xanthated cellulose fiber was then washed with distilled water until it became colorless, and further processed into a 400 mL nanocellulose dispersion (with a solid content of 0.025 wt%) using a high-pressure homogenizer. After diluting the dispersion 150 times, the test was conducted.
Data analysis and model calculation
Orthogonal test analysis
This paper utilized the four-factor and three-level design in Table 2 to conduct an L9(34) experiment, and performed orthogonal test analysis on the degree of substitution of xanthated cellulose fiber. The orthogonal test results are shown in Table 3, and the variance analysis results are presented in Table 4. From Table 3, it can be observed that the magnitude of range R reflects the degree of influence of each factor on the degree of substitution of xanthated cellulose fibers. The range of the average values of the two repeated tests is R_C > R_A > R_B > R_D, indicating that the degree of substitution of the xanthate group is most affected by the CS2 dosage (C), followed by the NaOH concentration (A), while the effects of alkalization duration (B) and xanthate esterification duration (D) on the degree of substitution of xanthated cellulose fibers are relatively small.
Experimental combinations based on orthogonal design.

Experimental results and range analysis of different test combinations.

Results of one-way ANOVA for NaOH concentration, alkali treatment duration, CS2 dosage, and xanthation time.

Indicates a highly significant difference (p < 0.01).
The calculation of range analysis is simple and it can sort out all the examined factors in order of importance to identify the main factors, thus playing a certain role in analyzing the data. However, range analysis is difficult to answer the question of at what level the influence of factors on the experiment is significant, and whether the fluctuations in the data are due to explainable errors or random errors. This reflects the limitations of range analysis. Therefore, this paper conducts variance analysis on the data from the two experiments again, and the variance analysis table is shown in Table 4.
The closer the p-value is to zero, the more significant the influence of the factor on the experimental result. As shown in Table 4, the alkalization time (h), the NaOH concentration (%), CS2 dosage (mL), and the xanthate group esterification duration (h) all have extremely significant effects on the substitution degree of xanthated cellulose fiber.
Establishment and solution of multivariate nonlinear regression model
Two-factor analysis of variance
The method of two-factor analysis of variance not only can test the effect of each factor itself on the dependent variable (main effect), but also can test the interaction effect of the two factors, that is, whether the combined effect of the two factors is different from the additional effect produced when they act separately.
Based on the orthogonal test data, we conducted two-factor analysis of variance for the six factor combinations of AB, AC, AD, BC, BD, and CD. The specific p-values corresponding to the interaction terms obtained through the solution are shown in Table 5.
p-Values of interaction terms for pairwise combinations of NaOH concentration, alkalization time, CS2 dosage, and xanthation time.

As shown in Table 5, the P-values for all six interaction terms are below 0.05. Therefore, it can be concluded that when two of the four factors act together, they will indeed have additional effects different from their individual effects. In the subsequent construction of the multivariate nonlinear regression model, six interaction terms will be added, and the individual quadratic terms of each factor will also be added to construct a multivariate quadratic nonlinear regression model.
Establishment of the regression model
In order to further enhance the extrapolation ability of the model, 11 sets of test data outside the orthogonal test range were randomly collected in this study. The specific data are shown in Table 6.
Specific conditions and experimental results of supplementary tests.

Based on the orthogonal test data (18 sets) and supplementary test data (11 sets), a total of 29 sets of sample data were used to construct a multivariate nonlinear regression model for predicting the degree of substitution. The model should include the following variables:
Main effect terms: NaOH concentration (
Square terms:
Pairwise interaction terms:
Therefore, the initial model equation is:

Parameter estimation: Least squares method
The parameter estimation for the multivariate quadratic nonlinear regression model is based on the Least Squares Method. 20 Its core objective is to minimize the sum of squared residuals (RSS) between the predicted values and the experimental values.
The specific steps are as follows:
Matrix Construction: The 29 sets of experimental data are constructed into the design matrix X and the response vector Y in the following form:

Parameter solution: Based on the Least Squares Method, the regression coefficients

Model verification: After obtaining the coefficients, an F-test should be conducted for the entire regression model based on the obtained coefficients, as well as a t-test for each term.
Stepwise regression: Variable selection and model optimization
To enhance the simplicity and predictive ability of the model, the Stepwise Regression method is employed to select significant variables. The specific process is as follows:
Initial model input: All 15 variables should be included.
Backward elimination: Start from the full model and successively eliminate the term with the largest P-value in the t-test. After each elimination, the parameter estimation operation is performed again. Repeat this process until the P-value of all variables is less than 0.05.
After completing the above steps, the final model is obtained, as shown in the following formula.

Existing research has shown that when there is complete multicollinearity among the independent variables, the Least Squares Method will be unable to estimate the regression coefficients. Therefore, a multicollinearity test was conducted on the retained independent variables in the final model, and the result
Establishment and solution of single-objective mathematical programing model
Based on the obtained regression model, a mathematical programing model was constructed to optimize and solve for the corresponding experimental parameter combinations of the degree of substitution.
Objective function: According to the summary of previous experiments, the fiber diameter decreases as the degree of substitution increases. The theoretical mechanism is that the higher the degree of substitution, the more xanthated groups there are between the fiber molecular chains, the greater the electrostatic repulsion, and the easier it is to unwind into fine-diameter fibers. If the degree of substitution exceeds 1, excessive xanthated groups will significantly enhance the hydrophilicity of the xanthated cellulose macromolecule, and during the unwinding process, the xanthated cellulose macromolecule will move toward the dissolution direction, which is not conducive to the preparation of nanofibers. Therefore, considering comprehensively, a degree of substitution around 1 can ensure that the xanthate esterification reaction is both sufficient and will not be affected by a high degree of substitution in the subsequent unwinding and formation of nanofibers. Therefore, the following optimization objective is set:

Decision variables: Set the decision variables as four factors: A, B, C, and D.
Constraints: Based on the previous experimental exploration and relevant literature, the approximate reasonable ranges of each variable were obtained: namely, the range of NaOH solution concentration is 5%–9%, the range of alkalization time is 1–5 h, the range of CS2 dosage is 0.1–0.9 mL, and the range of xanthate esterification duration is 1–6 h. 16

Algorithm solution: The particle swarm optimization (PSO) algorithm was employed to solve the optimization model and find the optimal set of decision variables. 21 The specific steps are as follows:
Step 1 Initialize particles:
A population of 200 particles was randomly initialized, where each particle represents a set of experimental variables. The particle is represented as a four-dimensional vector [A, B, C, D], corresponding to NaOH concentration/%(A), Alkalization time/h(B), CS2 dosage/mL(C), and xanthate esterification duration /h(D).
Step 2 Calculate the fitness function:
The fitness function is a composite indicator that comprehensively considers factors such as NaOH concentration, alkalization time, CS2 dosage, and xanthate esterification duration. The goal is to minimize the difference between the value of these indicators when substituted into the polynomial and 1. Considering the constraint that the degree of substitution is less than or equal to one in this experiment, when the difference is greater than zero, the fitness is set to infinity. The objective function is:
Step 3 Update the individual optimal solution and the group optimal solution:
For each particle, compare its fitness value with its best position pbest. If it is better, update its current position to pbest. For each particle, compare its fitness value with the best position of the group gbest. If it is better, update its current position to gbest.
Step 4 Determine whether the convergence criteria are met:
If the fitness of gbest reaches 0, or if the iteration has reached 500 times, output the result gbest; otherwise, continue to calculate the next step.
Step 5 Update the particle weights:
To enable the population to better search for the optimal solution, this paper introduces inertia weights. Here, the linearly decreasing inertia weight (LDIW) algorithm is selected. The specific calculation is as follows:

Here,
Step 6 Update particle velocity:
The particle velocity changes are influenced by its individual optimal position information and the group optimal position information. The calculation formula is as follows:
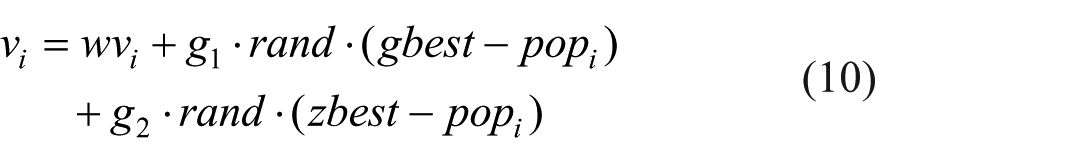
Among them,
Step 7 Update particle positions:
Update the particle positions with a step size of 1:

Return to Step 2.
Verification and results
Nonlinear regression model verification
Significance test
A multivariate nonlinear regression model for the dependent variable of degree of substitution was solved. After backward elimination of insignificant factors, the estimated parameters of each factor and the error analysis are shown in Table 7. The standard errors of the parameters are within the acceptable range, and all are significant in the t-test, which proves that the parameter estimation is reliable and accurate.
Test results of each parameter in the regression model.

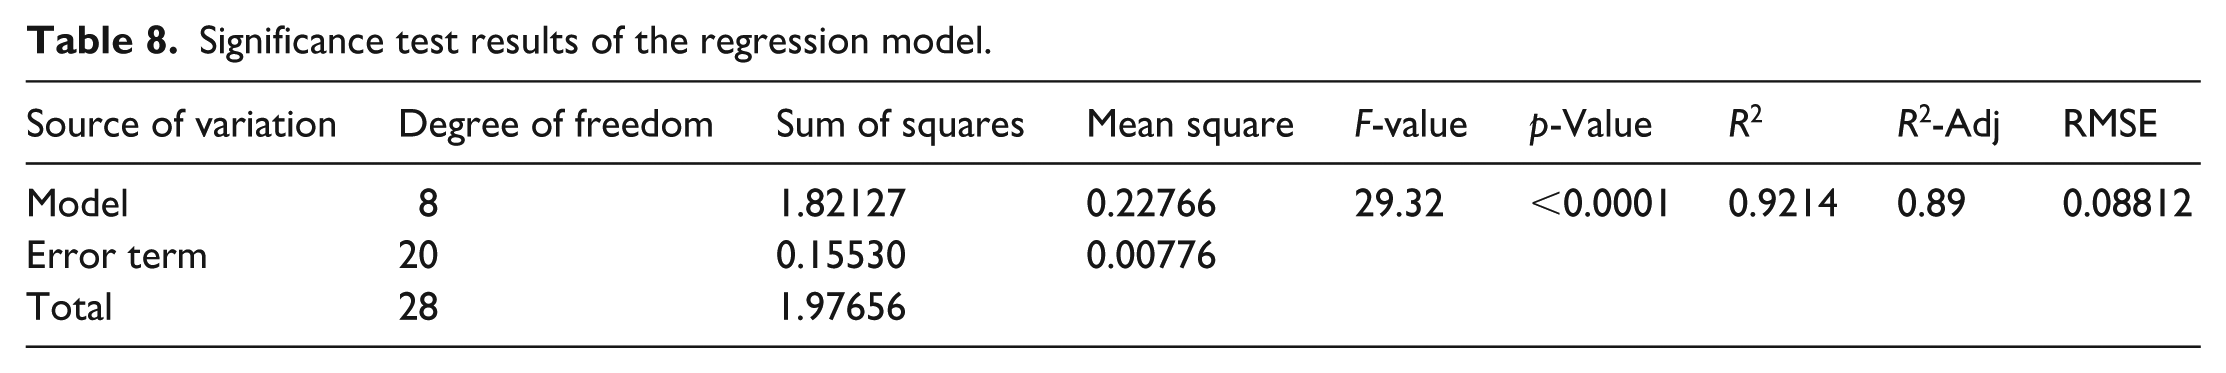
A significance test was conducted on the overall regression model, and the results are shown in Table 8. The F value of the model is 29.32, indicating that the model as a whole is significant; the coefficient of determination R2 is 0.9214, indicating that the model can explain 92.14% of the variance; the regression model has credibility; the adjusted coefficient of determination R2-Adjusted is 0.89, which indicates that the model avoids overfitting and has excellent explanatory ability under the condition of controlling the number of variables; the root mean square error (RMSE) is 0.08812, showing that the deviation between the predicted values and the experimental values is small.
Significance test results of the regression model.
Residual analysis
For our multivariate regression model, we conducted residual analysis as shown in Figure 2.

Standardized residual scatter plot (a), histogram of standardized residual distribution (b), and model fit evaluation chart (c).
In Figure 2(a), most of the regression standardized residuals are randomly distributed near zero, showing no obvious trend or pattern. This indicates that the assumptions of linear relationship and homoscedasticity of the model are basically valid, and the model can well capture the linear relationship in the data, with the variance of the error term remaining stable.
In Figure 2(b), the distribution of residuals is close to a normal distribution, and it fits well with the normal distribution curve. This indicates that the residuals satisfy the normality assumption, further verifying the rationality of the model.
Figure 2(c) shows the comparison between the original data and the model-fitted data. It can be seen that the trend of the model-fitted data (red line) is basically consistent with that of the original data (blue dots), indicating that the model can well fit the experimental data and capture the main features of the data. However, in some areas (such as areas with fewer data points or greater fluctuations), the model-fitting effect has certain deviations, which may be related to the complexity of the model or the inherent variability of the data.
Based on the results of the residual analysis, this polynomial regression model satisfies the linear relationship, homoscedasticity, and normality assumptions to a certain extent, and the overall fitting effect is good.
Mathematical programing solution results
The optimal experimental combination parameters for the three groups were obtained through the particle swarm optimization algorithm, and are shown in Table 9.
Optimal solutions obtained via particle swarm optimization algorithm.

To verify the authenticity and effectiveness of the optimal solution, experiments were conducted and compared with the predicted values. The average deviation between the three sets of measured values and the predicted values was 0.03533, indicating that the optimization scheme is reliable and the regression model is effective. The iterative solution graphs corresponding to the above three sets of results are shown in Figure 3.

(a) Iterative convergence diagram of the first optimization calculation set, (b) iterative convergence diagram of the second optimization calculation set, and (c) iterative convergence diagram of the third optimization calculation set.
By presenting the iteration curves (Figure 3), it can be observed that the PSO algorithm can converge stably and rapidly during the iteration process. This indicates that the model performs well during the optimization process, with stable parameter estimation, thereby verifying the stability assumption of the model.
Influence of factor levels on the degree of substitution
To thoroughly investigate the influence patterns of various process parameters and their interactions on the degree of substitution (DS) of xanthated cellulose fibers, a multidimensional visualization plot with the degree of substitution as the dependent variable is constructed based on the established multivariate nonlinear regression model and the optimized solution obtained (Figures 4 and 5).

(a) Influence of sodium hydroxide concentration and alkalinization time on the degree of substitution, (b) influence of carbon disulfide dosage and xanthation time on the degree of substitution, (c) influence of sodium hydroxide concentration and carbon disulfide dosage on the degree of substitution, and (d) influence of alkalinization time and carbon disulfide dosage on the degree of substitution.
From a top-down perspective, analysis of interaction effects: (a) interaction between sodium hydroxide concentration and carbon disulfide dosage on the degree of substitution, (b) interaction between sodium hydroxide concentration and xanthation time on the degree of substitution, (c) interaction between alkalinization time and xanthation time on the degree of substitution, and (d) interaction between carbon disulfide dosage and xanthation time on the degree of substitution.
Analysis of main effect trends
① The Central Role of CS2 Dosage (C):
As illustrated in Figure 4(c), with the alkalization time (B) and alkali dosage (A) held constant, the degree of substitution (DS) exhibits a marked increasing trend with rising CS2 dosage (C). This observation is entirely consistent with the result from the range analysis, where factor C demonstrates the largest range value (R = 0.381), thereby confirming CS2 as the most significant factor governing the degree of substitution. The underlying chemical mechanism resides in the fact that CS2, acting as the key reagent in the xanthation reaction, directly participates in the grafting reaction of the xanthate group (–OCSS⁻) onto the cellulose molecular chains.
② Synergistic Promotion by NaOH Concentration (A):
As depicted in Figure 4(d), under consistent conditions, increasing the NaOH concentration (A) exhibits a distinct promotive effect on the Degree of Substitution (DS), as indicated by the positive slope in the figure. Its range value (R = 0.340) ranks second only to that of CS2 dosage. Higher alkali concentrations (7%–9%) facilitate a more favorable reaction environment for CS2 by enhancing the swelling effect and activating the hydroxyl groups of the cellulose.
③ Marginal Effects of Time Parameters:
Alkalization time (B): As shown in Figure 4(a) and (b), prolonging the alkalization time exerts a limited enhancing effect on the Degree of Substitution (DS), as evidenced by the gentle slope of the curve. The relatively low range value (R = 0.167) suggests that within the reasonable duration (1–5 h), it is not a critical limiting factor.
Xanthation time (D): Figure 4(c) and (d) illustrate that as the xanthation time increases, the Degree of Substitution initially rises, then plateaus, and eventually declines. This trend may be attributed to the occurrence of adverse reactions under excessively prolonged xanthation conditions, which could hinder further improvement in the Degree of Substitution.
Analysis of interaction effects
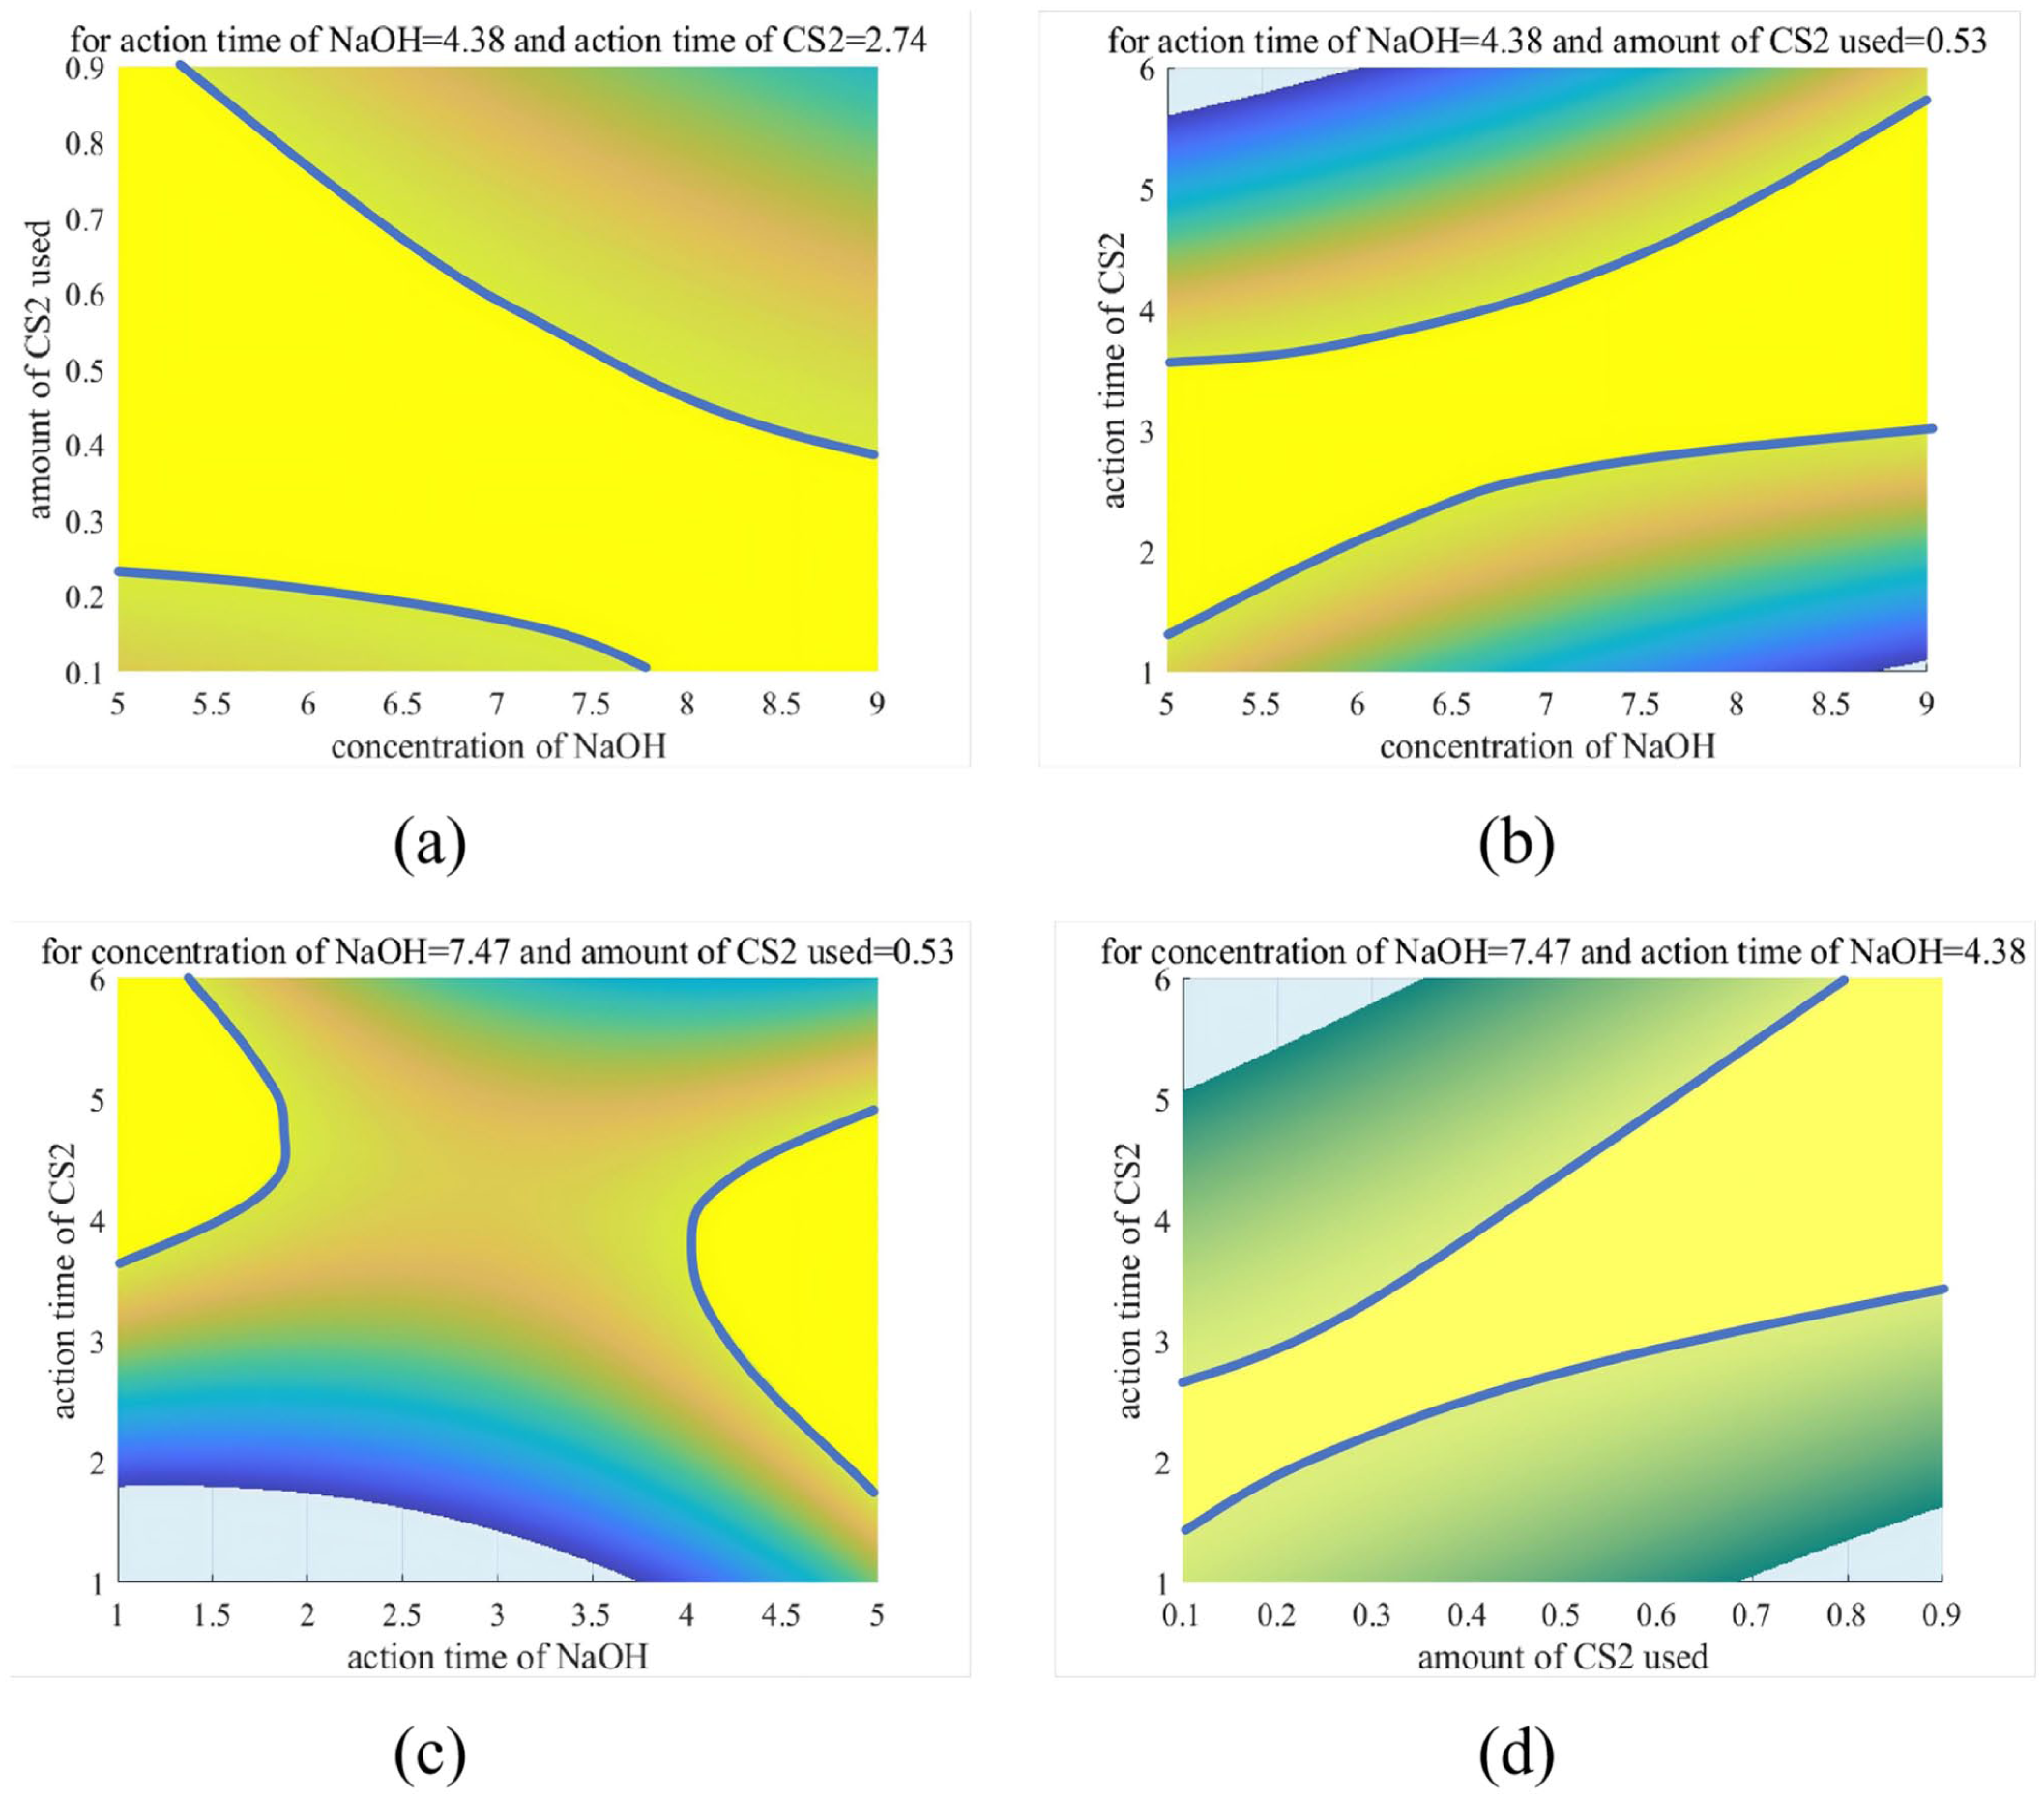
In Figure 5, the yellow region denotes areas where the Degree of Substitution (DS) exceeds 1. The thick blue solid line represents the DS = 1 contour, while regions in other colors indicate areas with DS values below 1.
① Material Interaction: Antagonistic Effect between NaOH and CS2 on DS (–0.21780A × C)
Figure 5(a) demonstrates that excessively high NaOH concentration combined with high CS2 dosage results in DS values below 1 (non-yellow region). This suggests that overly high reagent concentrations significantly enhance the hydrophilicity of the fiber, leading to a tendency toward dissolution. Therefore, in practical production, the ratio between A (NaOH concentration) and C (CS2 dosage) must be strictly controlled.
② Synergistic Interaction Between Alkali and Time: Positive Coupling of NaOH and Xanthation Time (+0.10970A × D)
Figure 5(b) shows a non-linear expansion of the yellow region (DS > 1), indicating that a high-alkali environment accelerates the xanthation reaction, thereby increasing the grafting amount per unit time. This result further demonstrates that extending the xanthation time under high alkali concentration produces a cumulative enhancing effect on the Degree of Substitution.
③ Temporal Antagonistic Effect: Trade-off Between Alkalinization and Xanthation Time (–0.10053B × D)
Figure 5(c) reveals that regions with DS > 1 (yellow zones) are predominantly located in the upper-left and lower-right corners of the plot. This phenomenon can be attributed to prolonged alkalinization causing structural degradation of the fiber, while extended xanthation time increases the risk of alkaline hydrolysis, leading to the loss of xanthated groups. The combination of both factors results in a noticeable decrease in the Degree of Substitution. Therefore, an optimal efficiency ratio likely exists between these time parameters, specifically at B = 4.38 h and D = 2.74 h.
④ Synergistic Interaction Between CS2 and Time: Efficiency Amplification by Key Reagent (+0.83795C × D)
Figure 5(d) shows that increasing both CS2 dosage and xanthation time leads to a noticeable expansion of the yellow region (DS > 1) without apparent saturation. This can be attributed to the fact that the fixed NaOH concentration and alkalization time pre-activate a substantial number of hydroxyl groups, providing abundant reactive sites for the subsequent xanthation reaction. Therefore, in practical production, when CS2 supply is limited, a significant extension of xanthation time (D) is required to compensate for the deficit (as observed in the steeply rising region on the left side of Figure 5(d)). Conversely, when CS2 is sufficient, the xanthation time (D) can be appropriately reduced depending on specific conditions.
The visualization analysis based on the regression model is in full agreement with the findings from the Orthogonal test (range analysis) and two-factor analysis of variance (ANOVA), further validating the scientific soundness and practical feasibility of the model.
Result characterization
Morphological structure analysis
Figure 6 visually illustrates the regulatory effects of three pretreatment conditions—namely, unyellowed alkalization, DS = 0.972 (approaching 1), and DS = 1.28—on the microstructure of cellulose. The results clearly reveal the correlation between the degree of substitution (DS) and the defibrillation potential of cellulose. When DS approaches 1 (Figure 6(b)), the electrostatic repulsion between xanthate groups facilitates effective separation of cellulose molecular chains, significantly weakening intermolecular interactions. 22 This creates a favorable structural foundation for subsequent defibrillation into micro/nanofibers. In contrast, when DS exceeds 1 (Figure 6(c)), the excessive introduction of xanthate groups leads to heightened hydrophilicity, resulting in a pronounced tendency toward dissolution during subsequent processing. The fiber surfaces become enveloped by dissolved molecular layers, which not only considerably reduces the yield of nanofibers but also compromises their structural integrity and core properties. Overall, a pretreatment condition with DS close to 1 optimally tailors the cellulose microstructure, striking the best balance between defibrillation efficiency and product quality.
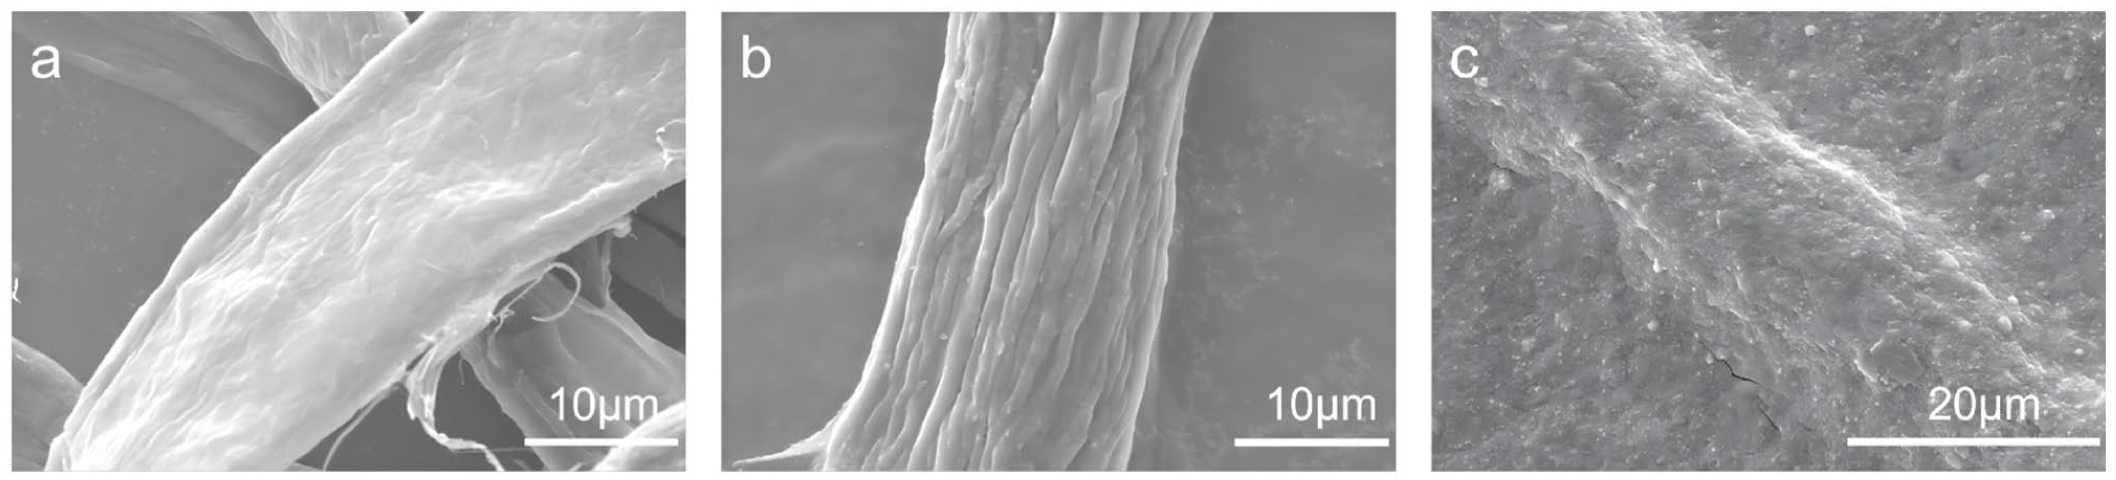
(a) Scanning electron micrograph of cellulose fibers that have not been xanthated, (b) scanning electron micrograph of xanthated cellulose fibers with a degree of substitution of 0.972, and (c) scanning electron micrograph of xanthated cellulose fibers with a degree of substitution of 1.28.
The xanthate fiber with a degree of substitution (DS) of 0.972, prepared through pretreatment-optimized process parameters, was subjected to ultrasonic defibrillation using a JY92-IIN ultrasonic cell disruptor (600 W, 30 min) manufactured by Shanghai Huxi Industrial Co., Ltd. As shown in Figure 7, the treated sample successfully yielded nanoscale fibers, with the measured average diameter of XCNFs as low as 20 nm. It was observed that the cellulose fibers were effectively dispersed during the defibrillation process, while morphological characterization confirmed the formation of nanostructured fibrous assemblies, thereby validating the efficacy of the xanthation treatment.

TEM images of dispersions prepared from XCNFs.
Chemical structure analysis
To characterize the chemical composition of xanthate cellulose nanofibers (XCNFs), the relevant results are shown in Figure 8. The blank control method was used for baseline correction, with pure water as the blank sample - since the dispersion medium of the XCNFs dispersion was distilled water, pure water was chosen to eliminate the interference of the solvent itself on the absorbance. The baseline scan was calibrated under the same test conditions as the target sample (scanning range 200–400 nm), and then the XCNFs and the sample after acid addition were subjected to spectral testing to ensure that the test results only reflected the absorption characteristics of the target substance. Spectral analysis revealed that the XCNFs dispersion exhibited a characteristic absorption peak of the xanthate group at 303 nm, with an absorbance quantitative value of 0.678. 23 When acetic acid was introduced into the dispersion, significant spectral changes were observed: the intensity of the characteristic peak at 303 nm decreased significantly, with the absorbance dropping to 0.098; conversely, the intensities of the absorption peaks at 206 and 226 nm increased significantly, with the absorbance rising to 7.48 and 2.77, respectively. These two peaks correspond to the acid hydrolysis products CS2 and Na2S. 24 This interplay of spectral changes is attributed to the addition of acetic acid inducing the acid hydrolysis reaction of the xanthate group, resulting in a reduction in the number of this group (manifested as the weakening of the 303 nm peak), while the generation of the decomposition products CS2 and Na2S increased (manifested as the strengthening of the 206 and 226 nm peaks). The changes in spectral features and absorbance values are interrelated and mutually confirmatory, providing more precise and powerful experimental evidence for the successful grafting of the xanthate group onto the surface of cellulose nanofibers.
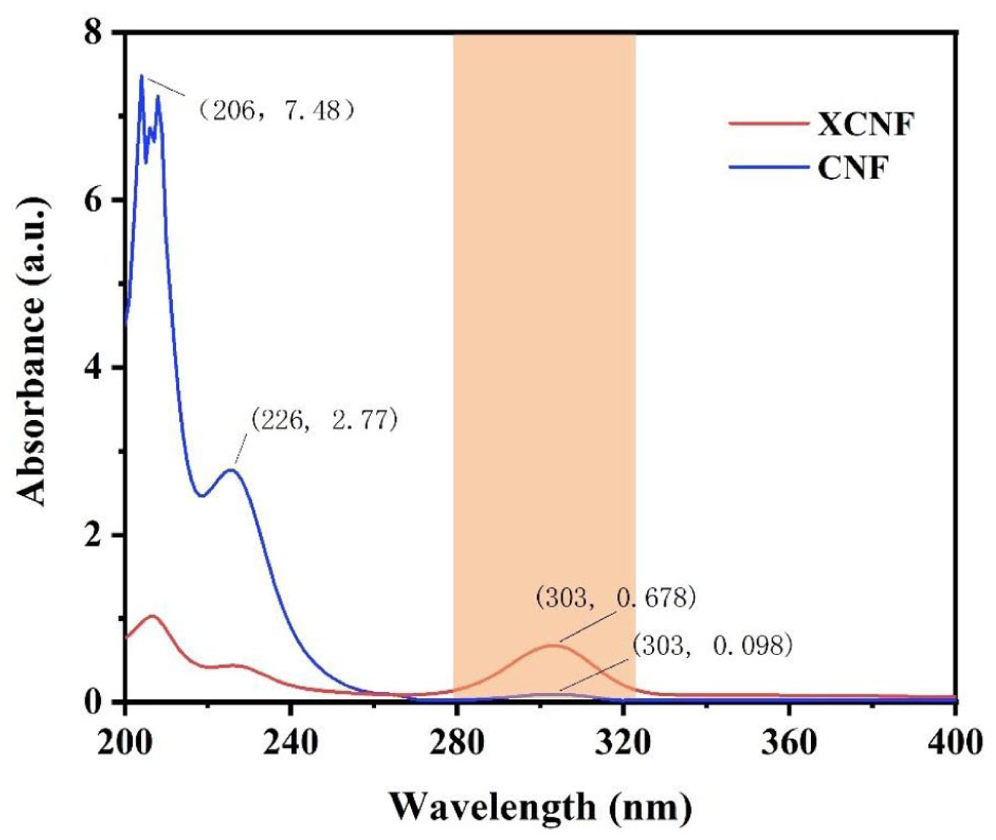
UV-Vis absorption spectra of XCNF and CNF.
Discussion on model limitations
Although the model developed in this study demonstrates high accuracy and reliability in predicting and interpreting the Degree of Substitution (DS), certain limitations in its practical application should be noted, warranting further investigation and refinement:
① Applicability Under Extreme Conditions:
This model is constructed based on experimental data covering four factors and their level combinations. However, under extreme conditions—such as using NaOH concentrations exceeding 10% (beyond the experimental range) or excessively prolonged alkalization time—severe structural degradation of cellulose may occur, preventing effective substitution of hydroxyl groups by xanthated groups. In such scenarios, the predictive capability of the model may be limited. Therefore, caution should be exercised when applying the model beyond the range of the experimental conditions, as prediction accuracy may be compromised.
② Analysis of Error Sources:
Experimental Errors: Unavoidable inaccuracies during the experimental process—such as weighing imprecisions and instability in reaction condition control—may introduce uncertainties that affect the accuracy of the model.
Complex Intervariable Relationships: Although the model accounts for four factors and their interactions, there may be higher-order terms (e.g. third-order effects of certain variables) that have not been fully identified or incorporated into the current model. Under specific conditions, these unmodeled third-order interactions could reduce the prediction accuracy of the Degree of Substitution.
In summary, the model developed in this study demonstrates a strong capability to predict and interpret trends in the Degree of Substitution (DS) within the studied experimental range, thereby providing a scientific basis for optimizing the substitution of xanthated groups. Nevertheless, certain limitations remain, particularly regarding its applicability under extreme conditions and potential sources of error, which warrant further investigation and refinement.
Summary and prospect
This study systematically elucidated the key factors and their interaction mechanisms that regulate the Degree of Substitution (DS) of xanthated cellulose fiber (y) through orthogonal test and statistical analysis. The orthogonal experimental results indicated that carbon disulfide (CS2) dosage exerted the most significant influence on the DS among the four factors, followed by NaOH concentration, identifying both as critical control variables. A regression model constructed from 29 sets of experimental data (R2 = 0.9214) successfully incorporated quadratic and interaction terms, with a prediction error (RMSE = 0.08812), demonstrating the model’s high accuracy. The high accuracy of the model. A mathematical optimization framework was established and solved using the particle swarm optimization algorithm, which yielded the following optimal process parameters: NaOH concentration 7.47%, alkalization time 4.38 h, CS2 dosage 0.53 mL, and xanthation time 2.74 h. Experimental validation under these conditions resulted in a DS value of 0.972, providing a reliable defibration pretreatment strategy for subsequent nanofiber production. The findings not only clarify the reaction mechanism of cellulose xanthation but also establish a mathematical optimization framework that can be extended to the regulation of DS in other cellulose derivatives, thereby establishing a foundation for the efficient preparation of cellulose nanofibers.
Nevertheless, as shown in Figure 2 above, the model still exhibits room for improvement in fitting accuracy within certain regions. In future studies, the model structure could be further optimized or the sample size increased to enhance its predictive accuracy and stability.
Currently, the characterization of xanthated groups primarily relies on ultraviolet spectral detection, while other methods yield comparatively less distinct results. Future research should further explore the potential applications of xanthated cellulose fibers in other fields, such as wastewater treatment and biomedical materials, and develop more efficient and green preparation processes. Moreover, this methodological framework can be extended to optimize process parameters in the preparation of other materials, demonstrating broad applicability and general value.
Footnotes
Declaration of conflicting interests
The authors declared no potential conflicts of interest with respect to the research, authorship, and/or publication of this article.
Funding
The authors disclosed receipt of the following financial support for the research, authorship, and/or publication of this article: This research was funded by the National Natural Science Foundation of China “Spinning Assembly of Aramid Nanofibersand Hydrogen Bond Network of Aerogel Fiber Structure” (ID: 52273059).