
Abstract
This paper studies the physical and mechanical performance of three main architectures used in 3D woven composites, focusing on their tensile, flexural, and short-beam strength properties. The primary goal of this paper was to investigate the physical and mechanical effects of three different weave architectures, Layer-to-Layer (LL), Angled Interlock (AI), and Orthogonal (ORTH), using a consistent loom set-up. This approach aims to facilitate the seamless manufacture of transitions between weave architectures within a single perform, allowing for tailored properties to meet the requirements of specific applications by evaluating each architecture in warp and weft directions. The results indicate that the AI and ORTH architectures have better tensile properties than the LL architecture in the warp direction, highlighting the importance of warp stuffers in improving tensile strength. On the other hand, the LL architecture showed superior tensile and flexural properties in the weft direction due to 11% and 17% higher directional fibre content compared to AI and ORTH. Additionally, the AI architecture exhibited improved short beam strength in the warp direction due to the angled warp binder tows. This study emphasises how the distribution of resin-rich regions and fibre architecture can influence mechanical properties, with specific architectures providing advantages in different loading conditions. Furthermore, by ensuring a consistent loom set-up across all architectures, this work presents a novel approach to manufacturing 3D woven composites, offering enhanced design flexibility and streamlined fabrication processes.
Keywords
Introduction
Composites play a vital role in advanced engineering applications, as engineers can tailor them to meet specific performance requirements, which is a crucial advantage. 1 These applications span diverse fields, including aerospace, automotive, wind energy and marine engineering, where composites optimise structural integrity, reduce weight, and enhance overall performance.2 –4 2D composites are widely utilised because they modify the mechanical properties of components. By altering the material, fibre orientation, stacking sequence, and resin content, designers could selectively enhance specific regions of a 2D composite component to create desired characteristics, such as increased stiffness, strength, or flexibility.5 –7 As a result, 2D composites are especially useful in situations that call for decreased weight or improved directional strength within a particular application. However, 2D composites are excellent at customising in-plane features but lack out-of-plane reinforcement. 8 3D woven composites have emerged as a significant evolution in composite technology, offering superior out-of-plane reinforcement compared to their 2D counterparts.9,10 Unlike 2D composites, limited by their layered construction, 3D woven composites incorporate z-binder yarns interlacing through multiple layers, providing enhanced delamination, impact, and improved mechanical properties in multiple directions.11 –13 The internal fibre architecture of 3D woven composites is critical in determining their microstructural, physical, and mechanical properties. The interlacing pattern of the z-binder yarns gives rise to three primary and widely adopted weaving architectures: layer-to-layer (LL), angle interlock (AI), and orthogonal (ORTH).
In classifying 3D woven composites, prior literature has recognised four distinct structural types: angle interlock layer by layer, angle interlock throughout the thickness, orthogonal layer by layer, and orthogonal throughout the thickness.14,15 However, many studies, including Ralph et al., 13 have adopted a more generalised three-category framework—layer-to-layer, angle interlock, and orthogonal—to streamline classification while maintaining precise accuracy. This approach is based on the structural characteristics of 3D woven composites, focusing on (i) the path and continuity of z-binder yarns, (ii) the interaction between the primary yarn systems—warp, weft, and binder—and (iii) the influence of these features on the overall architecture. The classification distinguishes three types of structures based on binder yarn configuration: LL structures use binder yarns to connect adjacent layers through localised interlacing; AI weaves feature binder yarns that follow diagonal paths across multiple layers; and ORTH architectures contain vertically oriented binder yarns that span the entire thickness of the preform. This binder-based criterion reflects functional aspects of fibre continuity, interlaminar reinforcement, and load path control—key factors in architectural design. As such, the classification supports design decision-making by linking binder orientation directly to expected mechanical performance, such as shear resistance or out-of-plane strength. 16 Unlike methods based on loom operation or layer sequencing, this framework prioritises structural features related to performance, aligning with core weaving principles: interlacement, continuity, and directional control. The three-class system used here corresponds with established methodologies and facilitates direct comparison with prior work at Ulster University.
Most research on 3D woven composites has concentrated on these uniform structures, focusing on their fundamental properties and potential applications.16,17 The mechanical properties of 3D woven composites are intrinsically linked to their architectural configurations, owing to variations in fibre alignment, crimp, and the density of z-binding yarns. Saleh and Soutis 18 and Saleh et al. 19 have demonstrated that the ORTH architecture exhibits superior tensile performance, attributed to its smaller unit cell size and higher z-binder frequency. These features facilitate improved stress redistribution, enhanced damage tolerance, and greater failure strain and strength compared to LL and AI structures, which are more prone to reductions in in-plane properties caused by increased fibre crimp. A common hypothesis from research is that the improved tensile performance is directly related to the reduction of in-plane fibre waviness, which is affected by the through-thickness architecture.20,21 The influence of weave architecture on the flexural behaviour of 3D woven composites has been widely studied.22 –24 Through-thickness reinforcement, such as binder yarns, enhances delamination resistance, and improves structural integrity under flexural loading. Liu et al. 25 found that angle-interlock composites exhibited higher flexural strength due to better load transfer and crack deflection mechanisms. Similarly, Jin et al. 26 reported that orthogonal woven composites showed improved energy absorption and reduced interlaminar shear failure compared to layer-to-layer weaves, which are more susceptible to debonding. Interlocking architectures in 3D woven composites enhance shear strength by improving stress distribution across fabric layers. 27 The arrangement of binder yarns provides additional reinforcement, maintaining structural integrity under shear loading. Warp and weft interactions affect crack propagation, with tightly bound architectures resisting shear-induced delamination more effectively, ensuring higher shear strength and improved damage tolerance.
Despite these advantages, there is limited understanding of how architectural variations within a single perform influence mechanical performance. Strategically modifying the weave structure could enable the fabrication of non-uniform architectures within a single preform, allowing for the precise tailoring of mechanical properties. This approach can potentially enhance stiffness, strength, and load distribution in targeted regions, optimising performance for specific applications. 28 Maintaining a constant loom set-up while producing different 3D woven architectures simplifies manufacturing, reduces set-up time and costs, and enables seamless transitions between architectures. However, further research is needed to optimise these transitions, allowing engineers to tailor performance in key areas within the preform.
This paper examines the mechanical properties of the three primary types of 3D woven structures—layer-to-layer, angle interlock, and orthogonal—with a focus on how the weaving architecture, particularly the interlacement of z-binder yarns, influences both the manufacturing process and the resulting composite characteristics. We isolate the effect of the weave structure by keeping critical variables such as reed size and the number of tows per dent constant. This approach facilitates the manufacture of non-uniform architectures within a single preform and provides valuable insights into the relationship between weaving architecture and composite performance.
Materials and manufacture
Fibre and resin system
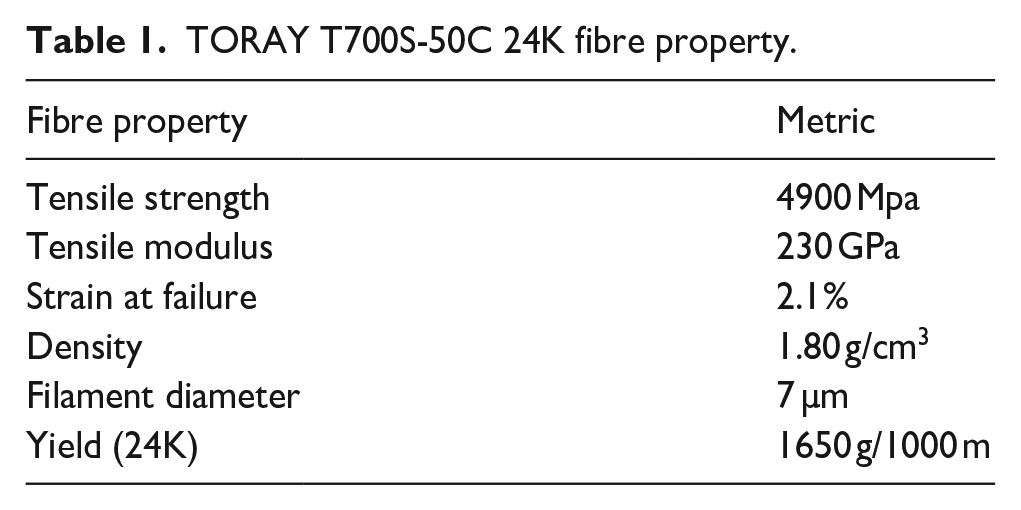
Table 1 describes TORAY T700S-50C 24K 21 carbon fibre yarn with Sizing Type 5 to manufacture the 3D woven preforms. The Sizing Type 5 indicates resin system compatibility, meaning the fibre is suitable for use with Epoxy, Phenolic, Polyester, and Vinyl Ester resins. The C designation refers to the sizing amount, representing 1.0% of the applied sizing. This selection ensures optimal adhesion between the fibre and resin while providing sufficient protection during 3D weaving. This study employed PRIME™ 37 29 infusion grade epoxy resin with Ampreg 3X slow hardener, mixed at a ratio of 100:29 by weight.
TORAY T700S-50C 24K fibre property.
3D fabric architecture
Figure 1 presents the ScotWeave 3D models of the three primary 3D woven architectures: layer-to-layer (LL), angled interlock (AI), and orthogonal (ORTH). The architectural structures were designed using ScotWeave software, ensuring precise warp and weft arrangements before fabrication. The blue lines depict binder yarns, the red lines represent warp stuffer yarns, and the pale yellow lines represent weft yarns, which run perpendicular to the warp yarns. The woven preforms were manufactured using a PROWEAVE-controlled Dobby Weaverbird loom at Ulster University, with the lift plans shown in Figure 2. The bottom columns (numbered 1–12) correspond to the 12 shafts on the loom, while the rows represent individual weft insertions during the weaving process. A coloured square indicates the corresponding shaft lifted, while a blank square signifies that the shaft remains lowered, creating the shed formation necessary for the weave architecture. Although the loom incorporated manual reed movement and a manual take-up system, these were not used to control weft density. Instead, weft density varied as a natural outcome of the different 3D woven architectures, while all other weaving parameters were held constant. The loom configures to maintain a constant warp density of 9 warp stuffers/binders per centimetre, dictated by a reed size of 3 dents per cm; therefore, in each dent, three warp tows are inserted, shown in Table 2.

Diagrams of the different fibre architectures layer to layer (a), angled interlock (b) and orthogonal (c).
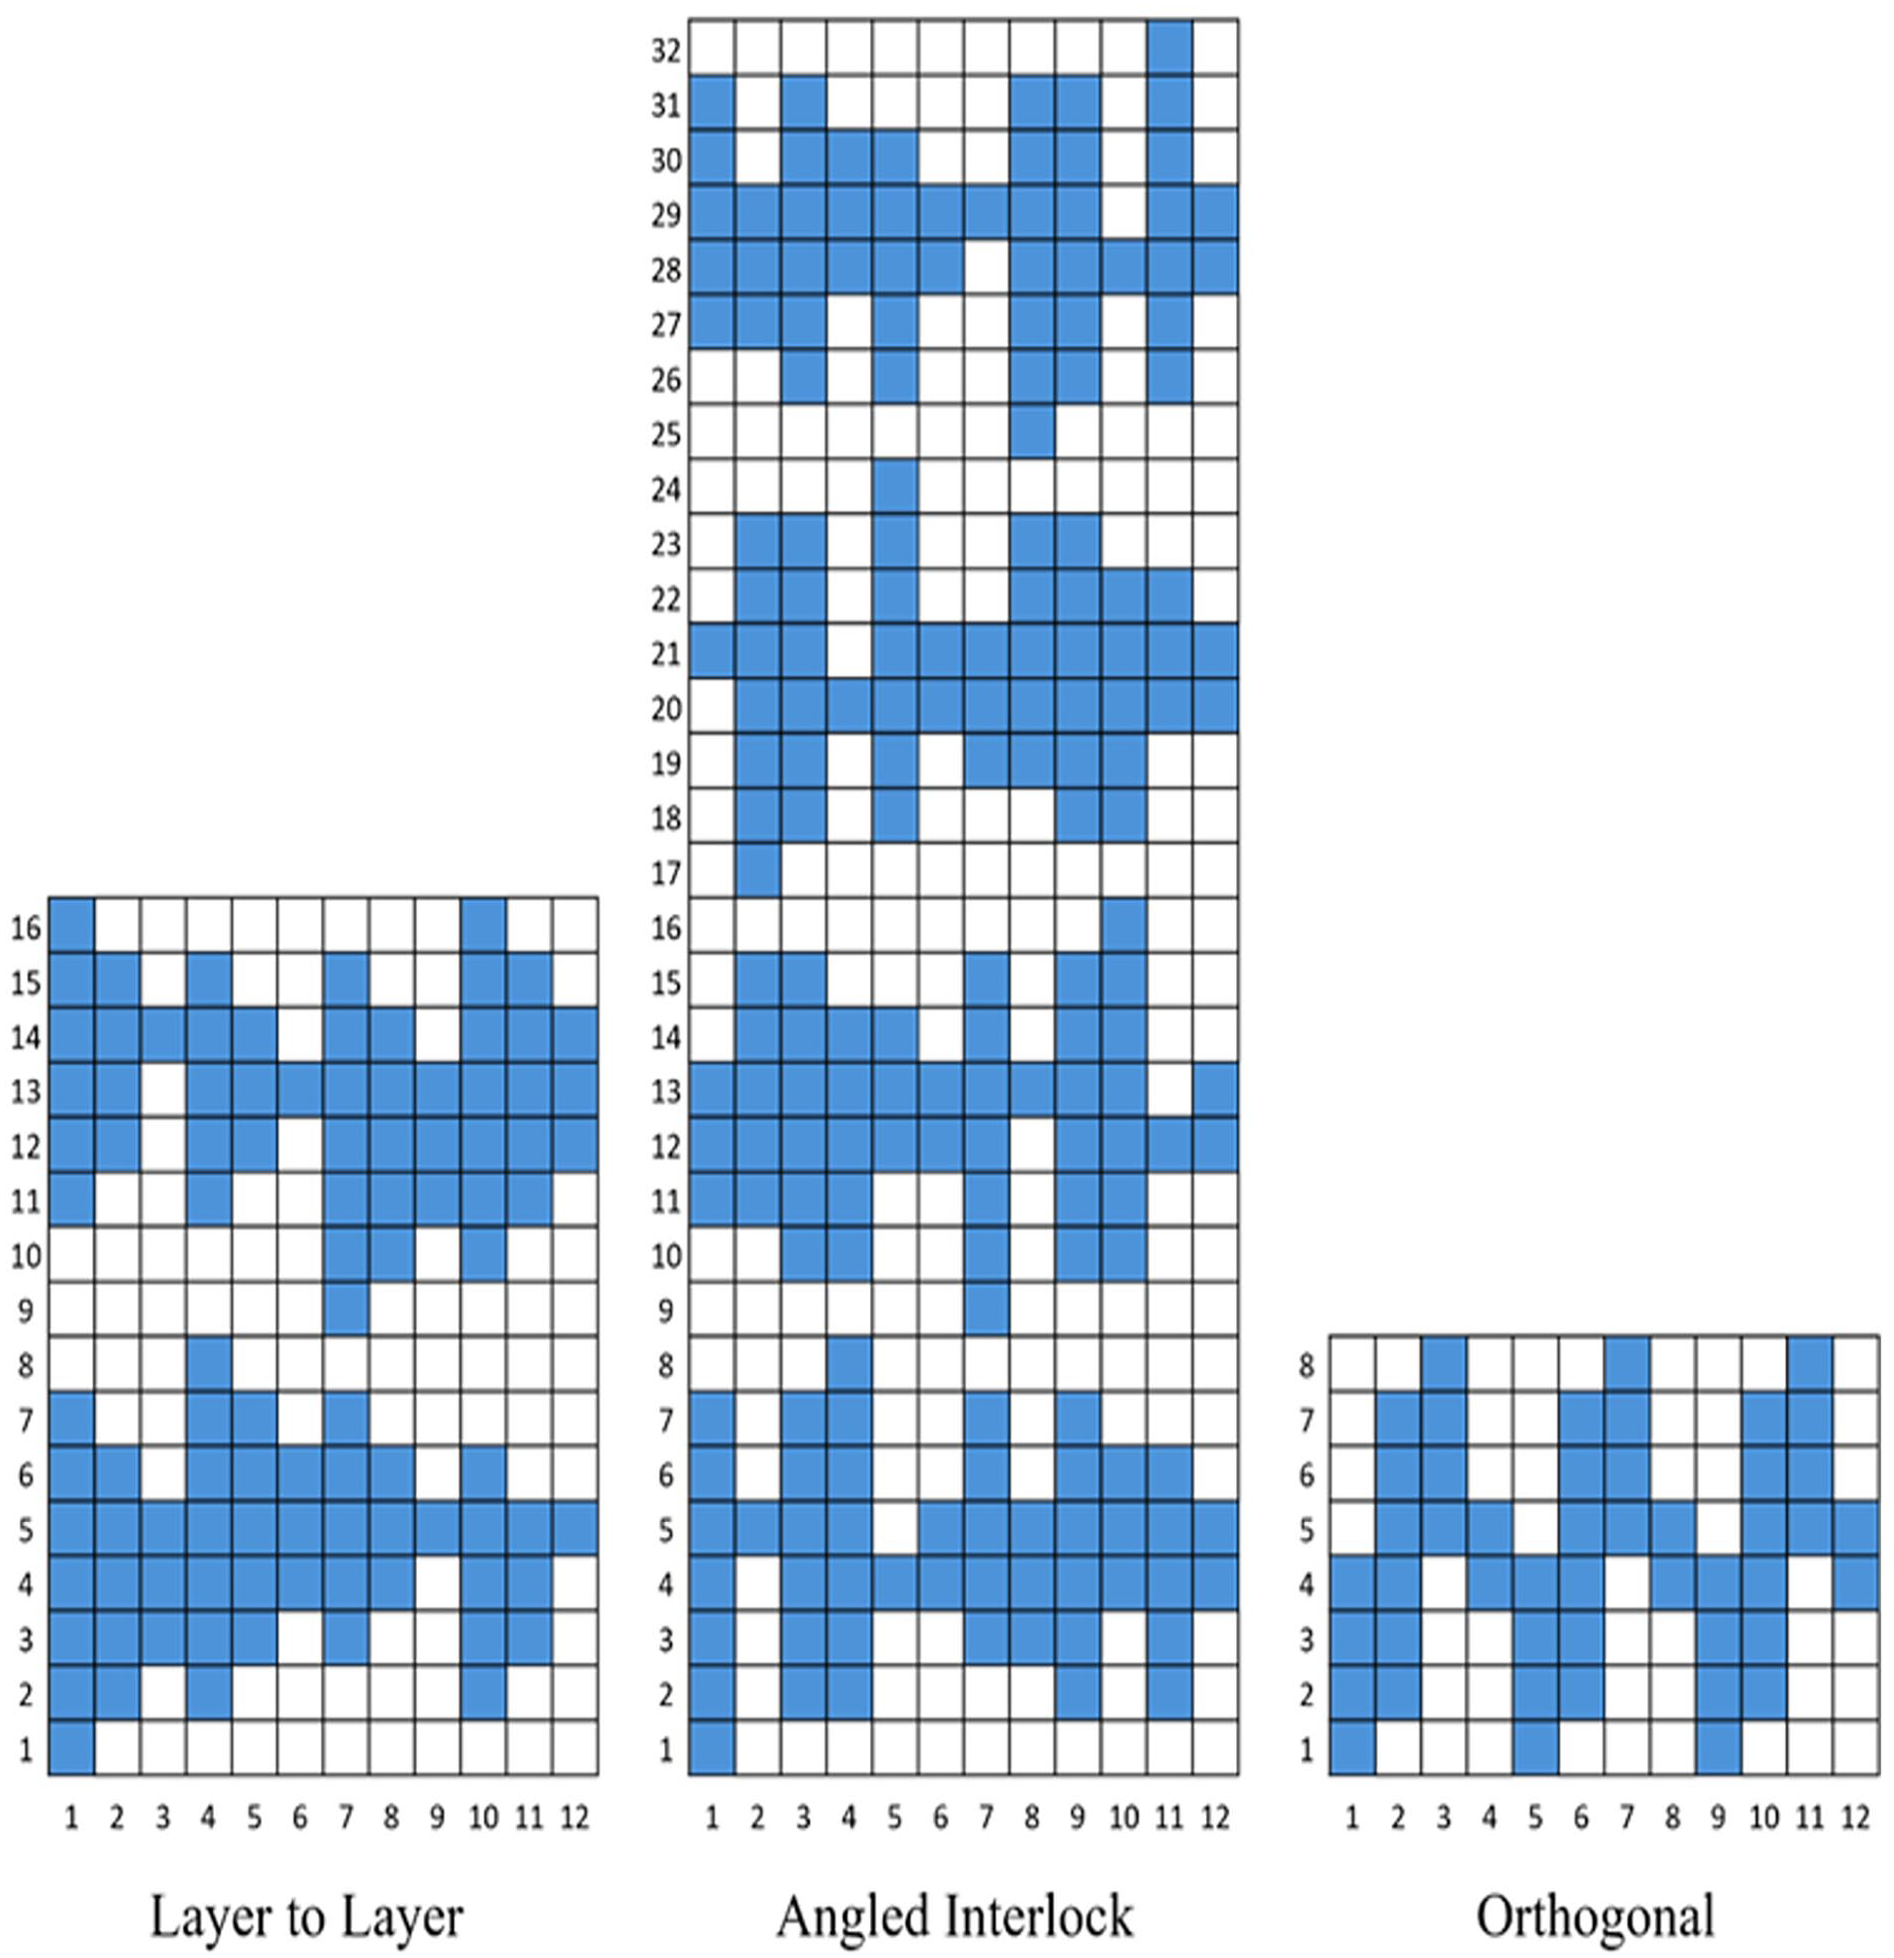
Lift plan for the three architectures layer to layer, angled interlock and orthogonal for an automated dobby ProWeave controlled loom.
Key structural parameters of 3D woven preforms.
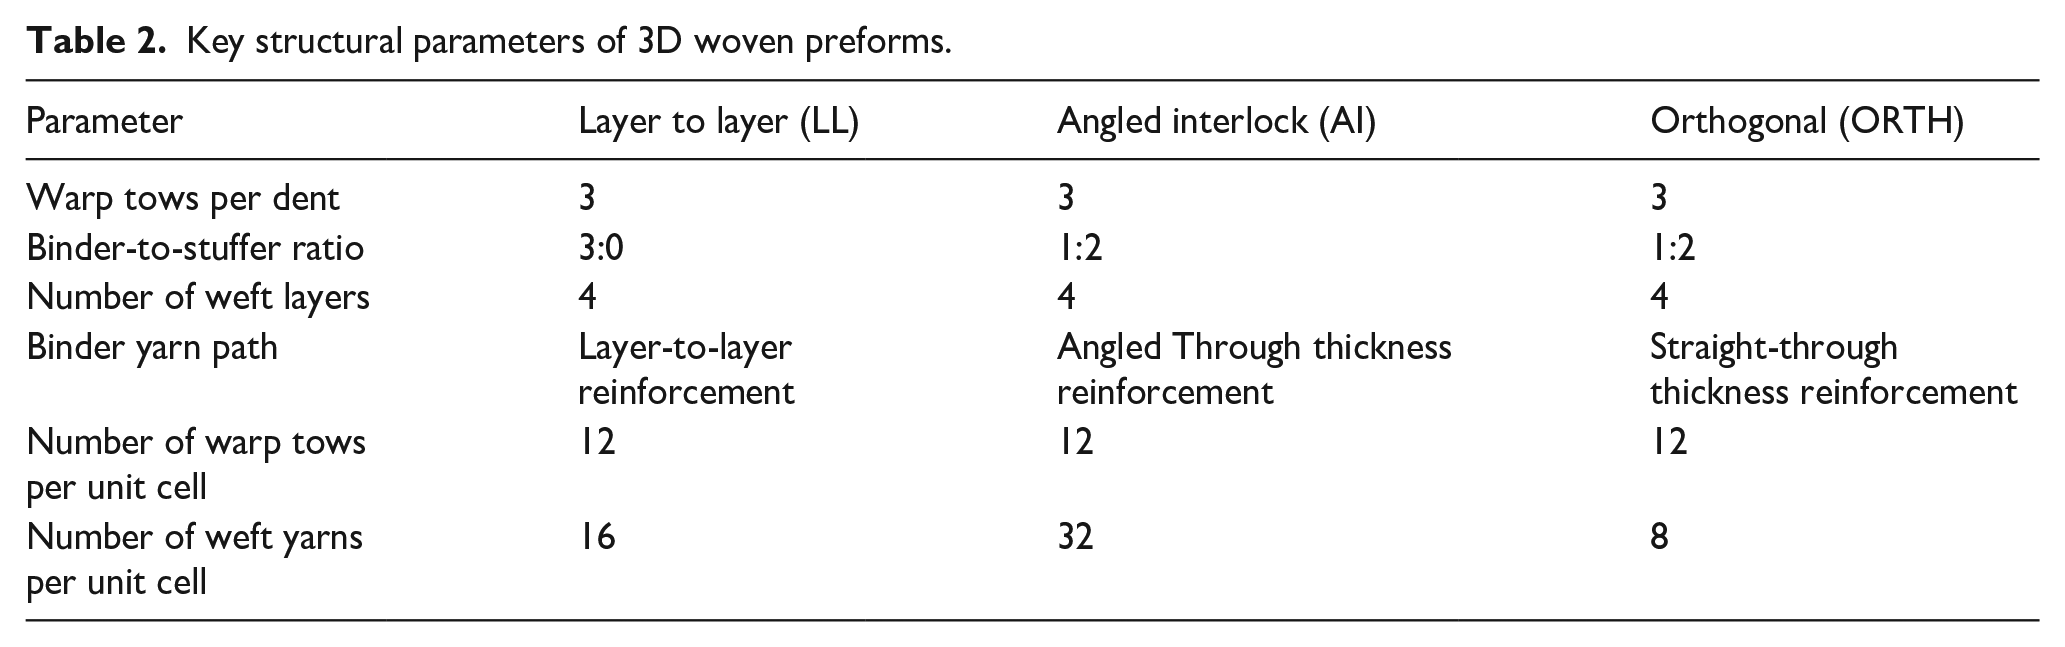
The LL architecture consists of a unit cell composed of four groups of warp tows, with each group containing three warp tows, all of which function as binder yarns. This configuration is necessary to ensure a fully repeating architecture, where binder yarns pass under a single weft yarn, interlace with a weft yarn from the adjacent lower layer, and return to the top surface of the structure. This interlacement pattern results in three weft yarns separating successive binder interlacements within the same dent, requiring each binder group to be laterally offset by one position to the right to complete the entire sequence. As a result, four groups of warp tows are required to form a complete repeating LL unit cell. In contrast, the AI and ORTH architectures follow a different binding structure, where only one of the three warp tows per dent serves as a binder yarn, while the remaining two act as warp stuffer yarns, increasing directional fibre volume fraction in the composite. In both architectures, binder yarns traverse the entire thickness of the preform, interlocking the layers and ensuring structural integrity. The primary distinction between AI and ORTH lies in binder yarn orientation and unit cell size. In ORTH, binder yarns travel vertically (perpendicular to the fabric plane), producing straight-through thickness reinforcement. In AI, binder yarns are angled through the thickness compared to ORTH. Another key structural difference is the unit cell repetition pattern. The ORTH architecture requires only two unique warp tow groups to form a complete unit cell, as the first and third groups and the second and fourth groups are identical.
A limitation in the current ORTH configuration, illustrated in Figure 3, is the lack of warp stuffer yarns between the second and third weft layers in the unit cell. This configuration results from using a consistent loom set-up with a uniform 12-warp repeat across all architectures. Consequently, the weft yarns in this region are unsupported within the unit cell and can shift during manufacturing when subjected to compaction pressure. Highlighting a trade-off between architectural idealisation and practical manufacturability, potentially introducing minor local variability in fibre alignment or nesting within the composite.

Internal architecture of 3D woven composites, LL, AI, and ORTH, section parallel to binder direction (warp).
In contrast, the AI unit cell is more significant due to the angled nature of the binder yarns, which traverse multiple layers in a diagonal path. This configuration requires four distinct warp groups similar to the LL architecture to complete the repeat sequence. These differences in unit cell geometry and yarn path orientation contribute to variations in the physical properties of the 3D woven preforms, as summarised in Table 3. Figure 3 presents cross-sectional micrographs of the LL, AI, and ORTH woven architectures, revealing the internal yarn arrangements and structural differences between the three configurations. These images provide insight into the distribution of warp binder, warp stuffer, and weft yarns, highlighting the fundamental distinctions between interlacement and layer connectivity.
Table showing the variation in perform parameters between specimen architectures.

Composite manufacture
We manufactured 500 mm × 500 mm composite plaques using a flat panel tool via vacuum-assisted resin transfer moulding (VaRTM). After mixing, we degassed the resin and injected it into the tool at 30°C and 1 bar positive pressure using a Ciject 3.0 injection machine. Once infused, the panel cured at 50°C for 16 h. We produced one panel for each architecture.
Porosity
Porosity in composite laminates is a critical parameter influencing mechanical properties, particularly in fibre-reinforced composites manufactured by VaRTM. In this study, optical microscopy examined cross-sections of the fabricated composite panels, and no visible porosity was detected. This suggests that the manufacturing process resulted in a well-impregnated laminate with minimal void content. Although we did not conduct direct quantitative porosity measurements, previous studies offer insights into the expected porosity range for VaRTM composites. Gurit 30 explored void formation in VaRTM composites. They reported that void content typically ranges from 0.5% to 3%, depending on factors such as fibre architecture, resin flow characteristics, and process control. Given that the fabrication conditions used in this study align with those reported in the literature, it is reasonable to assume that the porosity in our composite panels falls within the 0.5%–3% range.
Experimental testing
Tensile
Each specimen was precisely cut to a length of 250 mm and a width of 25 mm, with a designated gauge length of 150 mm used for strain measurements. Glass fibre reinforcement tabs (measuring 25 mm × 50 mm × 2 mm) were bonded to the specimen ends to ensure effective load transfer and prevent premature failure at the grips. Before bonding, we gently abraded the composite surfaces using fine-grit abrasive paper and then cleaned them with isopropyl alcohol to remove contaminants and optimise adhesion. The tabs were affixed using a 1:1 mixture of Araldite Ultra Strong epoxy, which was allowed to cure fully under controlled ambient conditions. This careful preparation helps to ensure uniform stress distribution along the gauge length during testing.
Tensile testing was conducted to ASTM 3039 31 using a Zwick Z100 universal testing machine with a 100 kN load cell and hydraulic grips. Testing was conducted on five specimens in longitudinal and transverse orientations to evaluate directional mechanical properties. The machine’s crosshead displacement rate was consistently maintained at 2 mm/min, ensuring a controlled and repeatable loading condition. The strain was measured using an MTS Biaxial clip-on extensometer mounted on each specimen along the gauge length before testing. The extensometer provided high-accuracy strain readings, which we removed once the specimen reached 0.6% strain to avoid damage during sample rupture.
Digital image correlation (DIC)
A 2D Digital Image Correlation (DIC) system evaluated strain distributions on composite specimens. A high-resolution camera (E-lite 5M) was positioned 900 mm perpendicular to the specimen surface and operated under controlled lighting conditions to ensure uniform illumination and minimise shadows. Calibrating the set-up using a standard calibration target confirms the system’s accuracy and repeatability. To achieve optimal contrast, a random speckle pattern was applied to the specimens with black spray paint for the background and white spray paint for the speckles. The speckle size matched the camera’s resolution to ensure accurate sub-pixel displacement measurements. Images were captured at four frames per second and synchronised with the mechanical loading data from the testing machine, ensuring a direct correlation between the applied load and measured strain. The acquired images were processed with La Vision DIC software to derive full-field displacement and strain maps. The resulting strain fields were analysed to identify strain concentrations, assess deformation uniformity, and locate regions prone to failure, providing comprehensive insight into the composite’s behaviour under load.
Flexural
Flexural properties were obtained using a three-point bending test adhering to the ASTM D7264 standard. 32 An Instron 5500R electromechanical testing machine equipped with a 100 kN load cell was used for testing. Five specimens were prepared for each test direction, with dimensions selected to maintain a span-to-thickness ratio of 32:1, ensuring compliance with the standard and reliable measurement of flexural properties. The overall specimen length was set 20% longer than the span length to provide adequate grip area and minimise stress concentrations at the supports. Testing occurred under ambient laboratory conditions, with the crosshead displacement rate controlled at 1 mm/min.
Short beam shear
The interlaminar shear strength of composite materials was evaluated using a short-beam shear test per ASTM D2344. 33 An Instron 5500R testing machine with a 100 kN load cell captured the shear response. Specimens were prepared to the standard’s dimensions: six times their thickness for length and twice their thickness for width. A three-point bending set-up applied a 1 mm/min crosshead displacement rate. The test fixture featured a loading nose (6.00 ± 0.50 mm) and support rollers (3.00 ± 0.50 mm), ensuring consistent contact. Five specimens were tested in warp and weft orientations to assess directional performance. The load-displacement data calculated the interlaminar shear strength, revealing the composite’s resistance to delamination under shear loading.
Fibre volume fraction
The composite panels’ fibre volume fraction (

Where
Crimp percentage
The average binder crimp was determined using optical microscopy, where cross-sectional images of the composite were analysed to quantify fibre crimp. The measurement process involved determining the straight-line distance (

Results and discussion
Tensile testing
Representative tensile stress-strain curves for the baseline 3D woven architectures until failure are shown in Figure 4 for both warp and weft directions. The specimens are categorised into three types: Layer-to-Layer (LL), Angled Interlock (AI), and Orthogonal (ORTH).

Typical stress versus strain curve for LL, AI and ORTH: (a) in the warp (0°), and (b) weft (90°) directions under tensile loading.
All composite architectures exhibited linear behaviour at the start of loading, but they all transitioned into non-linear zones at various stages of tensile loading. It is evident from these curves that the binder weave architectures significantly affect the tensile performance in both the warp and weft directions. In the warp direction, the LL, AI, and ORTH specimens exhibit an initial linear region up to 0.4%, 0.78%, and 0.64% strain before transitioning to non-linear behaviour. The LL sample reaches this transition point earlier due to the straightening effect of the binder yarns, which is more pronounced in this specimen because it lacks warp stuffers. 35
In the weft direction, the non-linear LL, AI, and ORTH regions start at 0.48%, 0.65%, and 0.62%, respectively. The non-linear region in the graphs indicates an increase in matrix cracking around the carbon tows. 20 The non-linear region is more significant in the weft specimens than the warp specimens, implying that the number of matrix microcracks is significantly higher in the weft samples. However, the LL sample indicates that matrix cracking is more dominant in the warp direction than the weft, as the stiffness decreases non-linearly with an increasing crimp. 19
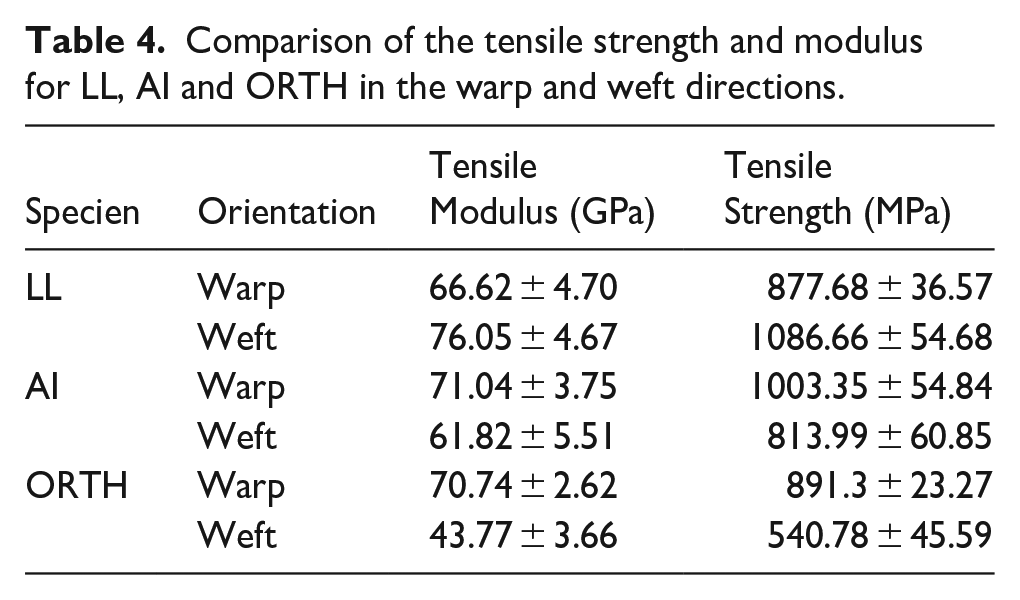
Table 4 and Figure 5 compare the tensile properties of LL, AI, and ORTH specimens, including tensile modulus and strength, in the warp and weft orientations. The results show that the AI specimens exhibit an 18% increase in tensile modulus and a 14% increase in tensile strength compared to the LL architecture. Similarly, the ORTH specimens demonstrate a 17% increase in tensile modulus and a 2% increase in tensile strength over the LL specimens. A one-way ANOVA analysis was conducted to determine if the differences in tensile modulus across the architectures in the warp direction were statistically significant. The ANOVA returned a p-value of 0.162, indicating that the mean modulus values are not statistically significant at the alpha level of 0.05. This outcome is expected, as all the architectures have a similar number of warps per centimetre woven with the same reed size. Additionally, the tensile modulus was calculated between 0.1% and 0.3% strain according to ASTM D3029 standards, with no matrix cracking observed before 0.4% strain.
Comparison of the tensile strength and modulus for LL, AI and ORTH in the warp and weft directions.

Comparison of the tensile strength and modulus in LL, AI and ORTH specimens.
The results also show the effect of both the warp stuffers and binder crimp; when comparing the AI and ORTH architectures, which both contain the same number of warp stuffers and binders, the decrease of 11.17% in tensile strength is due to higher levels of crimp shown in the ORTH architecture. 24 A similar trend would have been expected between the LL samples, which have been shown to exhibit the lowest crimp (Table 3). However, this is not the case, suggesting that the warp stuffers influence the composite’s tensile strength, as the LL structure exhibits the lowest tensile strength. Li et al. investigated the effect of warp stuffers in 3D woven composites, concluding that samples with a greater number of stuffer yarns exhibited higher tensile modulus and strength in the warp direction compared to specimens with fewer stuffers. 36 However, other studies suggest that this relationship is not always linear, as an excessive number of warp stuffers can introduce higher fibre crimp, leading to increased waviness and stress concentrations, which may reduce in-plane mechanical performance.20,37 Additionally, resin-rich regions formed due to binder yarn distribution and stuffer density can further influence the overall tensile response.
The LL architecture demonstrates the highest tensile properties in the weft orientation, serving as the baseline. In comparison, the AI configuration shows a decrease of 19% in tensile modulus and 25% in tensile strength. The ORTH configuration experiences a more significant reduction, with a 42% decrease in tensile modulus and a 50% decrease in tensile strength compared to the LL architecture. The reduced tensile performance in the 3D samples, particularly in the AI and ORTH configurations, can be attributed to the lower yarn density in the weft direction. The LL architecture possesses the highest yarn density, followed by the AI and ORTH configurations, a trend reflected in the tensile results. Although reduced tow waviness and misalignment generally enhance tensile performance, this trend is not observed in the ORTH samples, which exhibited the lowest misalignment. This suggests fibre content is more critical in determining tensile performance than tow alignment. Additionally, differences in fibre content and load-bearing efficiency can explain the reversal of the stress-strain graphs in the warp and weft directions across all architectures. The weft direction, which has a higher fibre volume fraction, displays superior tensile properties. In contrast, the warp direction, with fewer load-bearing fibres and greater crimp, leads to lower tensile performance, underscoring the dominant role of fibre distribution in governing tensile behaviour.
Digital image correlation (DIC) analysis of tensile test data
All specimens exhibit a pronounced increase in strain at the edges in the warp and weft directions, a phenomenon known as the free-edge effect. 38 The intricate three-dimensional interlacing of fibres in 3D woven composites results in varied mechanical interactions within the material, especially along its boundaries (Figure 6). Under tensile loading, the disruption of fibre continuity at the edges leads to significant stress and strain concentrations, contrasting with the more homogeneous unit cell regions at the centre. Moreover, the interlaminar bonding in these edge regions is intrinsically weaker due to the discontinuity of fibre weaves, making the material susceptible to delamination and fibre pull-out under mechanical stresses 38 .

Full-field strain Eyy (%) distribution for 3D woven composites under tensile loading: (a) layer-to-layer, (b) angled interlock, and (c) orthogonal architectures, with (1) showing the warp direction and (2) the weft direction. The left images show the top view, highlighting key structural features, while the right images present DIC strain maps, comparing strain distribution across architectures.
The strain distribution in the warp and weft specimens reveals areas of elevated strain at the Z-crown intersections on the sample surface. These intersections denote points where fibres from different layers intersect or overlap with the yarns. Such areas are ‘hot spots’ of strain, indicating localised deformation. Interestingly, higher strain hot spots are evident in the warp specimens compared to the weft direction. This disparity is reflected in the lower strain failure rate of 1.94% in the warp samples, contrasting with the 1.84% observed in the weft specimens for the LL architecture.
The LL architecture shows the highest strain to failure among the warp samples, as can be seen in the DIC strain mapping due to the architecture only containing warp binder yarns, as the binder yarns tend to introduce stress concentrations within the preform. 39 Consequently, when the 3D woven specimens undergo tensile loading, the Z yarns are stress focal points, initiating damage. Therefore, the LL has the highest number of binder interlacement points among the three architectures, which explains the higher strain connections shown in the DIC data.
The LL architecture exhibits a diagonal strain pattern in the warp direction, whereas the AI and ORTH specimens show a transverse strain distribution. The incorporation of warp stuffers likely causes this variation, as they decrease strain in the warp direction, resulting in a predominantly transverse strain pattern. Another explanation is the formation of resin channels resulting from the spacing between the warp or weft yarns in the LL sample, which features the highest density of warp and weft yarns per centimetre. Consequently, minimal resin channels are formed between the weft yarns, causing the strain distribution to follow the path of the binder yarns diagonally. However, in the AI and ORTH structures, the number of weft yarns per centimetre is lower, causing resin channels to form between the weft yarns and the strain to be transverse across the sample.
The LL and AI demonstrate diagonal strain distributions similar to the weft direction. However, the ORTH architecture continues to exhibit a similar transverse strain pattern. Resin-rich areas cause the transverse strain pattern due to the particular architecture. This diagonal strain pattern can be attributed to the ‘Z crown effect’ as the binder yarns traverse over other yarns; they create resin-rich areas susceptible to initial matrix cracking, leading to strain concentrations around the binder yarns.
After tensile testing of the composite samples, failure was observed primarily in the mid-span region of all samples, characterised by a transverse crack initiating near the edge. In the LL sample, the failure pattern indicated significant matrix cracking and fibre breakage. Microscopic examination revealed extensive fibre pull-out and matrix cracking, indicating that the crack propagated along the fibre-matrix interface before causing catastrophic failure. Figure 7 shows the progression of cracks from the damaged area on the right, following the binder yarn interface.

Side view of warp tensile failure (0°) in LL, AI and ORTH specimens.
An examination of the AI warp sample revealed multiple damage mechanisms, including matrix cracking, extensive fibre pull-out, delamination, and fibre breakage. The crack propagation path was notably tortuous, with the crack being deflected and arrested by the interlocking fibres. Compared to other tested samples, this sample demonstrated superior performance due to its optimised fibre orientation, facilitating better stress distribution and delaying catastrophic failure onset. It also showed the largest damage area, indicating significant energy absorption and resistance to failure, which is caused by the longer binder interlacements as explained by the more extended unit cell repeats.
In the ORTH sample, the crack initially follows a resin channel before encountering resistance from a binder yarn. Notably, the crack does not continue solely within the resin region, indicating slight offsets in the positions of the binders. Consequently, the crack veers between the binder yarns before traversing another resin region beneath the initial damage site
Figure 8 shows the side failure images of the 3D woven architectures in the weft direction. In all samples, the weft direction exhibits a more significant amount of damage compared to the warp direction. One explanation for this phenomenon is that less tension in the yarns in the material would produce higher, which would also lead to larger damaged areas and an improvement in specific mechanical properties. 12 However, this would only apply to the LL architecture, which exhibited higher tensile strength in the warp direction. Therefore, the more significant damage could be due to the lower fibre volume in the weft direction, causing cracks to propagate through resin-rich areas in the composite. This causes cracks to spread more extensively throughout the sample, as the matrix plays a more significant role in the failure process. As a result, matrix damage increases, leading to significant fibre pull-out. 40

Side view of weft (90°) tensile failure in LL, AI, and ORTH specimens.
Both the LL and AI weft specimens do not fully break apart but remain physically connected by a few unbroken fibres or the matrix, indicating a partial fracture. While the main structural integrity is compromised, the sample has not completely separated into two independent pieces. In contrast, the ORTH sample exhibits complete separation, demonstrating a full fracture across the entire sample due to the more significant resin channel and lower fibre percentage in that direction.
Flexural testing
Figure 9 compares the flexural stress versus strain response in the warp and weft directions; initial loading shows a linear response followed by a non-linear region until the final fracture. As the composite is loaded, matrix cracking occurs, accumulating and propagating, causing a deviation from linear elastic behaviour, reducing the matrix’s load-bearing capacity, and transferring more stress to the fibres, leading to non-linearity. 41 The LL architecture demonstrates a stepwise failure in the warp direction after reaching maximum flexural strength. Initially, there is a drop in flexural strength, likely caused by fibre breakage, but the architecture allows for load transfer before final failure. The AI sample exhibits a similar failure but to a lesser extent, suggesting initial fibre breakage without complete failure until the end. The ORTH sample shows complete failure at maximum flexural strength, indicating sudden and total damage in the sample.

Typical stress versus strain curves for LL, AI and ORTH in the (a) warp (0°) and (b) weft (90°) directions under flexural loading.
In the weft direction, the AI and ORTH specimens exhibit stepwise failure, maintaining some load-bearing capacity after an initial drop in flexural strength, suggesting that these structures can continue supporting loads before failure despite initial damage. Conversely, the LL sample demonstrates catastrophic failure at maximum flexural strength, indicating a sudden and total collapse without intermediate stages of load retention. This contrast highlights architecture’s influence on composites’ failure behaviours under different loading directions.
Table 5 and Figure 10 compare the flexural properties in the warp and weft directions for LL, AI, and ORTH specimens. In the warp direction, the flexural modulus and strength show notable improvements in the AI and ORTH configurations compared to the LL baseline. The AI configuration demonstrates a 22% increase in flexural modulus and a 28% increase in flexural strength, while the ORTH configuration exhibits a 15% increase in flexural modulus and a 22% increase in flexural strength.
Flexural properties comparison.


Comparison of the flexural strength and modulus in LL, AI, and ORTH specimens.
In the weft direction, the LL configuration outperforms the other configurations. The AI configuration experiences a 24% reduction in flexural modulus and a 22% reduction in flexural strength compared to the LL. The ORTH configuration shows the most significant decreases, with a 71% reduction in flexural modulus and a 59% reduction in flexural strength relative to the LL. These results underscore the superior mechanical performance of the AI and ORTH configurations in the warp direction, while the LL configuration remains dominant in the weft direction. The improved flexural performance of the angled binder tow in the AI configuration significantly impacts flexural properties more than the binder waviness seen in the LL design. As noted by Toray Industries, the angled binder tows act as a ‘truss’, improving the bending properties by preventing crack initiation, thereby leading to higher flexural modulus in weaves with angled binder. 35
In the warp direction, the LL specimens serve as the baseline, while in the weft direction, they show a 46% increase in flexural strength and a 72% increase in flexural modulus. This significant improvement highlights the superior load-bearing capabilities of the LL structure in the weft direction. Due to the increased number of wefts per centimetre, the higher fibre volume fraction in the weft direction contributes to this enhancement in mechanical performance. 42 The AI samples show a 5% decrease in flexural strength from warp to weft but a slight 4% increase in flexural modulus. While the strength decreases marginally, the increase in modulus suggests better stiffness in the weft direction, offering a more balanced performance across both orientations. In the ORTH samples, there is a stark contrast between directions. The weft direction shows a 51% reduction in flexural strength and a 59% reduction in flexural modulus compared to the warp direction (Figure 10). This significant decline underscores the directional solid dependency of the ORTH configuration, with the reduced number of weft yarns contributing to the weaker performance in the weft direction, making it more reliant on the matrix for load bearing. 43
In all the specimens in Figure 11, matrix cracking occurs near binder points, leading to delamination and tow fracture, with higher amounts of damage observed on the compression side of the ample under the load nose. In the LL sample, the higher fibre percentage restricts crack progression, as the tighter structure limits crack paths in the warp sample, cracks follow along the binder path, while in the weft sample, they take a more diagonal route, resisted by the warp binder yarns. In the AI warp sample, more tow fractures are observed due to warp binder yarns, with matrix cracking between the first and second weft yarns. As the crack propagates, it is resisted by the warp binder yarns, reducing further delamination. In the weft sample, cracks propagate along weft yarns and extend through the sample thickness, particularly in resin-rich areas between yarns. The higher flexural modulus results from reduced tow crimp, while the lower strength is due to the through-thickness fracture path. In the ORTH warp direction, tow fracture occurs through the warp stuffer yarn, making this sample the only one to exhibit significant matrix cracking at the bottom, particularly in the resin-rich region caused by binder interlacement. In the weft direction, this sample develops the highest number of cracks among all tested configurations. These cracks propagate through the thickness, causing tow fractures before being arrested by the warp stuffer yarns—the high crack density results from the lower weft yarn percentage, which promotes cracking in resin-rich regions.
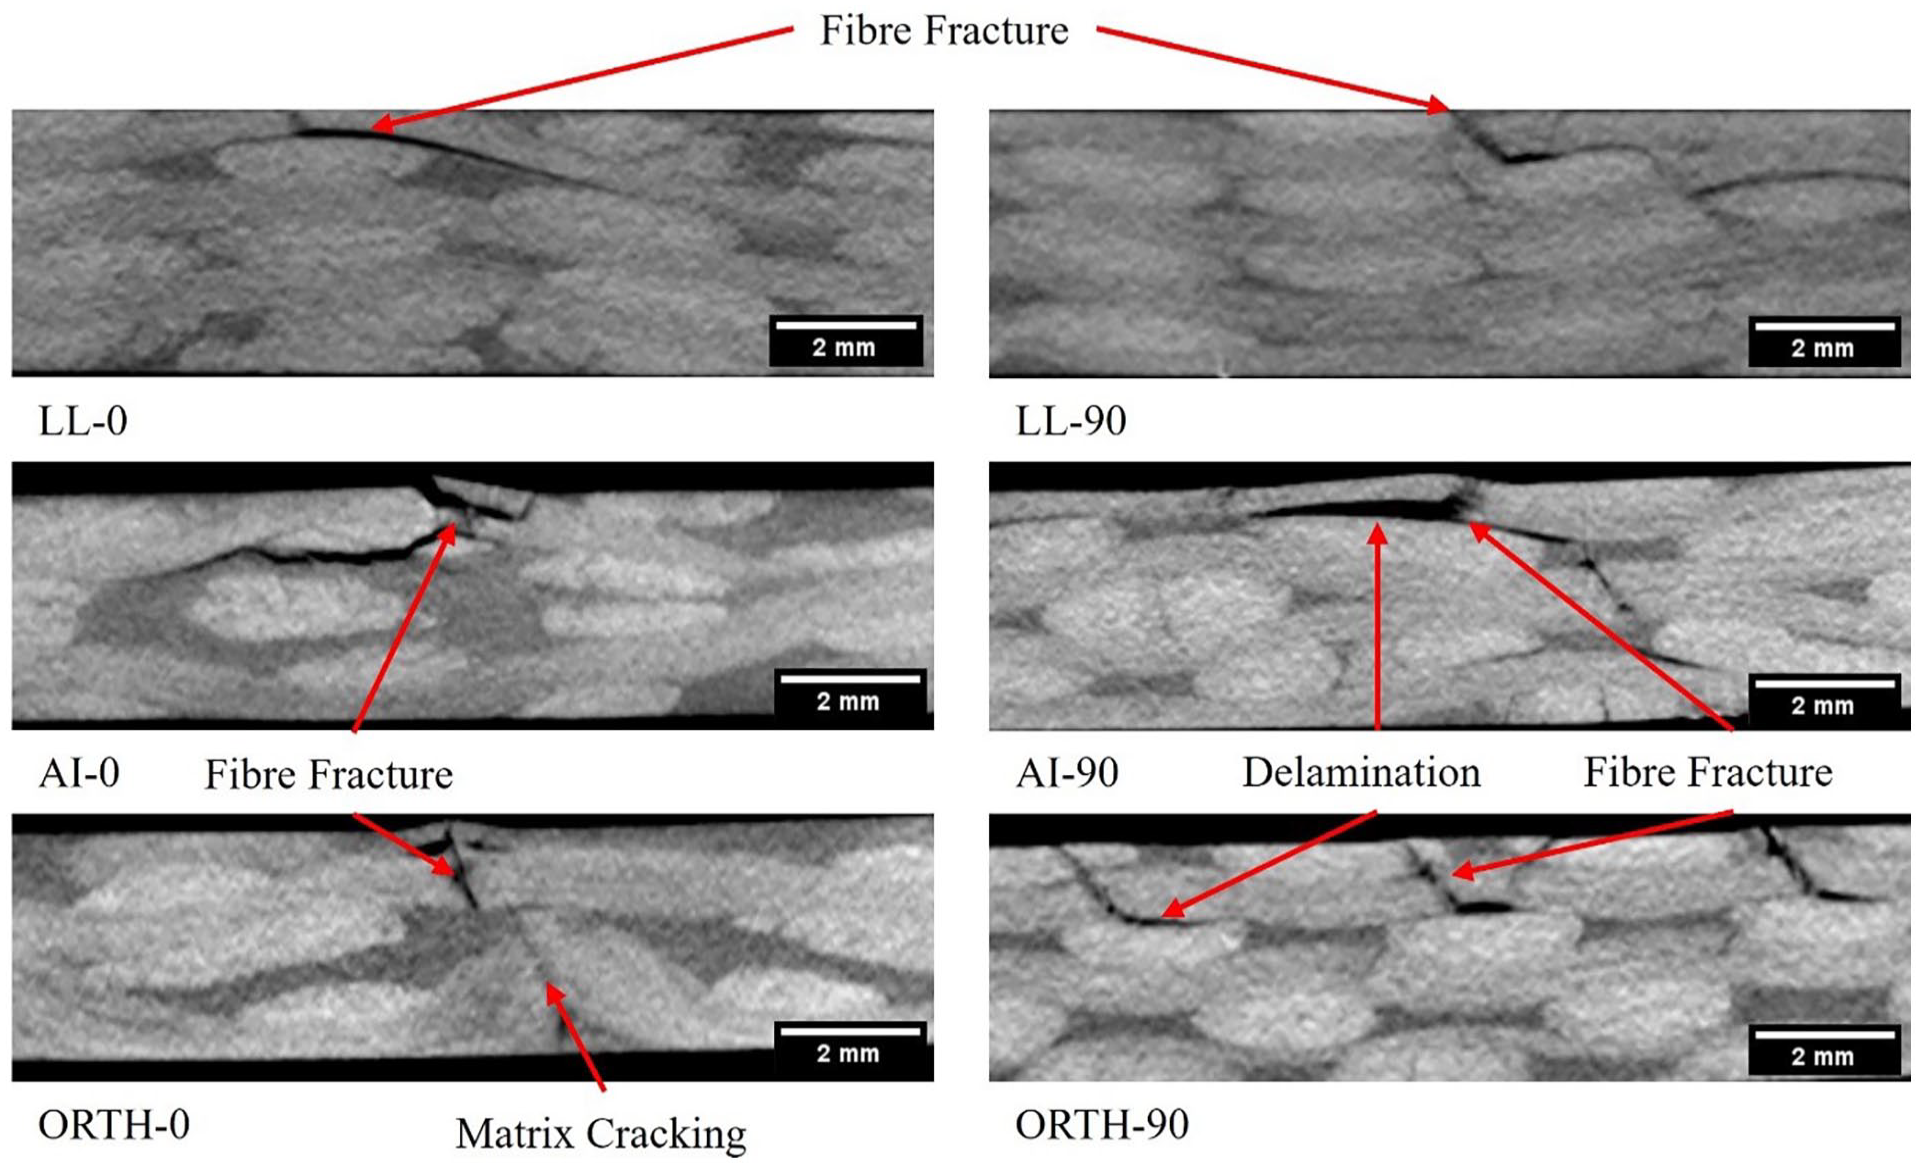
CT images of damaged areas after flexural testing in the warp (0°) and weft (90°) direction for LL, AI, and ORTH specimens.
Short beam shear testing
Figure 12 displays the force-displacement graphs for the three types of 3D woven composite specimens subjected to longitudinal (warp) and transverse (weft) loadings until failure. Each graph comprehensively illustrates the initiation and progression of damage, as well as changes in the stiffness of the specimens. LL specimens exhibit strong initial linearity in the warp direction, indicating elastic deformation under longitudinal loading until 0.21 mm displacement, where the slope decreases slightly with minor fluctuations, suggesting early material damage. At around 0.3 mm displacement, a significant force drop occurs. AI specimens display a higher initial modulus, reflecting a stiffer response. A reduction in modulus at 0.24 mm suggests matrix damage, with a sharp load drop at 0.34 mm indicating further structural damage, likely from fibre or yarn fractures. In contrast, ORTH specimens, after an initial elastic phase, transition into a non-linear regime, characterised by more considerable deflections and lower peak loads, indicating a more gradual failure. By 0.28 mm, the modulus decreases as damage accumulates, leading to plastic deformation until final failure.

Typical force versus displacement curves for LL, AI, and ORTH in the: (a) warp (0°), and (b) weft (90°) directions under short beam shear loading.
In the weft direction, the layer-to-layer architecture shows the highest shear modulus, maintaining linearity under longitudinal loading up to 0.23 mm displacement. Beyond this point, a slight reduction in the curve’s slope suggests the onset of internal damage, likely due to fibre fracture. The force drops significantly at 0.31 mm, though the material retains some residual strength before ultimate failure. The AI sample, in contrast, follows a linear force-displacement pattern up to 0.2 mm, indicative of elastic behaviour. Non-linearity follows, with a sharp drop in load at 0.38 mm, marking final failure. The ORTH weft sample behaves differently from the abrupt failures of the LL and AI samples. Instead, it shows a gradual decline in force, indicating internal damage processes like fibre-matrix debonding or micro-cracking. This gradual failure suggests the material can redistribute stress and maintain load capacity beyond initial yielding. The extended plateau phase in the curve signals a ductile failure mode, likely due to resin-rich areas in the ORTH architecture that help absorb and spread stresses.
Table 6 and Figure 13 compare the maximum load and short beam shear strength for the LL, AI, and ORTH specimens. The maximum load with the LL architecture serves as the baseline, and the AI configuration shows a significant improvement with a 28.86% increase, while the ORTH configuration experiences a slight decrease of 4.03%. The AI and ORTH configurations outperform the LL architecture in short beam shear strength, showing increases of 35.18% and 34.49%, respectively. The AI’s superior mechanical performance in the warp direction results from its geometric arrangement, which enhances load-bearing capacity and resistance to deformation. The angled orientation of fibres in the interlock structure contributes to improved load transfer and distribution, leading to higher maximum load and short beam strength. 44
Short beam shear properties.


Comparison of the maximum load and short beam strength in LL, AI, and ORTH specimens.
In the weft direction, the LL shows the highest performance. The AI configuration shows a moderate decrease, with an 8.47% reduction in maximum load, while the ORTH configuration experiences a substantial 68.36% decrease. The AI configuration shows a slight decrease of 4.24% for short beam shear strength compared to the LL configuration. In contrast, the ORTH configuration demonstrates the most significant reduction, with a 55.70% decrease in short beam strength. The ORTH configuration exhibits a pronounced reduction in mechanical properties due to its structural architecture, which distributes loads less effectively and offers weaker resistance to deformation under stress than the LL and AI configurations. The reduction in maximum load and short beam strength is due to the lower number of weft yarns within the architectures. Table 3 shows that the LL architecture has the highest number of weft yarns, followed by the AI, with the ORTH configuration having the least. This decrease in weft yarns per centimetre causes a decrease in the fibre volume fraction, significantly affecting the maximum load and short beam shear strength. 45
The maximum load and short beam strength are 17.2% and 16.71% lower in the warp direction than the weft direction for the LL specimens. However, the AI specimens show an increase of 16.9% and 17.67%, respectively; this same trend is observed in the ORTH samples, which show an increase of 87.4% and 87.8%. The decrease in the LL specimens is attributed to increased yarn density in that weft direction. There are nine yarns per cm; however, there are 10.6 yarns per cm in the weft direction. This decrease is due to the reduction in the number of yarns in the weft direction compared to the warp direction for the AI and ORTH samples, which is more apparent in the ORTH samples, which show a sizeable plastic region at the end of the test, indicating resin-rich areas in the sample.
The LL sample exhibits a combination of failure modes in the warp direction, including interlaminar shear and flexural failures in compression and tension Figure 14. While interlaminar shear damage typically concentrates in the middle, the presence of damage above and below this region suggests the occurrence of both compression and tension failures. 46 Diagonal crack propagation follows the binder yarns, indicating the role of these yarns in directing crack paths. The AI shows significant interlaminar damage marked by prominent horizontal cracks, indicating shear failure. Layers peeling apart in the middle suggest delamination and fibre matrix debonding due to exceeded shear strength, while matrix cracks, running both parallel and perpendicular to the delamination cracks, further weaken the structure. The ORTH sample also shows critical interlaminar shear damage, with a prominent horizontal crack across a central layer. More minor matrix cracks and fibre-matrix debonding are evident, likely caused by high-stress points related to resin-rich areas and weft yarn distortion from binder yarns during weaving, ultimately leading to delamination.

CT images of damaged areas after short beam shear testing in the warp (0°) and weft (90°) direction for LL, AI, and ORTH specimens.
In the weft direction, the LL sample shows a failure pattern similar to the warp sample but with fewer cracks. Fibre breakage near the loading nose at the top suggests compressive failure, while a small crack at the bottom indicates tensile failure. Vertical cracks in the middle propagate downward until they encounter a weft yarn, which redirects the cracks along the yarn, causing fibre-matrix debonding, indicating that the weft yarns help prevent further crack propagation through the sample. The AI weft sample exhibits a combination of failure modes similar to those seen in the LL and ORTH samples, with failure concentrated in the middle. At the edge, where fewer weft yarns are present, cracks initiate from the bottom in tensile failure and propagate through resin-dominated regions due to the lack of reinforcing weft yarns.
In contrast, the ORTH weft sample shows complete failure in tension, evident from a larger crack at the bottom compared to the top, suggesting the crack initiated under tensile stress. The limited number of weft yarns per centimetre in this sample leaves insufficient resistance to crack propagation, explaining the plastic non-linear phase, as the failure occurred primarily in resin-dominated areas. These observations emphasise the role of fibre-matrix bonding and adequate weft yarn density in resisting crack propagation and failure.
Conclusions
The primary objective of this study was to investigate the physical and mechanical effects of weave architecture when manufactured using the same loom set-up. This approach enables seamless transitions between architectures, allowing for the customisation of mechanical properties to suit specific applications. Three weaving architectures—Layer-to-Layer (LL), Angle-Interlock (AI), and ORTH (ORTH)—were fabricated on a dobby loom, infused via vacuum-assisted resin transfer moulding (VaRTM), and subsequently evaluated for their tensile, flexural, and short-beam shear properties in both warp and weft directions.
The AI and ORTH architectures exhibited superior tensile properties in the warp direction compared to LL, with AI demonstrating a 14% higher ultimate tensile strength (1003.35 MPa vs 877.68 MPa) and ORTH exhibiting a 17% increase in tensile modulus (70.74 GPa vs 66.62 GPa). Despite having lower fibre crimp, LL exhibited the lowest tensile strength, highlighting the critical role of warp stuffers in tensile performance. In the weft direction, LL demonstrated the highest tensile modulus (76.05 GPa) and tensile strength (1086.66 MPa), exceeding AI by 19% and 25%, respectively.
Digital Image Correlation (DIC) revealed localised strain concentrations near free edges, driven by architectural features like binder yarn positioning and resin-rich regions. These concentrations led to heterogeneous deformation fields and distinct failure mechanisms.
AI and ORTH exhibited enhanced flexural properties in the warp direction, with AI achieving a 22% higher flexural modulus (38.8 GPa vs 31.75 GPa) and a 28% increase in flexural strength (504.3 MPa vs 394.99 MPa) compared to LL. The angled binder tows in AI contributed to efficient load transfer and delamination resistance. Conversely, LL demonstrated superior flexural performance in the weft direction, with a 72% higher modulus (52.63 GPa vs 15.08 GPa) and a 146% higher flexural strength (577.04 MPa vs 234.71 MPa) compared to ORTH.
AI exhibited the highest short-beam shear strength in the warp direction (54.79 MPa, a 35% improvement over LL (40.53 MPa)), attributed to its optimised fibre interlocking and load distribution. ORTH also showed a 34% improvement over LL (54.51 MPa vs 40.53 MPa). In the weft direction, LL recorded the highest interlaminar shear strength (47.92 MPa), outperforming AI (45.89 MPa) and ORTH (21.23 MPa).
The resulting fibre architecture significantly influenced load distribution, stress concentration, and failure mechanisms despite consistent manufacturing conditions. With its angled binder tows, the AI architecture exhibited superior warp-dominated performance by enhancing load transfer efficiency and reducing fibre crimp, thereby minimising stress risers. Conversely, with its higher weft yarn density, the LL architecture demonstrated enhanced mechanical properties in the weft direction, attributed to its higher fibre volume fraction and improved transverse stiffness. While offering enhanced through-thickness reinforcement, the ORTH configuration exhibited trade-offs regarding interlaminar shear strength and flexural properties due to resin-rich regions.
Footnotes
Acknowledgements
This research project is supported and funded by UK Research and Innovation, part of the Belfast Maritime Consortium under the Strength in Places Funding programme. The author acknowledges the support from Artemis Technologies Ltd and The Engineering Research Centre (ECRE) of Ulster University, especially Roy Brelsford and Dr Glenda Stewart. This study was part of the Belfast Maritime Consortium UKRI Strength in Places project, ‘Decarbonisation of Maritime Transportation: A return to Commercial Sailing’, led by Artemis Technologies, Project no. 107138.
Ethical considerations
This article does not contain any studies with human or animal participants.
Author contributions
Callum Montgomery: Conceptualisation, Methodology, Visualisation, Formal analysis, Writing – original draft, Investigation, Writing – review & editing. Edward Archer: Writing – review & editing, supervision, Resources. Alistair McIlhagger: Writing – review & editing, supervision, Resources, Project administration, Funding acquisition. Emer McAleavy: Writing – review & editing. Calvin Ralph: Writing – review & editing, supervision, Resources, Project administration.
Funding
The author(s) disclosed receipt of the following financial support for the research, authorship, and/or publication of this article: This research was funded by UK Research and Innovation (UKRI) through the Belfast Maritime Consortium’s Strength in Places Fund (Project No. 107138).
Declaration of conflicting interests
The author(s) declared no potential conflicts of interest with respect to the research, authorship, and/or publication of this article.
Data availability statement
The data supporting the findings of this study is available from the corresponding author upon reasonable request. Requests for data will be considered and granted based on a reasonable and appropriate basis, with access provided under agreed-upon terms.