
Abstract
To address the challenge of quality measurement in fancy yarns, an improved Pixel Difference Convolution (PDC) for the Pixel Difference Network (PiDiNet) is proposed for measuring the evenness and hairiness of chenille yarn. A computer vision-based image acquisition system is established, utilizing a backlight source for image capture. The captured chenille yarn images show that most textural features align horizontally, while pile yarn introduces hairiness and fiber ends. Therefore, edge detection via image processing technology is crucial for evenness and hairiness measurement. The improved PDC for PiDiNet is designed to remove hairiness, fiber ends, and other noise, which enhancing horizontal features for edge detection. Evenness is subsequently measured by comparing the detected upper and lower edges of the yarn. Canny edge detection is utilized to detect hairiness and, fiber ends. Hairiness is then measured by subtracting the evenness measurement results from the Canny edge detection results. Experiments comparing the proposed method with other existing methods revealed that the yarn core coefficient of variation (CV%) and hairiness area index (HA) for 10 chenille yarn samples closely match manually measured values, highlighting the efficiency and effectiveness of the proposed method for evenness and hairiness measurement.
Introduction
Fancy yarn plays an important role in textile industry production. With the advancements in modern manufacturing technology, fancy yarn has become one of the most important products in the textile industry. 1 However, the quality of fancy yarn can significantly affect the efficiency and performance of textile products. Therefore, quality detection for fancy yarn during production is essential.
Traditional yarn detection methods include photoelectric yarn detection and capacitive yarn detection.2,3 These methods can achieve defect detection in ordinary yarns but cannot effectively measure evenness, hairiness, twist, and other quality parameters. With the development of computer vision technology, various quality parameters can now be assessed by analyzing captured images.4–7 Wang et al employed image processing technology to evaluate yarn appearance by placing the yarn on a blackboard surface. 8 The yarn image was acquired via a scanner, and image processing algorithms were subsequently used to extract the yarn core and hairiness. The coefficient of variation was used to evaluate yarn evenness, while a hairiness prediction model was developed for hairiness evaluation. Li et al presented a novel method for measuring yarn apparent diameter unevenness using yarn sequence images. 9 A dynamic threshold module was designed, and a K-means clustering algorithm was employed to classify the image into yarn and background regions. Based on the segmented image, the yarn core was further extracted by leveraging the characteristics of yarn hairiness, and the apparent diameter was measured accordingly. Zhong et al proposed a testing and evaluation method for yarn diameter unevenness based on the distribution characteristics of gray-level projection. 10 The sub-image was first divided into sections: the yarn noumenon, the suspected noumenon, and image background. Pixels of the suspected noumenon section were further categorized based on gray-level characteristics and their connectivity to the yarn noumenon. The complete yarn body image was then extracted. Nuno presented a new solution for automatically characterizing yarn mass parameters, including linear mass, diameter, and hairiness. 11 A webcam was attached to an analog microscope to acquire yarn images, which were then analyzed using image processing and computer vision techniques for quality measurement. Anirban used digital image processing to measure yarn hairiness. 12 Digital images of the yarn were captured using a projection microscope. The core yarn in the image was approximated as a rectangle, and the coefficients were set to adjust the shape of the rectangle to separate the yarn hairiness from the core. Edge detection was then applied to achieve the segmentation of the yarn hairiness from the background. Zhang et al presented a simple yet effective method based on modified Canny edge detection to accurately evaluate yarn apparent evenness. 13 The originally captured yarn image was preprocessed using a Gaussian filter, and image gradients were calculated using the weighted least squares method in both horizontal and vertical directions. A double threshold algorithm was then employed to extract the yarn edge curve. The average yarn diameter and the yarn coefficient of variation were subsequently determined by analyzing the number of pixels at the upper and lower edge points of the yarn. Zhang also presented a powerful method based on L0 norm smoothing and the expectation maximization method for yarn apparent evenness detection. 14 The L0 norm smoothing technique was applied to enhance the evenness diameter features of the yarn, which were then obtained using the expectation maximization method and a morphological opening operation. The results showed that the yarn apparent evenness diameter and its coefficient of variation were successfully calculated. Ma et al proposed a three-dimensional measurement method for yarn evenness. 15 A sample was placed within the image acquisition system, and both virtual and real images were captured by a single camera. The geometric relationship between the xoy and xoz planes of the system was established. The 3D model of the yarn core was then obtained by combining all the yarn cross-sections in the xoz plane. Li presented a novel yarn image segmentation method using a low-cost multi-camera collaborative system. 16 The segmentation process involved local vertical interruption, horizontal clearing algorithms, and morphological operations. A validated 3-D model of the yarn core was then established by solving elliptical parameters based on multiple camera positions.
It is evident that image binarization and edge detection are commonly applied for quality measurement of yarns. The determination of threshold values in these methods has a great influence on segmentation results. Furthermore, these methods can only be used for ordinary yarn in laboratory. In the case of fancy yarn, qualities such as evenness and hairiness cannot be accurately segmented.
To address these problems, an improved Pixel Difference Network (PiDiNet) is proposed for measuring the evenness and hairiness of chenille yarn based on computer vision. Experiments have been conducted to compare the proposed method with the results of conventional approaches, demonstrating its effectiveness.
The main contributions of our research can be listed as follows: (1) An improved PDC for PiDiNet is proposed based on the textural features of chenille yarn. (2) The textural features of chenille yarn are analyzed using a customized backlight source computer vision system. (3) Experimental results, compared with other methods, demonstrate that the proposed method can achieve a human-level performance in evenness and hairiness measurement.
Chenille yarn and measurement scheme based on computer vision
Chenille yarn
Chenille yarn is characterized by its softness and fluffiness due to its unique structure, as shown in Figure 1.

Structure of chenille yarn: (a) before twisting, (b) after twisting.
Chenille yarn consists of core yarn and pile yarn, which are intertwined with surface hairiness. To ensure the required strength, elasticity, and tension, the core and pile yarns are precisely twisted together. However, yarn unevenness may lead to fabric defects. The amount of hairiness affects the glossiness, while its distribution can create yarn defects. All of these factors strongly influence the quality of subsequent fabric production. Therefore, it is necessary to carry out evenness and hairiness measurements to ensure the production quality of chenille yarn.
Measurement scheme based on computer vision
To measure evenness and hairiness, a computer vision system is first established to acquire and analyze images of chenille yarn, as shown in Figure 2.

The computer vision system for image acquisition and analysis.
The computer vision system consists of the winding mechanism and the image acquisition and analysis system. The winding mechanism includes a 380 V three-phase motor, controlled by a frequency transformer, which adjusts the movement speed of the chenille yarn as it passes through the image acquisition area with the help of a winding roller and a yarn guider. The image acquisition and analysis system comprises a light-emitting diode (LED) surface backlight source, a CMOS camera, and a computer. The surface backlight source, model JH-FL211111-W, has the dimensions of 211 mm × 111 mm, while the light modulator, model JH-ZPV60-2C, has maximum power of 60 W. In this application, the power of the surface backlight source is set to 50 W using the light modulator. In the image acquisition area, the distance between the camera and the yarn is approximately 37.4 mm, and the length of yarn captured by the camera is about 60 mm. The captured image has a resolution of 200 pixels × 2000 pixels and is saved as an 8-bit greyscale image.
In Figure 2, it is clear that the yarn image is captured using the backlight source. One of the captured images of chenille yarn is shown in Figure 3.

Captured 8-b greyscale image for chenille yarn.
Clearly, the edge contour of the chenille yarn image includes both the upper and lower edges. The textural features of the pile yarn extend along the horizontal direction. We propose the following scheme for measuring evenness and hairiness, as shown in Figure 4.

Scheme for evenness and hairiness measurement.
PiDiNet offers the advantages of simplicity, lightweight design, and effectiveness in edge detection. 17 Based on the textural features of pile yarn, we improved PDC for PiDiNet to extract the edges of chenille yarn for evenness and hairiness measurement. It should be emphasized that edge detection must remove the effect of hairiness while preserving the main body of the yarn for evenness measurement. For hairiness measurement, the threshold value for edge detection should be set appropriately to ensure that all yarn details, especially hairiness, are fully captured. A subtraction-based approach, implemented using Canny edge detection, is applied for hairiness measurement.
Therefore, edge detection for chenille yarn differs and plays a crucial role in both evenness and hairiness measurement.
Improved PDC for PiDiNet in chenille yarn edge detection
Architecture of PiDiNet for edge detection
The architecture of PiDiNet for edge detection is shown in Figure 5.
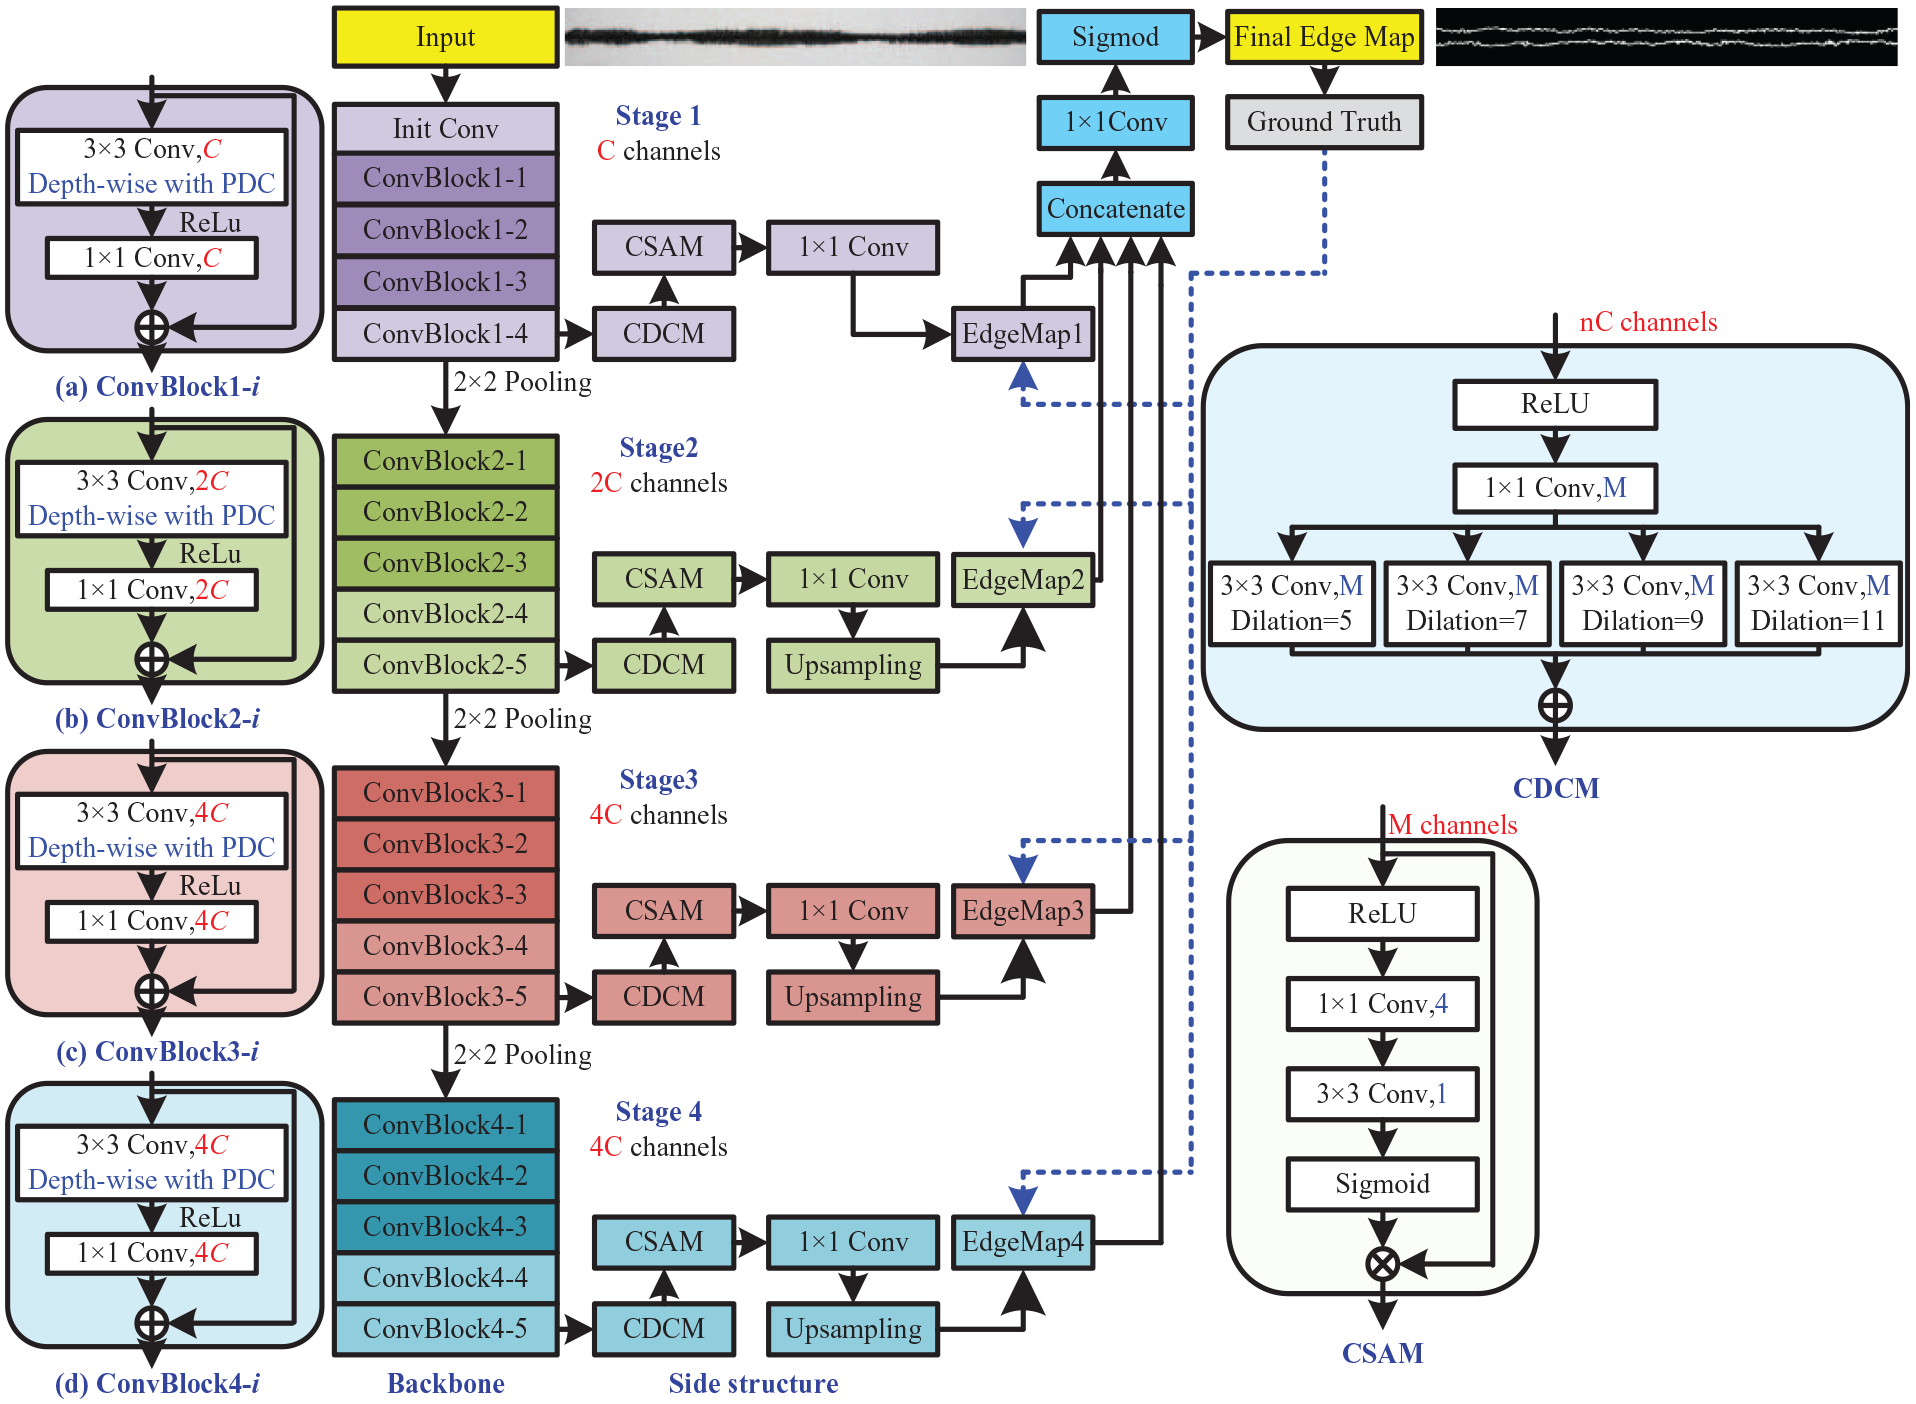
The architecture of PiDiNet for edge detection of chenille yarn.
The architecture of PiDiNet contains the following parts:

where yi is the ground truth edge probability, η is the predefined threshold, β is the percentage of negative pixel samples, and α = λ(1 − β). Pixels marked by fewer than η annotators are not included in the loss calculation to prevent ambiguity. The overall the total loss is given by:

Selected pixel pairs for the improved PDC
In PiDiNet, the original pixels in the local feature map patch covered by the convolution kernels are replaced by pixel differences, which are obtained through convolutional operations. There are three types of pixel difference convolution (PDC) for PiDiNet: center PDC (CPDC), angular PDC (APDC), and radial PDC (RPDC).
The improvement of our work lies in the related PDC within the backbone. Based on the textural features of chenille yarn in the captured image, we improved CPDC and APDC, and introduced the horizontally enhanced PDC (He-PDC). Thus, the improved PDC for PiDiNet comprises the horizontally center PDC (H-CPDC), He-PDC, horizontally angular PDC (H-APDC), and RPDC to achieve human-level performance in edge detection for evenness and hairiness measurement. The selected pixel pairs and pixel difference convolutions will be detailed in the following sections.
The selected pixel pairs and convolution for H-CPDC are illustrated in Figure 6.

Selected pixel pairs and the convolution for H-CPDC.
where wi (i = 1,2,. . .,9) is the weight in the 3 × 3 convolution kernel and xi (i = 1,2,. . .,9) is the input pixel. The convolution calculation for H-CPDC can be written as:

The selected pixel pairs and convolution for He-CPDC are illustrated in Figure 7.

Selected pixel pairs and the convolution for He-CPDC.
The convolution calculation for He-CPDC can be written as:

The selected pixel pairs and convolution for H-APDC are illustrated in Figure 8.

Selected pixel pairs and the convolution for H-APDC.
The convolution calculation for H-APDC can be written as:

The selected pixel pairs and convolution for RPDC are illustrated in Figure 9.

The selected pixel pairs and the convolution for RPDC.
The convolution calculation for RPDC can be written as:

For H-CPDC, the horizontal features of the upper and the lower edges can be extracted. For He-CPDC, the horizontal edge features are further enhanced. For H-APDC, the horizontal edge features can be extracted. Finally, for RAPDC, the entire contour features of the chenille yarn can be preserved.
Based on the improved PDC for PiDiNet, the upper and lower edges in the captured image will be detected. Subsequently, evenness measurement will be conducted by comparing these two edges.
Experiment tests and measurement
Datasheet and parameter settings
Using the designed measurement system based on computer vision, we captured 60 chenille yarn images with a resolution of 200 × 2000. The edges of the chenille yarn were manually drawn. Each chenille yarn image was then segmented into 10 smaller images, each with a resolution of 200 × 200.
For the training process, the parameters were set as follows: the initial learning rate was 0.0005, the weight decay was 0.0001, cosine annealing was used as the learning rate strategy, and the number of epochs was 100. For the testing process, the confidence threshold was set to 0.8.
Edge detection for chenille yarn
To measure the evenness of chenille yarn, the edges should be detected in advance. The evenness then calculated based on the upper and lower edges.
The edge detection model is trained using 20,000,000 samples and subsequently applied to the edge detection for the following 400,000 samples using the improved PDC for PiDiNet. To demonstrate the efficiency of the improved PDC for PiDiNet, we carried out edge detection using several method, including Roberts, Sobel, LoG, Canny, PiDiNet-vanilla convolution (PiDiNet-VC), 21 PiDiNet-PCD, 22 and the improved PDC for PiDiNet. Figure 10 illustrates one of the edge detection results.

Edge detection results: (a) original image, (b) manual detection, (c) roberts, (d) sobel, (e) LoG, (f) canny with the thresholds of 15 and 60, (g) canny with the thresholds of 30 and 80, (h) canny with the thresholds of 100 and 200, (i) PiDiNet-VC, (j) PiDiNet-PDC, and (k) improved PDC for PiDiNet.
As for the results in Figure 10(c), (d), (e), (f), (g), and (h), the edge of hairiness has been detected. In Figure 10(f), the details of Canny edge detection with thresholds of 15 and 60 have been preserved more effectively than in other methods. Thus, this method is used for the subsequent hairiness measurement.
However, the edge detection methods in Figure 10(c), (d), (e), (f), (g), and (h) are not suitable for evenness measurement due to the influence of many details. Fortunately, the edge detection results in Figure 10(i), (j) and (k) have removed these details. The hairiness of pile yarn appears to have been removed when compared with the manual detection result. However, the edge detection results are, in fact, affected by the presence of hairiness. Figure 11 shows some detection details for PiDiNet-VC, PiDiNet-PDC, and the improved PDC for PiDiNet.

Details of edge detection for three PiDiNets: (a) PiDiNet-VC, (b) PiDiNet-PDC, and (c) improved PDC for PiDiNet.
It is evident that noise, thickness, and breakdown are present in the edge detection results for PiDiNet-VC and PiDiNet-PDC. However, the improved PDC for PiDiNet achieves a better detection results. Table 1 shows the statistical results of noise, thickness, and breakdown for the testing set.
Statistical results of noise, thickness, and breakdown count for the testing set.

PiDiNet-VC is not improved based on textural features; therefore, the quantity of noise and thickness is greater than that of PiDiNet-PDC and the improved PDC for PiDiNet. However, PiDiNet-PDC is more prone to breakdown.
Evenness and hairiness measurement
To show the efficiency and effectiveness of the improved PDC for PiDiNet, evenness and hairiness measurements have been carried out.
The yarn core coefficient of variation (CV%) 23 is used to evaluate the evenness in the thickness of the yarn along its moving direction, while the hairiness area index (HA) 24 is used to evaluate the hairiness that protrudes from the main body of the yarn. These indices can be calculated as follows:

where xi is the obtained diameter value in the i row of each image,
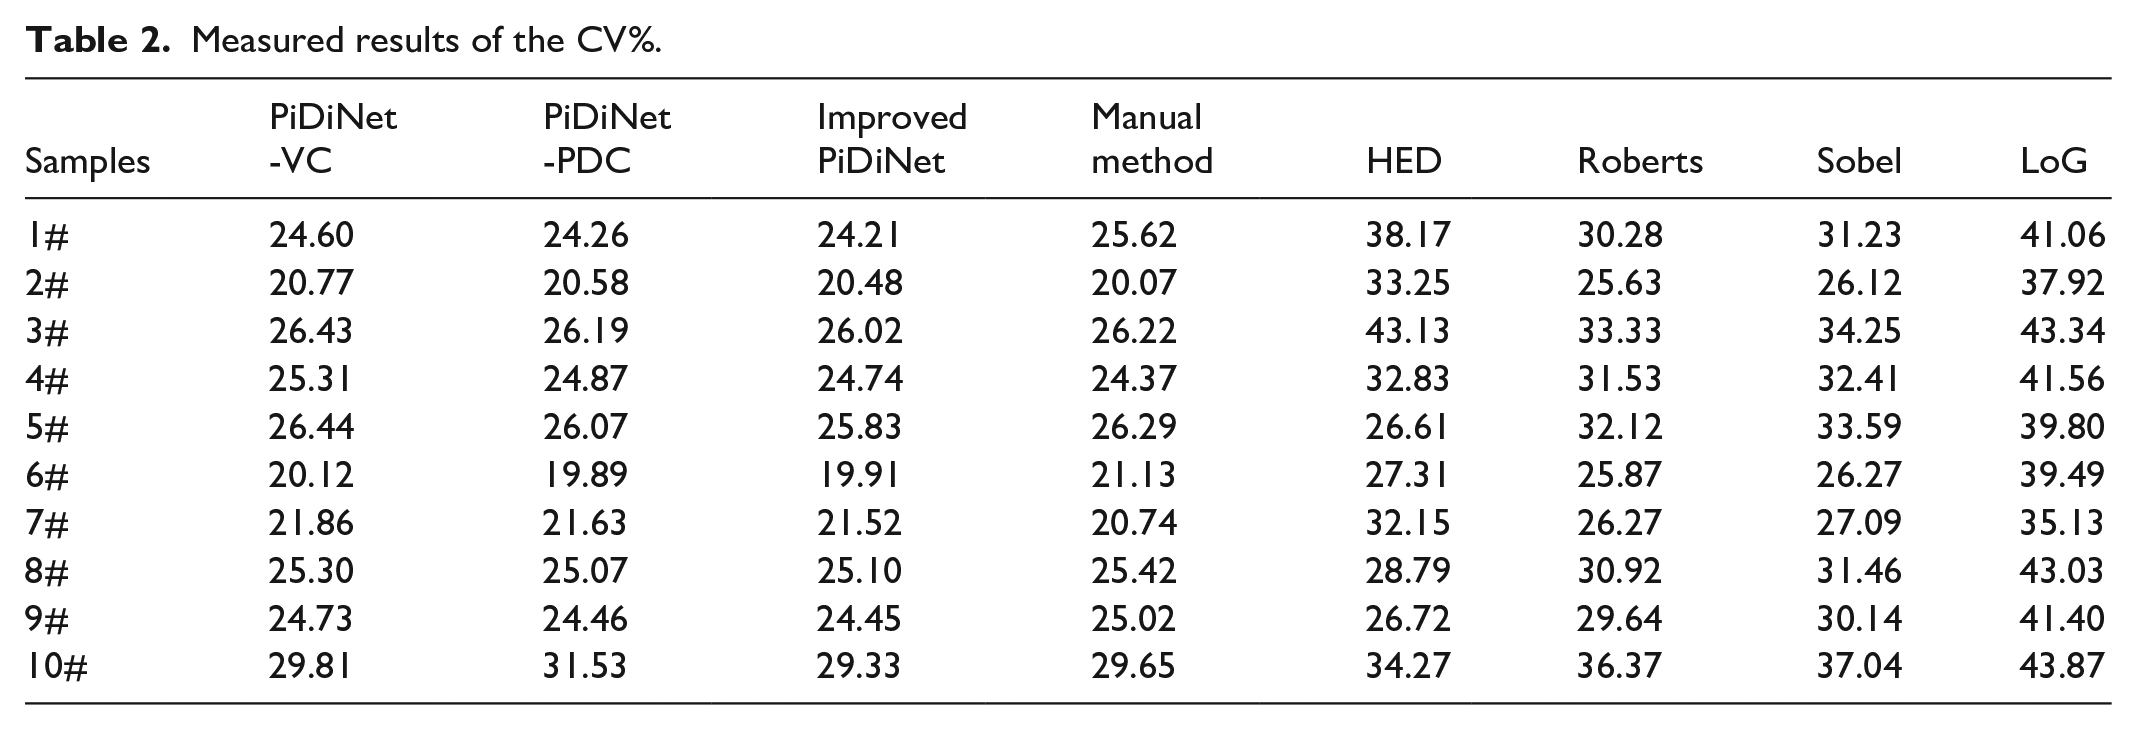
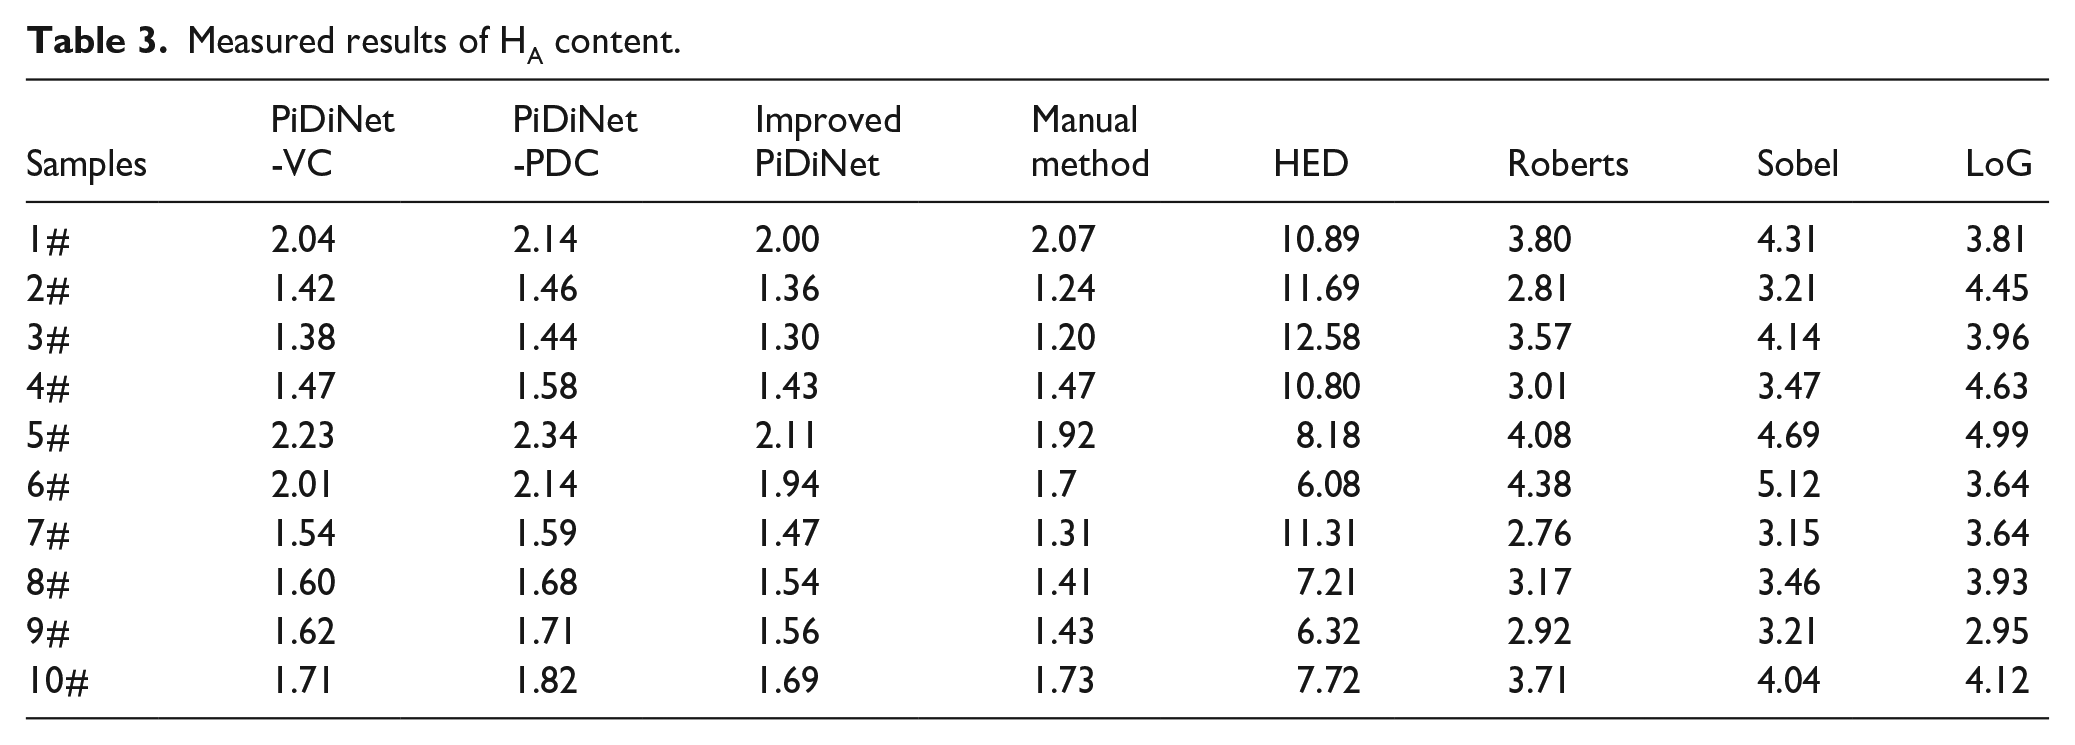
Table 2 shows the yarn core coefficient of variation (CV%) and hairiness area index (HA) for 10 chenille yarn images in the testing set, comparing PiDiNet-VC, PiDiNet-PDC, the improved PDC for PiDiNet (denoted as “improved PiDiNet” in Tables 2 and 3), and the manual method. Additionally, the results of existing methods, including HED, Roberts, Sobel, and LoG, are also shown in Table 3. Figures 12 and 13 illustrate these results.
Measured results of the CV%.
Measured results of HA content.

Yarn core coefficient of variation for 10 samples.

Hairiness area index for 10 samples.
In Figure 12, it is clear that the yarn core coefficient of variation results for the existing methods—HED, Roberts, Sobel, and LoG—are unsatisfactory when compared with the manually measured method. However, the results for PiDiNet-VC, PiDiNet-PDC, and the improved PDC for PiDiNet closely align with the manually measured values. Moreover, the yarn core coefficient of variation for the improved PDC for PiDiNet is slightly better than that of the other methods.
In Figure 13, the difference in the hairiness area index between the manually measured method and the existing methods—HED, Roberts, Sobel, and LoG—is significantly large. However, the result obtained using the improved PDC for PiDiNet is clearly better than those of PiDiNet-VC, and PiDiNet-PDC when compared with the manually measured method.
Furthermore, it should be emphasized that the improved PDC for PiDiNet can achieve a performance level comparable to human evaluation in both evenness and hairiness measurement.
Conclusion
To address the challenge of quality measurement for fancy yarn, the improved PDC for PiDiNet is proposed for the evenness and hairiness measurement of chenille yarn. A computer vision system is established for image acquisition and analysis, with yarn images captured using a backlight source. The features of chenille yarn images are analyzed, revealing that most textural features are oriented in the horizontal direction. Thus, to accurately measure evenness and hairiness, an improved PDC is proposed. H-CPDC enhances the horizontal features of the upper and lower edges of the chenille yarn, while He-CPDC enhances the edge features. H-APDC enhances the horizontally continuous features of the edge. These enhancements are then integrated into PiDiNet to obtain the main body of the chenille yarn for evenness measurement. In Canny edge detection, hairiness measurement is preformed based on evenness measurement. Comparative tests with other existing methods demonstrate the efficiency and effectiveness of the improved PDC for PiDiNet relative to the manual method.
Footnotes
Funding
The author(s) disclosed receipt of the following financial support for the research, authorship and/or publication of this article: This work was financially supported by National Natural Science Foundation of China (62203393), Natural Science Foundation of Zhejiang Province (LQ20F030019), the Key R&D projects of Science and Technology Department of Zhejiang Province (2022C01188), and Basic Public Welfare Research Program of Zhejiang Province (LGG22E050051).
Declaration of conflicting interests
The author(s) declared no potential conflicts of interest with respect to the research, authorship, and/or publication of this article.