
Abstract
This study evaluates yarn stiffness measurement techniques, focusing on 3-point and 4-point bending tests, the cantilever method, and the hanging pear loop method. It examines the effects of force and bending moment distribution on the stiffness of yarns such as recycled polyester, carbon, Kevlar, Vectran, and glass. The 4-point bending test consistently provides higher stiffness values than the 3-point method., reducing shear deformation and stress concentration. This difference is especially pronounced for carbon, Kevlar, and Vectran yarns, while glass and recycled polyester yarns exhibit more stable stiffness behavior. Alternative methods, like the hanging pear loop and cantilever techniques, also show differences based on stress application. A proposed buckling force evaluation for thin composite yarns with high fiber volume fractions demonstrates strong correlations with other methods. The findings emphasize the importance of selecting appropriate testing techniques based on yarn characteristics and accuracy requirements.
Introduction
Yarn stiffness is a critical property in fabrics and composites, influencing material performance across applications from fashion to aerospace. It encompasses both axial stiffness, which affects tensile strength and structural integrity, and flexural stiffness, which determines resistance to bending forces. In fabrics, stiffness impacts attributes like drapability, comfort, and esthetics. Stiffer fabrics retain shape and resist wrinkling, ideal for formal wear, while flexible fabrics suit casual and athletic garments. 1 Yarn structure and weave geometry significantly influence fabric stiffness, particularly in woven fabric-reinforced composites under in-plane tension.2–4
In composites, stiffness is crucial for rigidity and load-bearing capacity. High-stiffness yarns like carbon, Kevlar, and ultra-high-molecular-weight polyethylene are essential for superior reinforcement.5–7 Evaluating stiffness typically involves tensile tests for axial properties and bending tests for flexural properties. Techniques such as the cantilever method, heart loop test, three- and four-point bending tests are employed, with the four-point method emerging as the most reliable for stiff fibers.8,9
Axial and flexural stiffness are also pivotal in textile processes, maintaining fiber alignment during spinning, weaving, and knitting. 10 These properties influence fabric performance during dyeing, finishing, and garment construction.11,12 Advanced techniques like dynamic mechanical analysis (DMA) and nanoindentation provide insights into viscoelastic and localized stiffness properties,13,14 enabling the design of composite materials tailored to specific performance requirements. 15 Previous studies highlight the importance of these stiffness measurements. Carbon fiber composites’ evaluation through tensile testing 16 and flexural rigidity analysis in fiber-reinforced composites via bending tests 17 are notable examples. Advanced methods like DMA show how environmental factors, such as temperature, influence stiffness properties. 18 Several investigations into yarn stiffness’s relevance vary depending on the application. Axial stiffness is critical in tension-dominated applications like safety harnesses, climbing ropes, and marine mooring lines, where high tensile strength prevents excessive elongation. Flexural stiffness is vital in compression and bending applications, including tents, awnings, and composite panels, ensuring resistance to deformation under dynamic loads. In mixed-load scenarios, like textile-reinforced composites and sports equipment, a balanced combination of axial and flexural stiffness effectively manages combined loading conditions.19–22 Axial stiffness prevents deformation from aerodynamic forces, allowing sails to maintain performance under wind pressure. 23
Traditional methods for measuring flexural stiffness, such as cantilever and heart loop tests, face limitations when applied to high-performance fibers.24,25 The cantilever method is prone to torsional effects, while the loop test struggles with load distribution in stiff fibers like Kevlar. 26 The vertical cantilever method is moderately accurate but affected by gravitational forces and twisting. 27
Three-point bending method is widely used but prone to stress concentration and localized deformation, reducing accuracy for non-homogeneous materials. Conversely, four-point bending method distributes load uniformly, minimizing shear effects and providing consistent results for stiff fibers like carbon and Kevlar. 28 Studies comparing these methods highlight the four-point method’s superiority in measuring flexural modulus, particularly for non-homogeneous materials like composites. 29
Research integrating finite element analysis (FEA) with bending tests addresses challenges in measuring flexible textile yarns and overcoming issues like yarn sagging and slippage. 26 Accurate stiffness measurement requires careful setup, calibration, and error correction, particularly for fine, soft, or highly twisted yarns. Combining methods can enhance reliability and provide a comprehensive understanding of yarn behavior under bending stress. 27
Despite advancements, a notable gap exists in studies comparing measurement techniques for yarn stiffness, especially for high-performance, fine, or twisted yarns. Many studies isolate tensile and bending properties, neglecting their interaction. Addressing this gap, the present research integrates advanced experimental and computational approaches to evaluate axial and flexural stiffness correlations. The findings aim to optimize material characterization and improve performance in diverse applications, including aerospace and sports equipment composites.
By examining traditional and advanced stiffness measurement methods, this study contributes to developing reliable techniques tailored to the stiffness properties and applications of high-performance yarns.
Materials and methods
Materials
This study employed several types of high-performance yarns outlined in Table 1. The assessed samples comprised commercially available carbon fiber, Kevlar, Vectran, glass fiber, Recycled Polyethylene Terephthalate, and high-tenacity polyester cord yarns. Table 1 presents the mechanical and physical properties of these analyzed samples.
The specifications of yarns used for the research work (ASTM D 2256-02).

Setup for 3-point and 4-point measuring methods of yarn stiffness
Measuring of yarn bending stiffness (3-point and 4-point)
Measuring yarn bending stiffness using 3-point or 4-point bending tests presents several challenges due to yarn’s small dimensions, flexibility, and inherent properties.30,31 Key issues include yarn slippage, low bending stiffness, and variability in yarn structure. To address slippage, padded grips, clamps, and slight pre-tension (0.5 g/tex) are applied. Due to yarn sagging, low bending stiffness is mitigated by using sensitive instruments and controlling environmental factors. Variability in yarn structure is managed by testing multiple samples and preconditioning the yarn. Straightening the yarn or adjusting calculations account for pre-existing bends or initial deformation. To ensure uniform load application, precise loading equipment is employed. Finally, to prevent slip between supports, textured supports or clamps are utilized. These solutions help ensure more accurate and reliable stiffness measurements during testing.
Figure 1(a) and (b) shows the setup used for 3-point and 4-point bending tests.

(a and b) Setup for measuring the bending stiffness of yarns: (a) 3-point bending setup and (b) 4-point bending setup.
Estimation of yarn bending rigidity using cantilever method
Yarn-bending rigidities were determined using the same methodologies exclusively utilizing experimental yarn or fabric-bending rigidities. 25 This approach involves assessing the flexural rigidity of the yarn through cantilever method, which subjects the yarn to pure bending under its weight, as illustrated in Figure 2.

Cantilever method.
Assuming an elastic linear behavior between the bending moment and the curvature of the strip, it proposed a cantilever test (Figure 2). To determine the flexural rigidity S,

Where G (N.m), is the flexural rigidity per unit width and w is the weight per unit area.
Assuming the yarn is elastic and has small strain but large deflections, the relation between ratio S, angle θ of the chord with the horizontal axis, and length l of the bent part of the sample.

The cubic root of S (bending length) allows us to compare the yarns.
It has a unit of length and is called by Peirce “thebending length (l)”. The standard commercial devices are defined with a specific value equal to 41.5° for the angle of the tilted plane. 32 With this value, equation (2) becomes simpler:

This configuration is described in standard tests ASTM D1388-96(2002). The cubic root of S (bending length) allows us to compare yarns.
It has a unit of length called by Peirce “the bending length (l). The standard commercial devices are defined with a specific value equal to 41.5° for the angle of the tilted plane. 25

G: Flexural rigidity per unit width (N·m),
w: yarn weight per unit area (N/m²),
L: Overhanging length of yarn (m).
Estimation of yarn bending rigidity using pear loop test
The Pear Loop Test is another method for determining yarn bending stiffness. 30 In this test, a strip of yarn is formed into a pear-shaped loop, which is then hung vertically under its mass as shown in Figure 3. The loop’s length is measured, and from this, the bending length and flexural rigidity are calculated. This method is preferred for yarns that are difficult to test using the cantilever method, such as those that curl or twist.

Hanging pear loop shapes for the yarn.
Measured loop lengths were used to calculate the bending lengths and bending rigidities of samples according to equation (3). 30 five samples were tested.
The yarn flexural stiffness EI can be calculated using the following formula derived from the behavior of the hanging loop:

Where:
m: mass per unit length of yarn (kg/m),
g: acceleration due to gravity (9.81 m/s²),
L: length of the loop (m),
H: height of the hanging loop (m).
Equation (5) is derived from classical beam theory and bending mechanics but applied to yarns or fibers suspended in a loop.
Axial stiffness measurement
Thin Composite Buckling is an effective method for indirectly determining yarn axial stiffness by analyzing the buckling load. 31
It is particularly useful for composite applications, as it reveals how yarn stiffness behaves within a matrix under compressive loads or bending. The critical buckling load is directly related to the yarn’s axial stiffness and geometry, highlighting its role in resisting deformation.
Procedure for preparing thin yarn polymer composite for buckling test to measure yarn axial stiffness
Manufacturing process for the yarn/polymer thin composite
To prepare the samples, select a yarn type (high-performance yarn) such as carbon, Kevlar, Vectran, high-tenacity polyester, or glass yarn for testing axial stiffness. Measure and cut the yarn to the required length of 200 mm, ensuring consistency across samples. Arrange the yarns unidirectionally for uniform stress distribution and align them straight in the mold (Figure 4). Use spacers to maintain even spacing if multiple yarns are used and secure the ends to prevent displacement. Infuse the polymer matrix, ensuring full impregnation, and allow curing for mechanical integrity. Trim the composite edges to uniform dimensions. Prepare samples for the buckling test with precise geometry and parallel surfaces. An identical composite without fibers is also prepared. Thin composite samples are made using the hand lay-up technique with a low-viscosity thermosetting polyester matrix (100 parts polyester to 1-part MEKP hardener), applying a distributed polymer to prevent adhesion.

Thin yarn/polymer composite sample preparations.
Buckling test
To measure axial stiffness, mount the thin composite sample onto a buckling test fixture and apply compressive force parallel to the yarn axis, ensuring proper alignment in the testing machine. Five samples are tested for each composite, and average values are calculated, normalized by fiber volume fraction (VF = 0.6). The composite is subjected to compressive loads until buckling occurs, with the critical load used to calculate stiffness. The analysis assumes a good bond between the yarn and matrix, along with unidirectional alignment and uniform fiber distribution. Samples of different yarn types and matrix-only samples are tested to measure the buckling force with fibers (Pcrf) and without fibers (Pcrm) as shown in Figure 5. Buckling analysis is conducted using a “Tenso Lab” Universal Tester, where the composite is secured between two jaws, and the upper jaw moves at 1 mm/s. A video camera captures the composite’s deflection shape during loading.

(a and b) The buckling test on the tensile tester: (a) buckled composite and (b) buckled matrix.
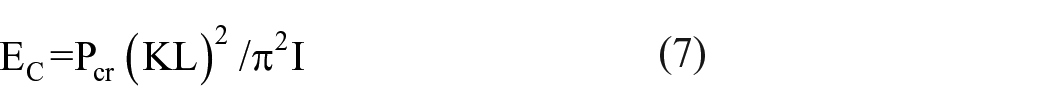
Calculating axial stiffness using the buckling test
In practical terms, if a yarn is subjected to compressive forces and exhibits buckling, its axial stiffness EC can be calculated using the critical buckling load (Pcr) through Euler’s buckling formula:

where:
EC: the axial stiffness,
I: area moment of inertia (related to the yarn’s cross-sectional area),
L: effective length of the yarn,
K: coefficient depends on boundary conditions (end conditions).
For both ends pinned: K = 1.0
For one end fixed and one end pinned: K = 0.7
For both ends fixed: K = 0.5
For one end fixed and the other end free (cantilever): K = 2.0
By rearranging this formula,
the axial stiffness of a yarn can be estimated when it is incorporated into a composite with a known matrix stiffness and fiber volume fraction. This approach leverages the composite’s overall stiffness and the rule of mixtures to deduce the yarn’s axial stiffness. In unidirectional fiber-reinforced composite, the effective axial stiffness Ec of the composite in the fiber direction (assuming fibers and matrix are aligned axially) can be expressed as:


where: Ec is the stiffness of the composite in the fiber direction, Ef is the axial stiffness of the yarn (fiber), Em is the stiffness of the matrix, Vf is the fiber volume fraction, and Vm is the matrix volume fraction, Pcrc is the composite critical buckling load, Pcr F is the fiber-critical buckling load and Pcr m is the matrix critical buckling load.
Results and discussions
The main challenges in determining the flexural stiffness of thin, flexible materials are accurately measuring small loads and large deflections. Methods for assessing stiffness typically involve applying a set load or deflection and measuring the resulting deflection or load, with various instruments and techniques available for this purpose.
4-point and 3-point bending test
The 3-point and 4-point bending tests are commonly used to measure yarn bending stiffness, but they differ in load distribution, shear force, and deformation characteristics. The 4-point test applies forces symmetrically, creating a constant bending moment and eliminating shear forces, improving stiffness measurement accuracy. 32 In contrast, the 3-point test generates both bending and shear forces, leading to stress concentration and potential stiffness reduction due to shear effects. The 4-point method provides uniform bending and reduces stress concentration, while the 3-point method increases the risk of deformation, fiber slippage, or plastic deformation. The 4-point test is more reliable for evaluating non-uniform or defective materials, ensuring consistent stiffness measurements. Results from various yarn stiffness tests, including the 3-point and 4-point bending, cantilever, and hanging pear loop methods, are summarized in Table 2.
The yarn stiffness testing result, 3-point and 4-point, cantilever, and hanging pear loop methods.
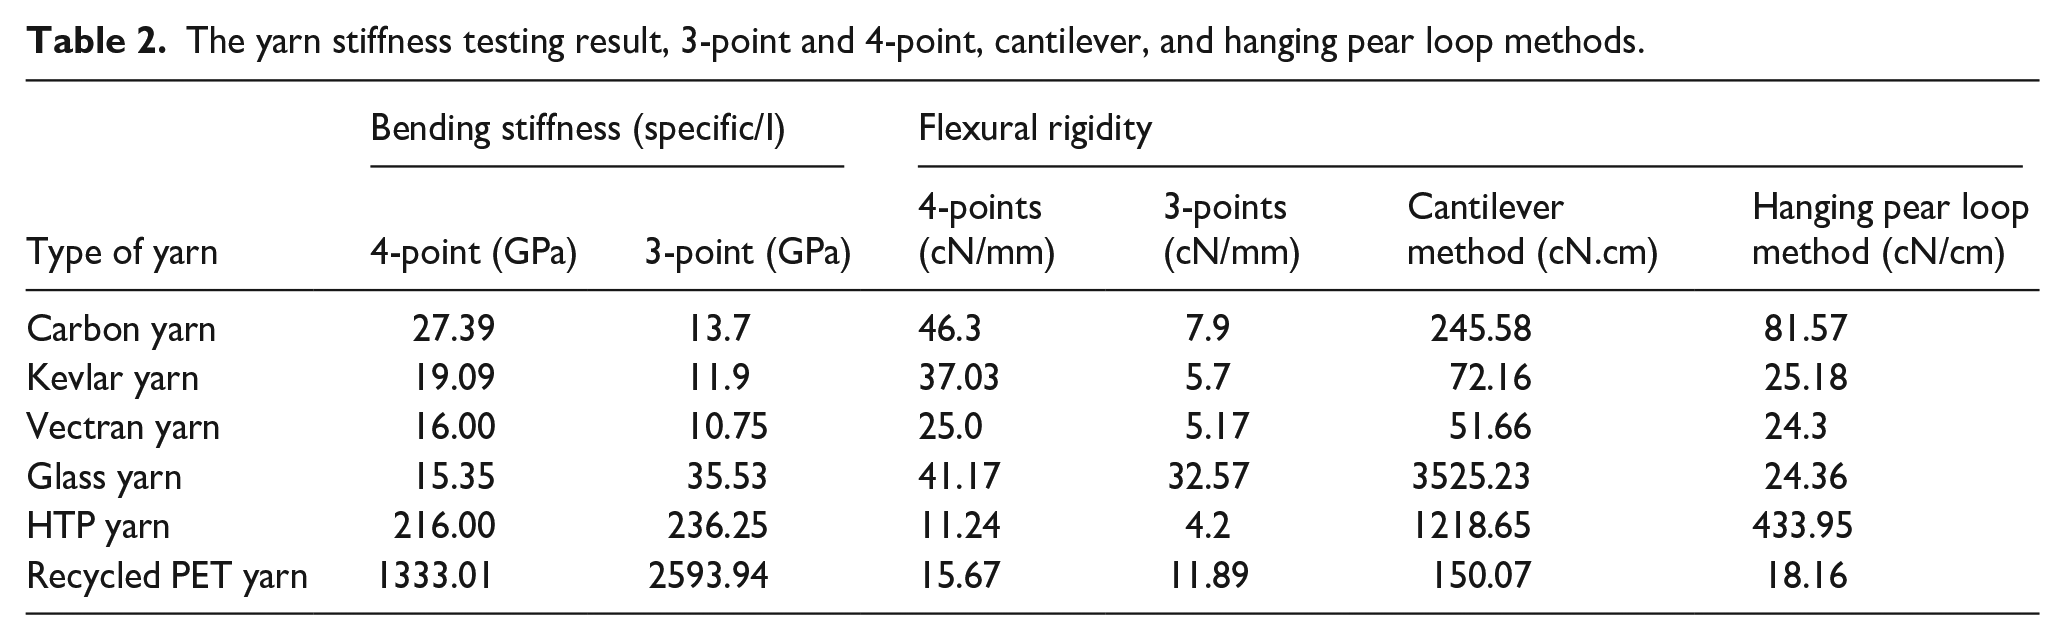
To compare the different yarns stiffness values, in case of 3 and 4 points, was divided by the yarn’s second moment of area (I).
Figure 6(a) and (b) illustrates the bending stiffness of various fibers, highlighting differences based on fiber type and testing methods. The molecular structure, including bond arrangement and polymer chain orientation, significantly impacts bending and axial stiffness. Carbon fibers, with their crystalline structure and high anisotropy, exhibit the highest bending stiffness due to strong covalent bonds and a reinforced carbon layer. Kevlar, with its flexible molecular chain and lower crystallinity, shows reduced stiffness compared to carbon fibers but retains high tensile strength. Vectran, a liquid crystal polymer, balances tensile strength and flexibility due to its unique molecular arrangement.

(a and b) Analysis of the relation between 4 and 3-point bending testing methods.
The 4-point bending test consistently yields higher stiffness values across all yarn types than the 3-point method, as it evenly distributes loads, minimizing stress concentration. This effect is especially pronounced for carbon, Kevlar, and Vectran yarns, which are sensitive to load distribution. Glass yarns, with their amorphous silica-based structure, show minimal variation between methods, reflecting more consistent stiffness measurements. The random atomic arrangement in glass fibers reduces their stiffness compared to carbon fibers despite high tensile strength. These findings demonstrate the influence of molecular structure and testing methods on the mechanical behavior of fibers under bending stress (Figure 6(a) and (b)).
The comparison of results of the 4-point and 3-point methods
The comparison of stiffness results using the 4-point, and 3-point methods reveals notable differences. For carbon Yarn, stiffness measured by the 4-point method is significantly higher than that obtained by the 3-point method. This discrepancy highlights a notable difference between the two measurement techniques. in the case of Kevlar Yarn, like Carbon yarn, Kevlar also shows a substantial difference between the stiffness values measured by the two methods, reinforcing the inconsistency in results between the 4-point and 3-point methods for this material.
Vectran Yarn, the difference between the two methods is less pronounced, suggesting that both methods yield more consistent results for this yarn type. HTP Yarn, stiffness values from both methods are quite close, indicating that the 4-point and 3-point methods provide equivalent results for this yarn. Recycled PET and Glass yarn, the 3-point method yields significantly higher stiffness values compared to the 4-point method, this considerable difference may be attributed to the variability in the properties of these fibers and how the bending moment is distributed along the yarn length.
The high correlation between the two methods, (as shown in Figure 7(a) and (b)), suggests significant differences in absolute values, the methods are closely related in their capacity to measure stiffness depending on the nature of the bending shape of the yarns. for carbon, Kevlar, and Vectran yarns the 4-point method shows higher values than the 3-point method. Different from the other set of yarns Recycled Yarn, Glass Yarn, and HTP yarn have vise versal results.

(a and b) The relation between 4-point and 3-point stiffness values.
The variation between yarn stiffness measurements using different methods can be attributed to how the materials respond to bending stress. The 3-point bending test focuses the load at a single point, which may inflate stiffness values due to concentrated stress at the loading point. In contrast, the 4-point bending test distributes the load more evenly across the yarn, accurately reflecting its overall behavior under stress.33,34
Cantilever method results
Based on Peirce’s cantilever testing procedure, in which a tow bends under its weight, ASTM D1388, is the test method for measuring a tow’s effective bending rigidity 35 introduced various tests to measure the bending rigidity and bending length of fabrics, including cantilever tests. This approach was also applied to determine yarn stiffness. The average value for the tow’s bending rigidity was obtained from five measurements. Figure 8(a) and (b) shows the value of the yarn bending stiffness for different yarns.

(a and b) Comparison of bending rigidity results measured by the cantilever method.
The hanging pear loop method results
The cantilevers test, 3 and 4 the point bending test, and hanging pear loops, are used to determine the yarn bending stiffness. In the analysis, the yarn is modeled as an inextensible elastic beam. For the hanging pear loops method; no loads are applied, and no special equipment is needed. Only the height of the deformed strip needs to be measured, along with the strip’s length. The other methods show some inaccuracy due to the nature of the test and the response of the fiber material to the applied load (3 and 4-point bending test). 36 Figure 9(a) and (b) shows the yarn stiffness measured by the hanging pear loop methods.
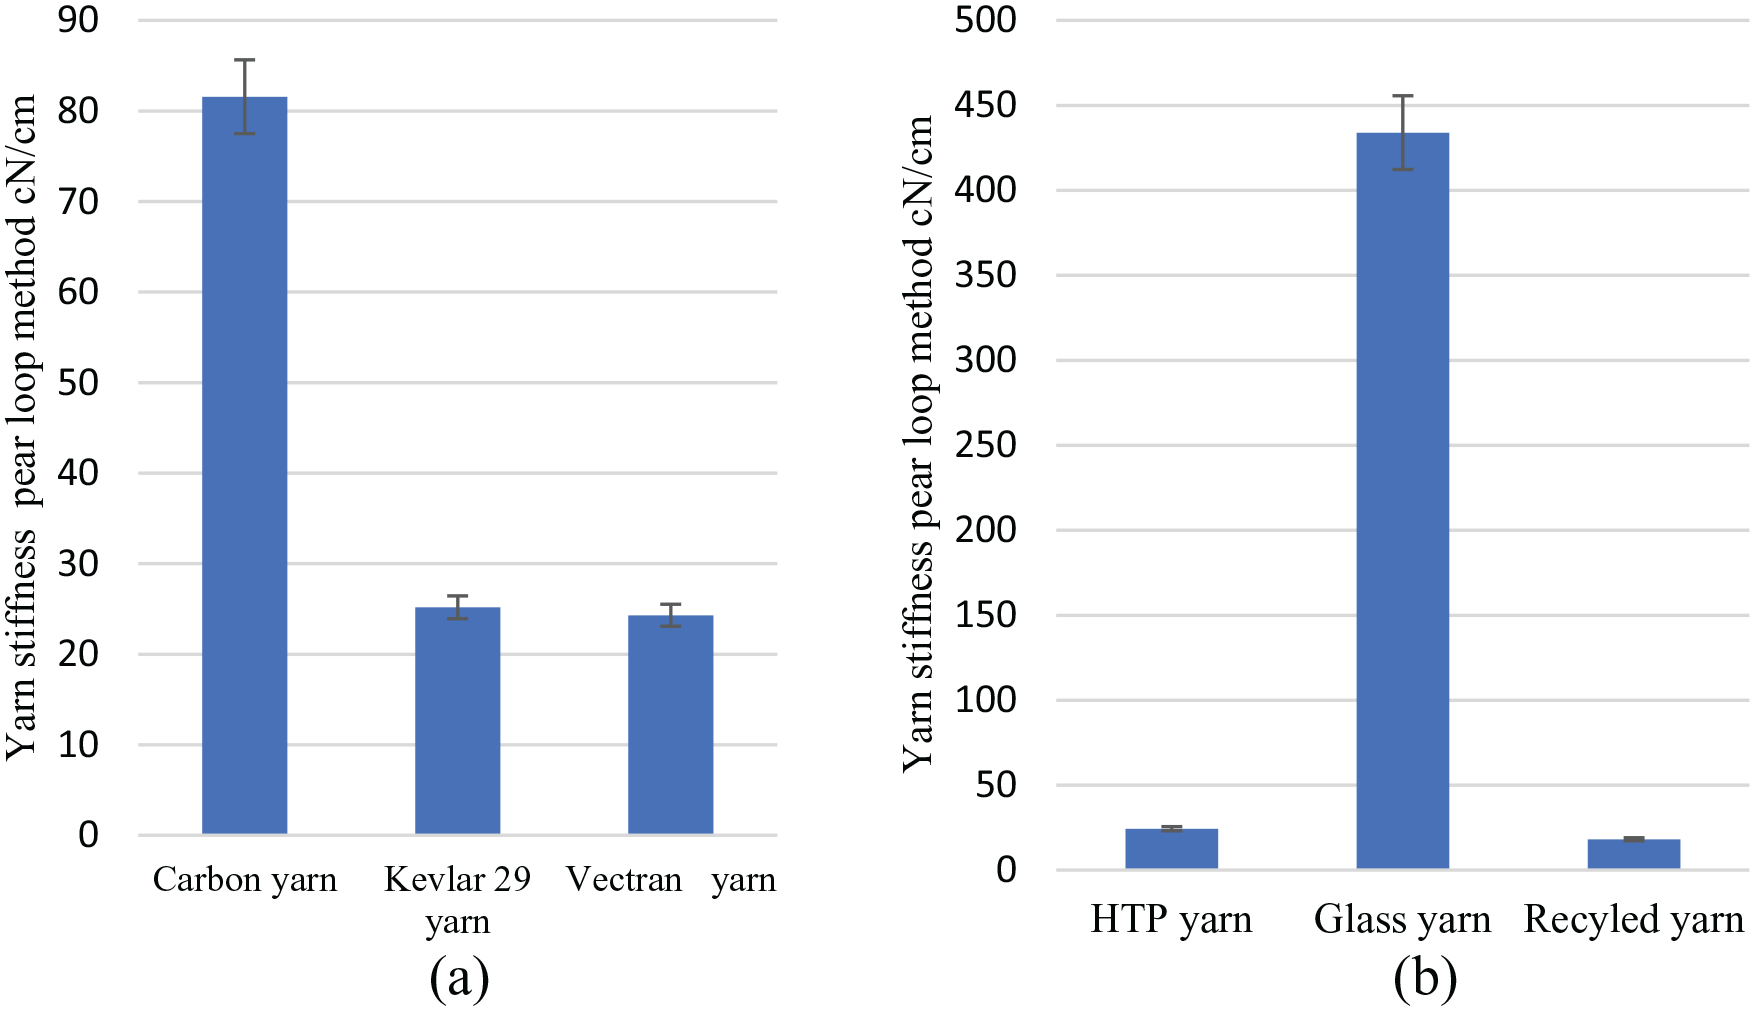
(a and b) Comparison of bending rigidity results measured by the hanging pear loop method.
Evaluation of testing techniques
The ANOVA test for the given measured data, p-value of 0.002, indicates significant differences in the bending stiffness among the different yarn types. These results suggest that the type of yarn significantly affects bending stiffness, flexural rigidity, and the outcomes of the cantilever and hanging pear loop methods. The low p-values (<0.05) indicate that the observed differences in the properties of yarn types are unlikely to have occurred by chance. The findings reveal that the cantilever method (cN.cm) exhibits a highly significant p-value of 0.0001, indicating robust consistency. Similarly, the hanging pear loop method (cN/cm) demonstrates a high significant, p-value of 0.0002. Both methods consistently produce low p-values, signifying notable differences across all yarn types while maintaining strong reliability and repeatability in their measurements. While both 4-point and 3-point GPa methods are statistically significant and useful for measuring bending stiffness, their consistency can be compared with other methods (like the Cantilever and Hanging Pear Loop method) based on specific application needs. The Cantilever and Hanging Pear Loop methods also show significant results and are more robust across various measurements, particularly for stiffer materials. 4-Point and 3-Point Bending Methods: The 4-point bending method consistently yields the highest stiffness values for all yarns, particularly for high-performance materials like carbon and Kevlar. This is considered the most accurate method because it reduces stress concentration, leading to more reliable and consistent results. On the other hand, the 3-point bending method often produces more variable stiffness measurements due to additional shear forces and localized deformation. In some cases, such as with glass and recycled yarns, the 3-point method tends to inflate stiffness values. The results of the 3-point and 4-point bending tests show a strong correlation, as evidenced by the high correlation coefficient.
Cantilever method and hanging pear loop methods
The cantilever method evaluates the bending stiffness of yarns and materials, assessing both flexibility and rigidity. This method is crucial for understanding how materials respond to bending forces, making it valuable for fabric construction and composite reinforcement. It was suitable for measuring bending stiffness in yarns used for woven fabrics, affecting drapability, stiffness, and wrinkle resistance. Applied in industrial fabrics to ensure shape retention under mechanical loads. Quantifies fabric behavior in fashion applications like evening wear and curtains. Evaluates bending contributions of woven yarns in laminates used in aerospace, automotive, or sports goods. The hanging Pear Loop method can evaluate tensile stiffness in stretchable and elastic fabrics like sportswear, hosiery, and medical textiles, and assess the elongation and tension behavior of fishing nets, industrial meshes, or safety nets stretchable fabrics.
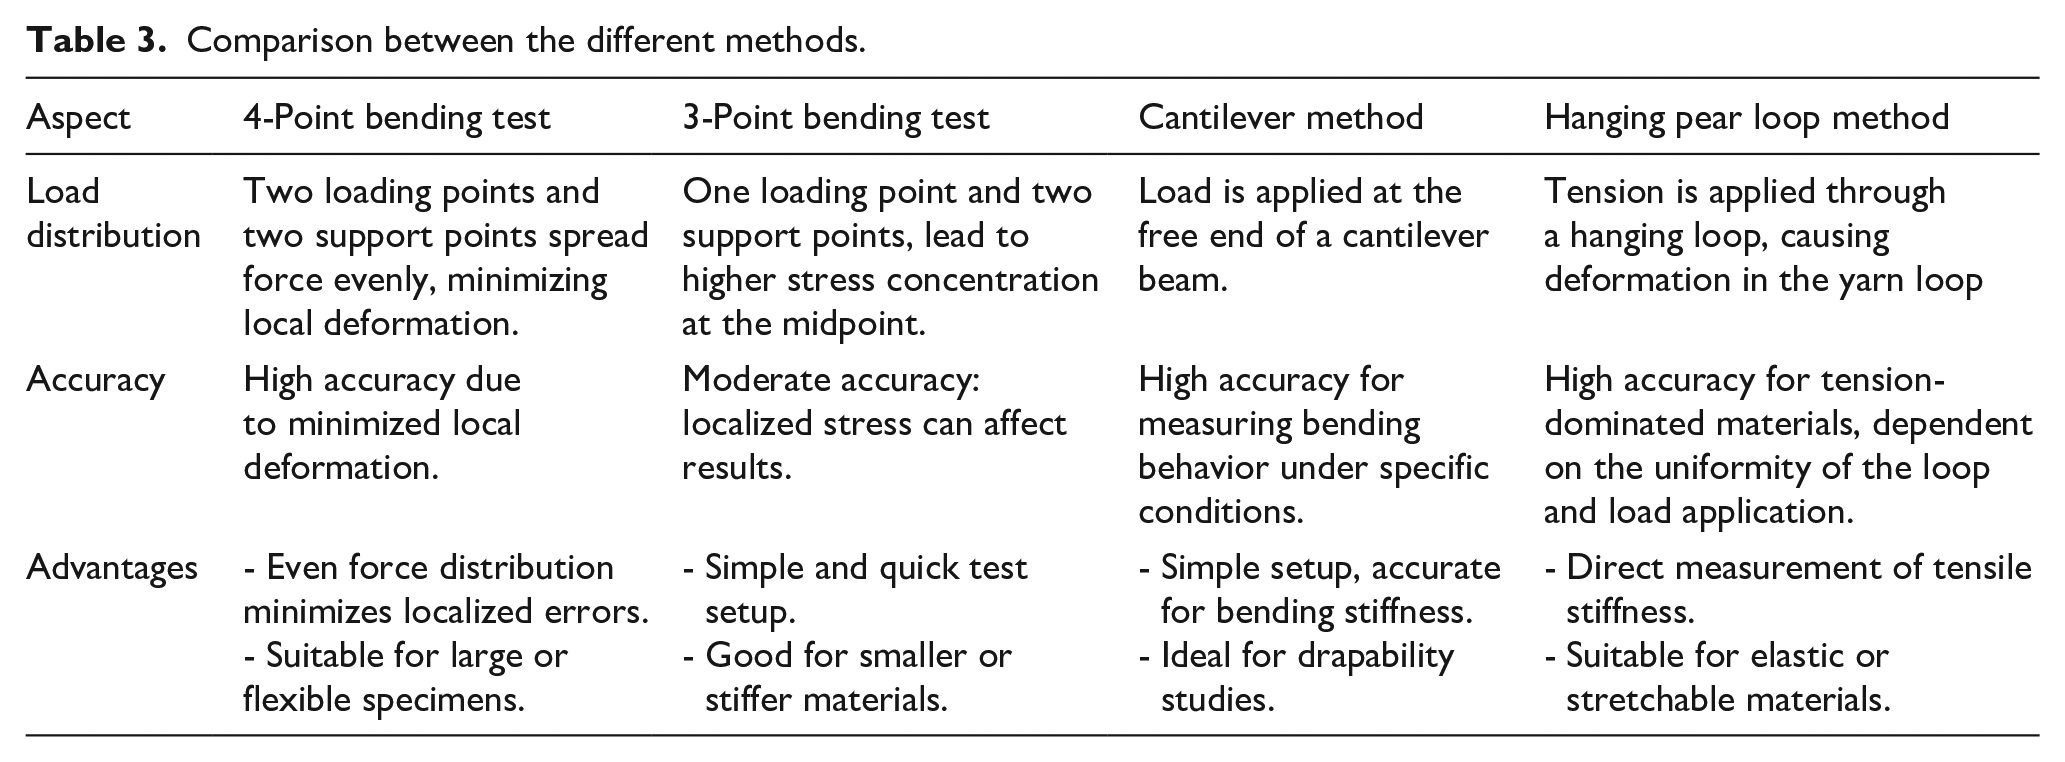
The analysis suggests that advanced techniques like the 4-point bending method are the most appropriate for stiff, high-performance fibers, providing more accurate and reliable measurements. Simpler methods like the cantilever or hanging pear loop may not perform as well, particularly when applied to stiffer yarns. Therefore, selecting the appropriate method based on the yarn’s properties is essential, with the 4-point bending method emerging as the most dependable for high-performance applications. Table 3 gives a comparison between the various methods of measuring yarn stiffness.
Comparison between the different methods.
Yarns axial stiffness method
Axial stiffness refers to a yarn’s ability to resist elongation or compression when subjected to a force along its axis. Direct tensile testing is the most common and precise method for determining axial stiffness in high-performance yarns. However, since yarns in composites often experience axial or compressive forces, measuring axial stiffness through buckling provides a more relevant assessment of their contribution to composite stability and load-bearing capacity.
Evaluating yarn axial stiffness using the critical buckling force of a thin composite offers precise insights into yarn performance under compression, including parameters like elastic modulus and axial rigidity, which are essential for validating theoretical models in composite design. The method chosen depends on the application, required accuracy, and yarn properties.
Both the axial stiffness of the composite and its reinforcing fibers influence buckling behavior by increasing the critical buckling load. Higher axial stiffness enhances buckling resistance, making it a crucial factor in designing composites for compressive load applications. 37 Figure 10 shows the deformation of the lightweight composite under buckling force.

Buckling of the different types of yarn/polyester composites.
Table 4 gives the value of the stiffness of the different yarns, and the buckling force.
Different yarn stiffness compared to the buckling force.

The axial stiffness of PET yarn was determined to be 140 N, aligning within the range observed for the other tested fibers. Axial and flexural stiffness are crucial for ensuring optimal performance under different loading conditions. High axial stiffness is needed to prevent deformation and maintain performance under wind loads, aiding in shape retention and control. Panels must also have high flexural stiffness to resist deformation and preserve structural integrity in construction and transportation. Table 5 shows a correlation matrix for various testing methods, indicating that all methods for measuring high-performance yarn stiffness strongly correlate, with the proposed buckling method being more suitable for highly flexible or fine yarns with high twist.
The correlation matrix of the different methods.

The critical buckling load (Pcr) is related to yarn axial stiffness, which is challenging to measure directly. However, this axial stiffness is closely linked to the bending stiffness of different yarn types, as determined by various measurement methods.
Conclusion
This study comprehensively evaluated the bending stiffness of various high-performance yarns, including Carbon, Kevlar, Vectran, Glass, and HTP yarns, using multiple testing methods: 3-point bending, 4-point bending, cantilever, and hanging pear loop techniques. The findings emphasize the critical impact of the testing method and material properties on the measured stiffness. 4-Point Bending Test: This method consistently yielded higher stiffness values than the 3-point test across all yarns. For example, the stiffness of Carbon yarn was measured as 27.39 GPa using the 4-point method compared to 13.7 GPa with the 3-point method, reflecting the uniform force distribution in the 4-point method that minimizes shear deformation and stress concentration. 3-Point Bending Test: This method showed lower stiffness values and higher variability due to localized stress and shear effects. For Kevlar yarn, the 3-point stiffness was 11.9 GPa compared to 19.09 GPa in the 4-point test. Cantilever Method: Carbon yarn exhibited a flexural rigidity of 245.58 cN·cm, highlighting the method’s ability to assess stiffness through self-weight deflection. Hanging Pear Loop Method: This technique, suitable for soft or highly twisted yarns, measured flexural rigidity at 81.57 cN·cm for Carbon yarn. The correlation matrix revealed strong relationships between the results of the different methods (e.g. a correlation coefficient of 0.99 between the 4-point and 3-point stiffness values). Statistical analysis, including ANOVA tests, confirmed significant differences in stiffness values across yarn types and methods (p < 0.05).
These results highlight the necessity of choosing suitable testing methods according to the yarn type and its intended use. For high-performance yarns that require exact stiffness measurements, 4-point bending method is highly recommended. In contrast, cantilever and hanging pear loop methods are particularly useful for applications such as thin yarns with fight flexibility. The axial stiffness strong correlation with the bending stiffness across different yarn types as measured by various techniques. The proposed method for assessing the buckling force of thin composites with high fiber volume fractions used as an indicator of yarn axial stiffness, demonstrated high correlations with all other methods.
Future work investigates the correlation between yarn stiffness and the mechanical properties of the composites they reinforce, particularly under bending, compression, and combined loads.