
Abstract
The light absorption properties of dyes constitute a pivotal characteristic that significantly influences their performance and application. To investigate the relationship between the molecular structure of mono-azo orange series disperse dyes and their corresponding maximum absorption wavelengths, a predictive model was developed. Employing Gaussian quantum chemistry software, the relationship between the molecular structures of four mono-azo orange series disperse dyes and their respective maximum absorption wavelengths was systematically examined. In the present study, the initial conformations of selected disperse dye molecules were generated, followed by the optimization of the energy-minimized conformations using quantum chemical DFT. The thermal correction to free energy and single-point energy were computed to determine the Gibbs free energy and the Boltzmann distribution ratio at 298.15 K. Conformations exhibiting a Boltzmann distribution ratio of at least 5% were selected for subsequent excited-state calculations, which yielded the ultraviolet-visible absorption spectra and the corresponding maximum absorption wavelength. A fitting prediction model based on optimization for the maximum absorption wavelength was then established. The results demonstrate that when this model is applied to predict the maximum absorption wavelength of a single azo orange series disperse dye, the testing error rate remains within 6%, suggesting a high degree of consistency within an acceptable range of accuracy. These findings suggest that the model could serve as a valuable technical reference for predicting the absorption performance parameters of disperse dyes, thus contributing to the green innovation and sustainable development of these materials.
Keywords
Introduction
Disperse dyes were initially developed in the mid-20th century and specifically engineered for dyeing polyester fibers. Coinciding with the industrialization of polyester fibers, these dyes witnessed a rapid expansion in their usage. Consequently, they have emerged as the predominant category of textile dyes, both in terms of production volume and sales. 1 In recent years, heightened environmental protection imperatives and the quest for superior textile printing and dyeing quality have significantly spurred the development of new disperse dyes. The molecular structure of disperse dyes intricately affects their maximum absorption wavelength and color properties, directly influencing their suitability for specific dyeing applications. Consequently, investigating the correlation between the molecular structure of disperse dyes and both their maximum absorption wavelength and color properties is crucial for the innovative design and development of novel disperse dyes.
Since the onset of the 21st century, the incorporation of quantum chemistry theories and associated computational software within the dye industry has markedly increased, furnishing robust support for the design of dye synthesis, as well as the optimization and innovation of dyeing processes. 2 The integration of quantum chemistry calculations into the textile industry, aimed at predicting dye-fiber affinity and photostability, 3 can substantially streamline the exploration of potential new dye structures, circumvent complex and costly preparation processes, and markedly enhance the efficiency of developing new dyes. 4 Gaussian,5–7 the preeminent quantum chemistry computational software, is extensively deployed across chemistry, materials science, and biochemistry to compute molecular structures, energies, vibrational frequencies, and other molecular properties from first principles. Utilizing Gaussian and associated auxiliary programs to investigate the relationship between the molecular structure of disperse dyes and their maximum absorption wavelengths facilitates the prediction and optimization of dye performance in the development of novel dyes. Chem3D8,9 serves as a versatile 3D molecular modeling and visualization tool extensively utilized in chemistry and biology to depict and analyze chemical structures, furnish three-dimensional representations of molecules, and facilitate molecular dynamics simulations and structural optimization. However, it does not possess the advanced capabilities for high-level calculations and simulations found in more specialized quantum chemistry or molecular dynamics software. Open Babel10–12 is a versatile chemical toolbox adept at managing a diverse array of chemical data languages. As an open collaborative initiative, Open Babel enables widespread access for searching, converting, analyzing, and storing data across molecular modeling, chemistry, biochemistry, and related disciplines. However, Open Babel’s capabilities are somewhat constrained when it comes to advanced quantum chemistry calculations and dynamic simulations. The Confab module within Open Babel is specifically designed to generate low-energy molecular conformations, primarily employed in cheminformatics and molecular modeling to assist users in identifying the most stable molecular configurations. xTB,13,14 a freely available program, leverages the GFN-xTB 15 theoretical framework to compute the geometries, electronic properties, and energies of molecular systems, effectively balancing computational speed with accuracy. While occasionally less precise than comprehensive quantum chemistry approaches, xTB efficiently delivers accurate geometry optimizations, frequency calculations, and descriptions of non-covalent interactions. The xTB program excels at rapidly pre-optimizing conformations in bulk, thereby providing preliminary energy estimates. Crest,16–18 predicated on the GFN (Geometries, Frequencies, Noncovalent interactions) method, demonstrates enhanced efficacy when integrated with the GFN2-xTB19,20 methodology. Crest employs xTB to optimize computational resources, thereby substantially diminishing calculation times. Molclus, 21 a complimentary cluster and conformation search tool developed by Lu Tian, offers enhanced utility in molecular modeling. It provides flexible operations, transparent processing, and detailed control over conformation searches, greatly facilitating data modification, calculation resumption, and recalculation processes. The molecular structures handled by Molclus can be readily visualized with the aid of the visualization program VMD (Visual Molecular Dynamics). 22 VMD is a robust molecular visualization tool extensively utilized in the fields of biomolecular research, materials science, and chemistry, primarily for the visualization and analysis of molecular dynamics simulation outcomes. Although VMD excels in visualization and analysis, it lacks inherent molecular dynamics simulation functionalities and therefore must be integrated with other software to enable these capabilities. Multiwfn 23 is a robust wave function analysis tool, integral to quantum chemistry, extensively applied in the post-processing analysis of quantum chemistry calculations. Multiwfn can flexibly and efficiently analyze results from quantum chemistry calculations; however, it lacks a graphical user interface, necessitating basic programing skills for effective use. Multiwfn is capable of reading electronic excitation data from Gaussian output files, effectively broadening calculated absorption peaks to simulate the spectral shapes observed in experimental settings, thus enabling the calculation and graphical representation of UV-Vis absorption spectra for detailed visual analysis.
Due to limitations in the types of disperse dyes and the time constraints of quantum chemistry calculations, this thesis focuses on orange disperse dyes with similar structures. Quantum chemistry calculations are performed on the structures of experimental disperse dyes using Gaussian and the molecular conformation search program Molclus, with data analyzed using the wave function analysis tool Multiwfn. The UV-Vis absorption spectra of three orange disperse dyes are tested, and the test data serve as a reference for comparison. By optimizing the calculation conditions, a model is developed that correlates the calculated and tested maximum absorption wavelengths of the experimental orange disperse dyes. Finally, the applicability of the experimental model is verified using other orange disperse dyes for comparison.
Experimental section
Experimental apparatus and materials
Experimental instruments: UV-2600 UV-Vis spectrophotometer (Shimadzu Corporation, Japan); SK3310HP ultrasonic cleaner (Shanghai Kudos Ultrasonic Instrument Co., Ltd.); MS204S electronic balance (Mettler-Toledo, Switzerland); UF260Plus forced convection universal oven (Memmert, Germany). Dye computational chemistry service system (DELL PowerEdge R740 rack server).
Chemical reagents and experimental materials: N, N-dimethylformamide (DMF, Xilong Scientific Co., Ltd., Analytical Purity); Qualitative filter paper (Hangzhou Special Paper Co., Ltd.).
Experimental disperse dyes: C.I. Disperse Orange 44, C.I. Disperse Orange 25, C.I. Disperse Orange 31, C.I. Disperse Orange 61. All experimental disperse dyes utilized are commercial products, with their names and structural details presented in Table 1. Selecting structurally analogous dyes for research diminishes the complexity between experimental and computational studies, enhances the accuracy of calculated outcomes, and supports robust comparative analysis. Successful validation of specific theories or computational models on similarly structured dyes could potentially generalize these findings to a wider spectrum of dyes, thereby broadening the data set’s applicability.
Experimental disperse dyes.

Quantum chemical calculation and structural optimization of dispersed dyes
Employing the vertical excitation calculation method to simulate the UV-Vis absorption spectra of disperse dyes, the computational analysis was conducted using a suite of software programs including Gaussian 16 C01, Chem3D, Crest, Xtb, OpenBabel, Multiwfn, Molclus, VMD, and Origin. 24
Initial conformations of the experimental disperse dye structures were generated via the Confab module within OpenBabel. Batch optimization of the dye conformations was performed using the Crest program, which utilized the xtb tool applying the GFN2-xTB method. Subsequently, conformations were screened in ascending energy order using the Isostat program within Molclus. Owing to discrepancies between the order of energy levels and relative energies, additional optimization calculations were required. The lowest energy conformations were further optimized and subjected to vibrational analysis in Gaussian, utilizing the SMD solvent model (DMF solvent), B3LYP/6-31G*25,26 functional basis set combination, and incorporating the D3(BJ) 27 dispersion correction.
While the accuracy of GFN2-xTB is somewhat lower than that of ab initio methods, its rapid computational speed renders it highly suitable for the preliminary screening and geometric optimization of extensive molecular datasets, with subsequent refinement using more precise techniques. Gaussian incorporates the SMD 28 solvent model, widely recognized as one of the foremost implicit solvent models available today. Despite its demand for substantial computational resources, the SMD model typically delivers more accurate solvation free energies and effects relative to other continuum solvent models. It offers a comprehensive description of solute-solvent interactions, making it well-suited for predicting solubility, reaction free energies, and various other properties.
B3LYP is a hybrid density functional that integrates LDA, GGA, and HF exchange interactions, offering a robust framework for electronic structure calculations. B3LYP is extensively utilized for the structure optimization and frequency calculations of organic molecules, attributed to its optimal balance between computational efficiency and accuracy. For organic entities such as disperse dyes, B3LYP typically delivers sufficiently precise predictions of geometric structures and energy states. The 6-31G* basis set, being of medium size, provides reasonable accuracy for organic molecules such as disperse dyes at comparatively low computational costs. The B3LYP/6-31G* combination achieves high accuracy while maintaining moderate computational expenses, making it ideal for preliminary structural optimization and vibrational analysis of disperse dye molecules.
Quantum chemistry calculations account for van der Waals forces and dispersion interactions between molecules, which are pivotal in governing intermolecular interactions. These interactions stem from fluctuations in electron clouds, which induce transient dipole and multipole moments, thereby generating various forces. Dispersion correction serves as a method to precisely characterize these van der Waals forces and dispersion interactions. The D3(BJ) dispersion correction method is widely employed owing to its high reliability and precision, enhancing the accuracy of calculation results through effective dispersion correction.
Following structural optimization and vibrational analysis, high-precision single-point calculations are conducted using the M06-2X/def2-TZVPP29,30 level of theory, with the inclusion of free energy correction terms to accurately derive the corresponding free energies. The Boltzmann distribution ratios of the dyes are calculated to select conformations with ratios not less than 5%, followed by the computation of the excited states for these selected conformations.
M06-2X, a high-precision hybrid density functional, excels in accurately describing non-covalent interactions, van der Waals forces, and dispersion interactions among molecular systems. For disperse dye molecules, M06-2X delivers enhanced accuracy in electronic correlation energies, particularly beneficial for molecular systems characterized by dispersion interactions. The def2-TZVPP basis set, a comprehensive triple-zeta set incorporating polarization and diffuse functions, offers precise depictions of electron distributions and intermolecular interactions. Employing the def2-TZVPP basis set significantly enhances the accuracy of calculations, rendering single-point energy calculations more dependable. Although computational costs are considerable, the use of single-point calculations in this experiment is justified by the need to obtain high-precision energy data within a feasible computational timeframe.
Employing TD-DFT methods along with the SMD solvent model (DMF solvent) in Gaussian, the excited states of dyes are accurately calculated. The selection of the functional for excited state calculations is influenced by the need to approximate electronic interactions, with numerous functionals integrating a proportion of HF exchange. B3LYP, a widely employed hybrid functional, incorporates approximately 20% HF exchange. Compared to pure DFT functionals, B3LYP typically yields more precise excitation energy calculations. However, preliminary testing revealed significant discrepancies between B3LYP functional calculations and the empirical data for the selected experimental disperse dyes.CAM-B3LYP, 31 an enhanced version of the B3LYP functional, introduces a correction term specifically designed to adjust long-range Coulomb interactions based on electron distance.CAM-B3LYP proves effective for large molecules or systems with pronounced charge transfer characteristics, hence its selection for this experiment.
Given its precision, the def2-TZVP basis set, favored for large atomic and molecular systems, is chosen for excited state calculations. The def2-TZVP basis set, a comprehensive triple-zeta set, offers enhanced calculation precision, accurately depicting molecular electron distributions and interactions. While the def2-TZVP basis set incurs high computational costs, it necessitates additional time and resources. However, the def2-TZVP basis set lacks diffuse functions, which may compromise its accuracy. Consequently, the ma- method is employed to incorporate diffuse functions into the def2-TZVP basis set, thereby ensuring enhanced calculation accuracy.
From the Gaussian output files, excitation data for the experimental disperse dyes are extracted, and the conformation-weighted average UV-Vis spectra are generated using Multiwfn and additional software tools.
Testing of absorption spectra of dispersed dyes
Four disperse dyes were selected from the laboratory inventory, a predetermined amount of each commercial dye was accurately weighed into a flask, and subsequently dissolved in DMF solvent to achieve a uniform 1 g/L dye solution. The dye solution was then diluted with additional DMF to ensure that the maximum absorbance values fell within the optimal range of 0.2–0.8. The UV-Vis absorption spectra of the four dyes were measured using a Shimadzu UV-2600 spectrophotometer, thereby confirming their maximum absorption wavelengths and characterizing their absorption spectra.
Model for predicting the maximum absorption wavelength
Employing the aforementioned method, determine the maximum absorption wavelengths for C.I. Disperse Orange 44, C.I. Disperse Orange 25, and C.I. Disperse Orange 31. Conduct a linear regression analysis on both the calculated results and the experimental data to establish a predictive correlation model for the maximum absorption wavelengths.
Utilize C.I. Disperse Orange 61 as a comparative dye. Analyze the compatibility of the experimental prediction model by comparing the calculated and experimentally determined maximum absorption wavelengths.
Results and discussion
Optimization of the molecular structure of dispersed dyes
The initial conformations of the four experimental disperse dyes were screened, and the lowest-energy conformations were optimized and subjected to vibrational analysis using Gaussian software. The optimized conformations of the dyes are shown in Figure 1. Conduct single-point energy calculations on the optimized conformations, incorporating free energy correction terms to ascertain the final and relative energies of each conformation. Single-point energy calculations yield electronic energy at 0 K; however, at finite temperatures, molecular thermal motions—vibration, rotation, and translation—contribute additional energy to the molecular properties. Free energy correction terms are applied to account for these contributions, thereby aligning theoretical calculations with experimental data and enhancing the reliability of theoretical predictions. The inclusion of thermal correction terms in single-point energy calculations ensures that the computed free energy matches experimental data.

Structural representation of the optimized conformations for four disperse dyes.
The Boltzmann distribution ratio quantifies the relative probability distribution of molecular conformations at a specified temperature. At equilibrium, conformations with lower energy predominate, a phenomenon crucial for elucidating the molecular ground and excited states. Conformations exhibiting Boltzmann distribution ratios of no less than 5% at 298.15 K should be selected, as detailed in Table 2.
Energetic characteristics and Boltzmann distribution ratios of experimentally derived disperse dye conformations.

The four disperse dyes display a range of significant conformations, with their relative energies indicative of stability. Conformations with lower energy are inherently more stable and consequently more prevalent. The Boltzmann distribution ratio converts energy differences into relative proportions at 298.15 K, thereby revealing the actual occurrence probabilities of each conformation. Diverse molecular conformations can yield varied spectra; thus, averaging spectra weighted by Boltzmann distribution ratios yields a comprehensive spectrum that facilitates more accurate comparisons with experimental observations.
As depicted in Figure 1, the four disperse dyes display multiple conformations at 298.15 K, primarily characterized by positional variations in the groups of the coupling components. The groups within these conformations demonstrate marked positional differences. Conformations exhibiting high Boltzmann distribution ratios manifest enhanced stability at a given temperature compared to others. At 298.15 K, the Boltzmann distribution ratios reveal that each dye possesses dominant conformations, exemplified by a conformation with a 52.02% ratio in C.I. Disperse Orange 25. Weighted UV-Vis absorption spectra, derived from the Boltzmann distribution ratios, correlate more closely with the experimentally observed spectra.
Maximum absorption wavelength of the dye
Assess the UV-Vis absorption properties of the four orange disperse dyes using the Shimadzu UV-2600 spectrophotometer to obtain absorbance-wavelength (A-λ) spectra, as depicted in Figure 2.
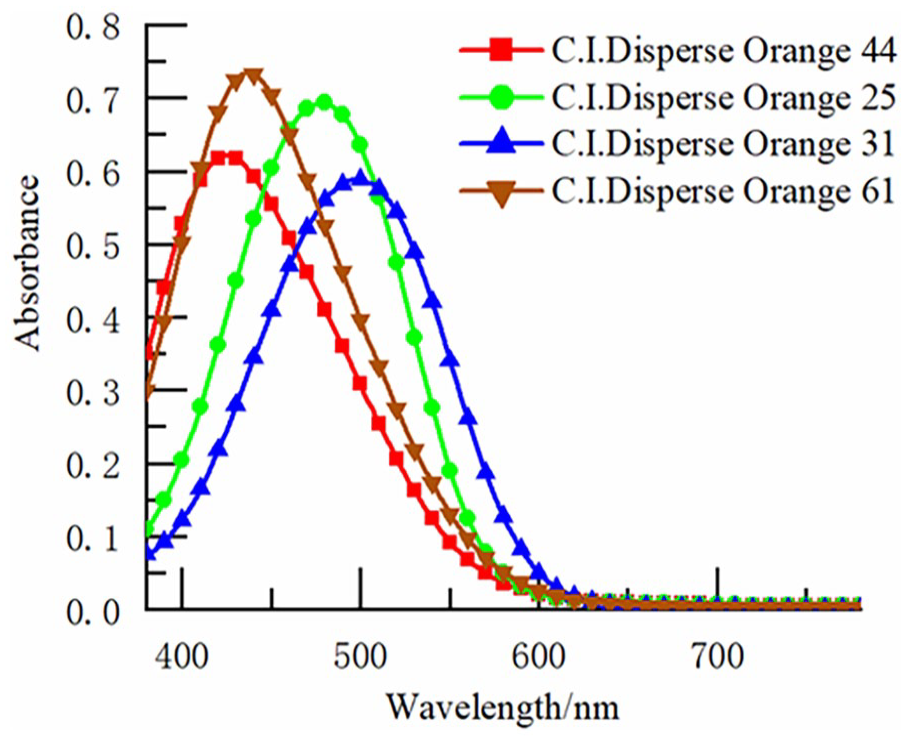
Ultraviolet-visible light absorption spectra of four disperse dyes in DMF.
Upon comparing the structures of the four orange disperse dyes, while variations in the type and position of individual groups occur, the skeletal structures of the dyes remain identical. The maximum absorption wavelengths (λmax) of the four dyes span from 425 to 479 nm, exhibiting minor variations, as presented in Table 3.
Comparative analysis of experimental and theoretical values for the maximum absorption wavelengths of dyes in UV-vis spectroscopy.
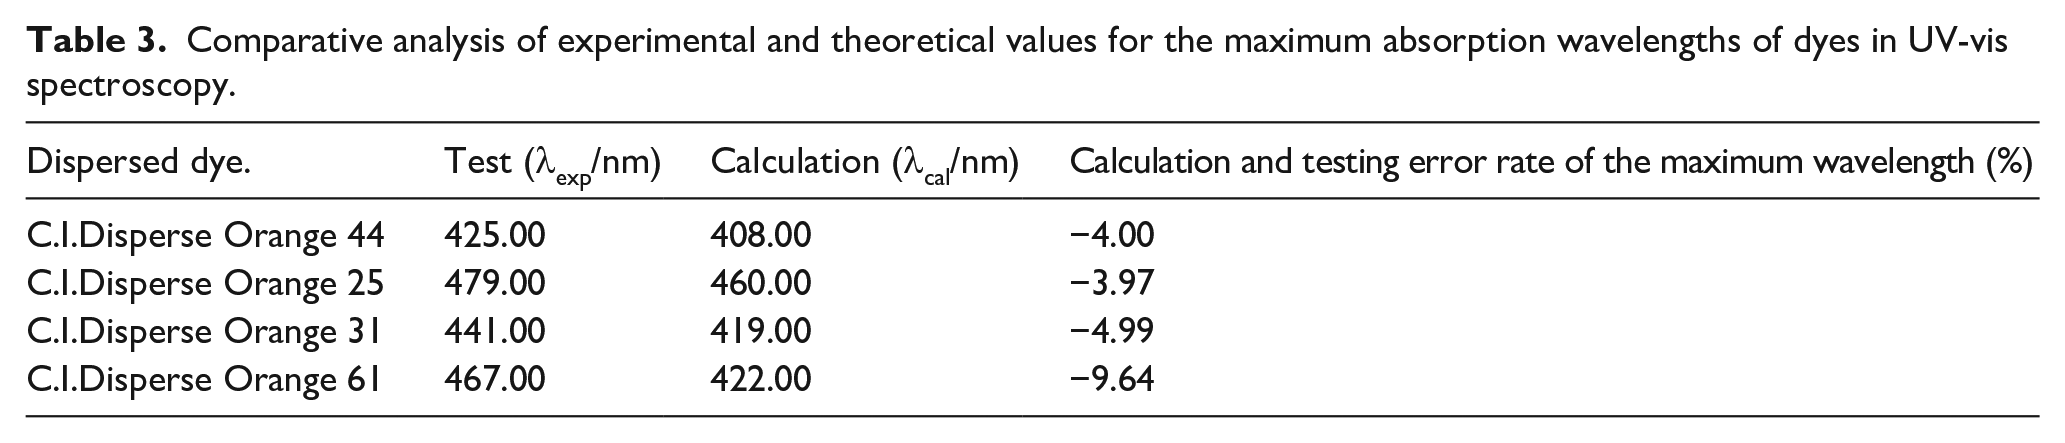
Using Gaussian calculations with the CAM-B3LYP functional and the def2-TZVP basis set, augmented with diffuse functions (ma-method), the maximum absorption wavelengths of the four disperse dyes were determined. These calculated values were compared with the maximum absorption wavelengths measured by the Shimadzu UV-2600 UV-Vis spectrophotometer, as shown in Table 3.
The data presented in Table 3 indicate a discrepancy of approximately −10.0% between the experimentally measured and theoretically calculated maximum absorption wavelengths of the four dyes using CAM-B3LYP/def2-TZVP.
Multiple factors could contribute to this discrepancy. Firstly, variations in environmental and experimental conditions are significant: the UV2600 instrument operates under specific conditions, such as temperature and concentration, which may deviate from the standard conditions postulated in theoretical calculations. Secondly, inherent limitations of theoretical calculations play a role: quantum chemistry calculations performed using Gaussian are dependent on the selected functional and basis set. The chosen functional might not comprehensively describe electronic interactions, and the size and type of the basis set could restrict the accuracy of these calculations. Theoretical calculations may fail to fully account for electron correlation or polarization effects, which are more pronounced in actual dye molecules.
To facilitate a more intuitive comparison of the differences in maximum absorption wavelengths of the four disperse dyes, as calculated using Gaussian and measured via UV-Vis spectrophotometry, the maximum absorption wavelengths derived from UV-Vis spectra were juxtaposed with the excitation states corresponding to different Boltzmann distribution proportions, as determined using Gaussian. These data were subsequently plotted as conformation-weighted UV-Vis spectra utilizing Multiwfn, as depicted in Figure 3.

Conformation-weighted average ultraviolet-visible light absorption spectra of four disperse dyes: (a) C.I. Disperse Orange 44, (b) C.I. Disperse Orange 25, (c) C.I. Disperse Orange 31, and (d) C.I. Disperse Orange 61.
As depicted in Figure 3, there are notable discrepancies between the ultraviolet-visible absorption spectra obtained through computational methods and experimental measurements for the four disperse dyes. Specifically, the calculated results for C.I. Disperse Orange 44, C.I. Disperse Orange 25, and C.I. Disperse Orange 31 display minimal differences from the experimental data, particularly across varying Boltzmann distribution ratios, where the absorption peaks show negligible variation. This observation indicates strong consistency between the calculated and experimental results. However, for C.I. Disperse Orange 61, the discrepancies are more pronounced. The absorption peak discrepancies between the calculated and experimental ultraviolet-visible absorption spectra are the most significant, indicating a greater mismatch between the computational and experimental results for this dye. The molecular structure of C.I. Disperse Orange 61 includes a para-bromine atom, which may contribute to the larger discrepancies observed between the calculated and experimental ultraviolet-visible absorption spectra. Quantum chemical calculations may not fully account for electronic effects, spatial effects, or the influence of the bromine atom on the molecule’s electronic orbitals, which could result in a larger error.
Hole-electron analysis of disperse dyes
Hole-electron analysis, an electron excitation analysis method within Multiwfn, employs Gaussian functions to transform hole and electron distributions into smooth profiles, facilitating easier examination and comparison. This technique is instrumental in determining the mechanisms and types of electron excitations.
Select the conformation exhibiting the highest Boltzmann distribution proportion for each of the four disperse dyes, and analyze the electron excitation characteristics and energies, exploring the correlation between molecular structure and excitation energy.
By importing Gaussian output files into Multiwfn, electron excitation analyses generate cube files that record specific function values at uniformly distributed points within three-dimensional space. VMD visualizes these cube files, displaying both electron excitation holes and electron isosurfaces, as well as Chole-Cele isosurfaces, as depicted in Figure 4. In these visualizations, green signifies electron distribution, while blue denotes hole distribution. The left column displays regions colored green for electron distribution and blue for hole distribution, illustrating the spatial separation of electrons and holes during excitation. The right column depicts Chole-Cele isosurfaces, detailing regions where holes and electrons overlap or separate within the molecular structure, thereby aiding in the analysis of charge transfer and spatial relationships during excitation. These visualizations facilitate an understanding of electron excitation characteristics and the influence of different substituents on the molecular structures and behaviors of disperse dyes.
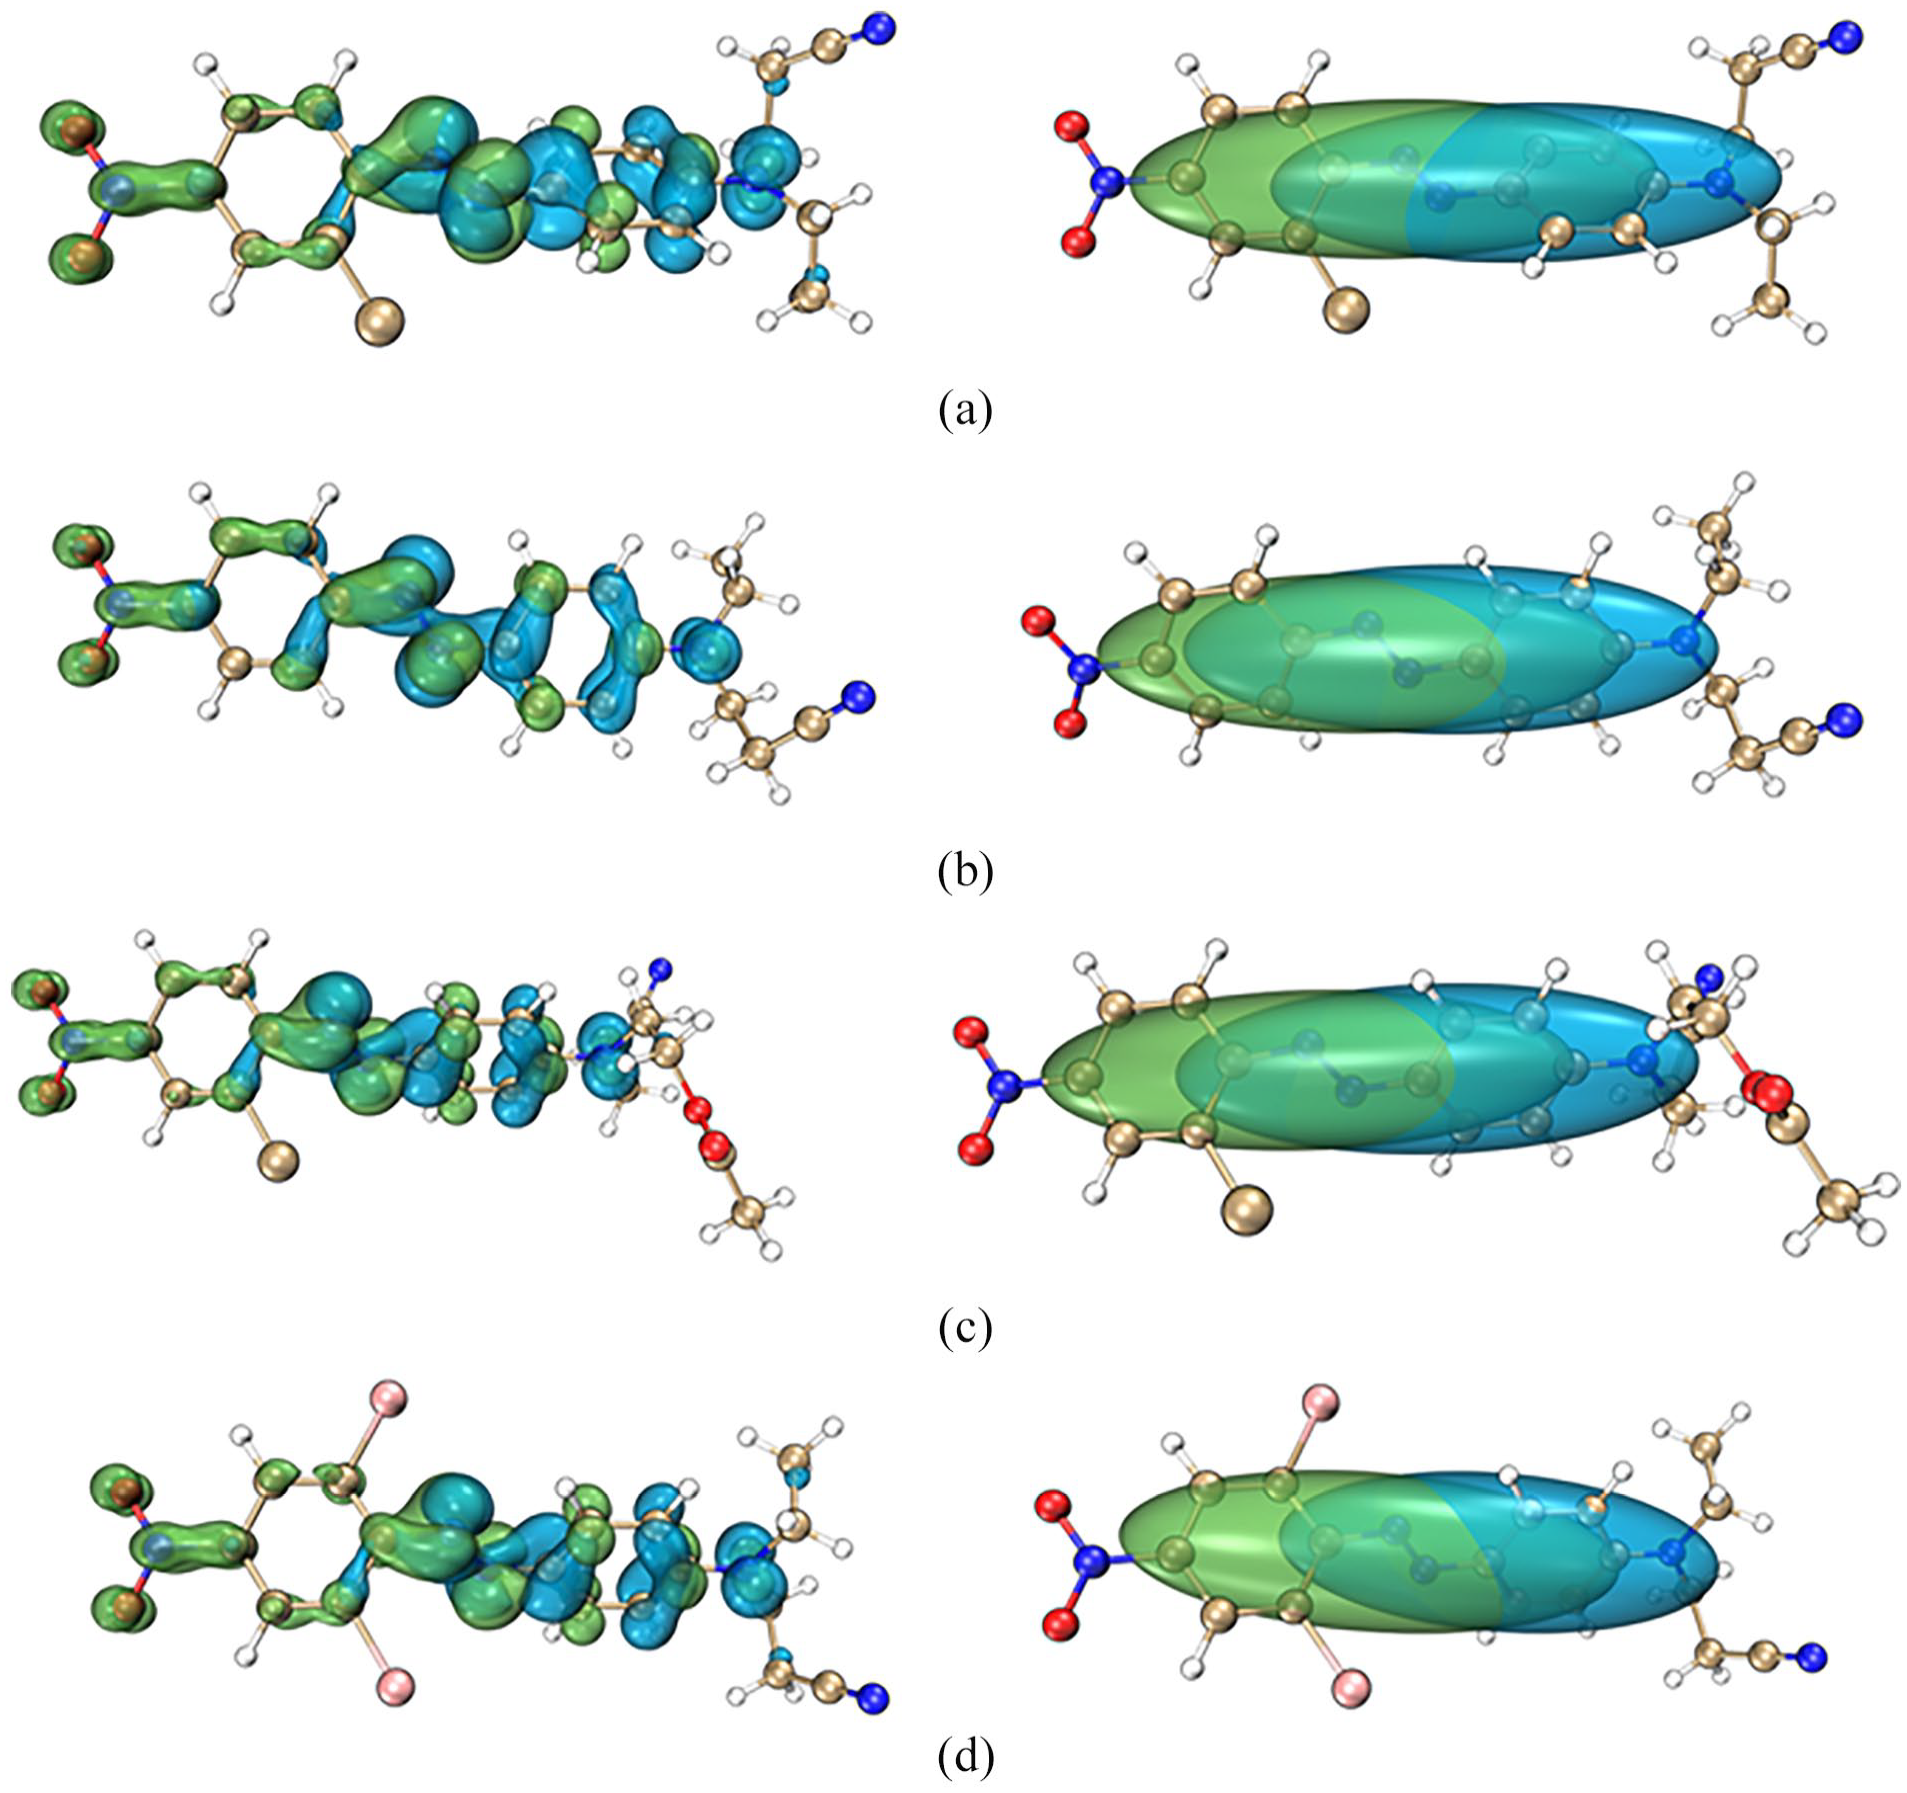
Visualization of hole-electron isosurfaces (left) and Chole-Cele isosurfaces (right) during the electronic excitation of disperse dye molecules, (a) C.I. Disperse Orange 44, (b) C.I. Disperse Orange 25, (c) C.I. Disperse Orange 31, and (d) C.I. Disperse Orange 61.
Parameters calculated by Multiwfn are presented in Table 4. Figure 4 illustrates electron transfer from coupling components to diazo components across all four disperse dyes, characterized by broad distributions of holes and electrons, which result in relatively large H(Å) values. Sr values signify a high degree of overlap between holes and electrons in all four dyes, with markedly negative t(Å) values suggesting minimal hole-electron separation. Although D(Å) values are relatively high, signifying a considerable distance between hole and electron centroids, the integration of data from Figure 4 and Table 4 suggests that valence excitation charge transfer is the predominant excitation mechanism in all four disperse dyes.
Parameters of holes and electrons in the electronic excitation process of disperse dye molecules.
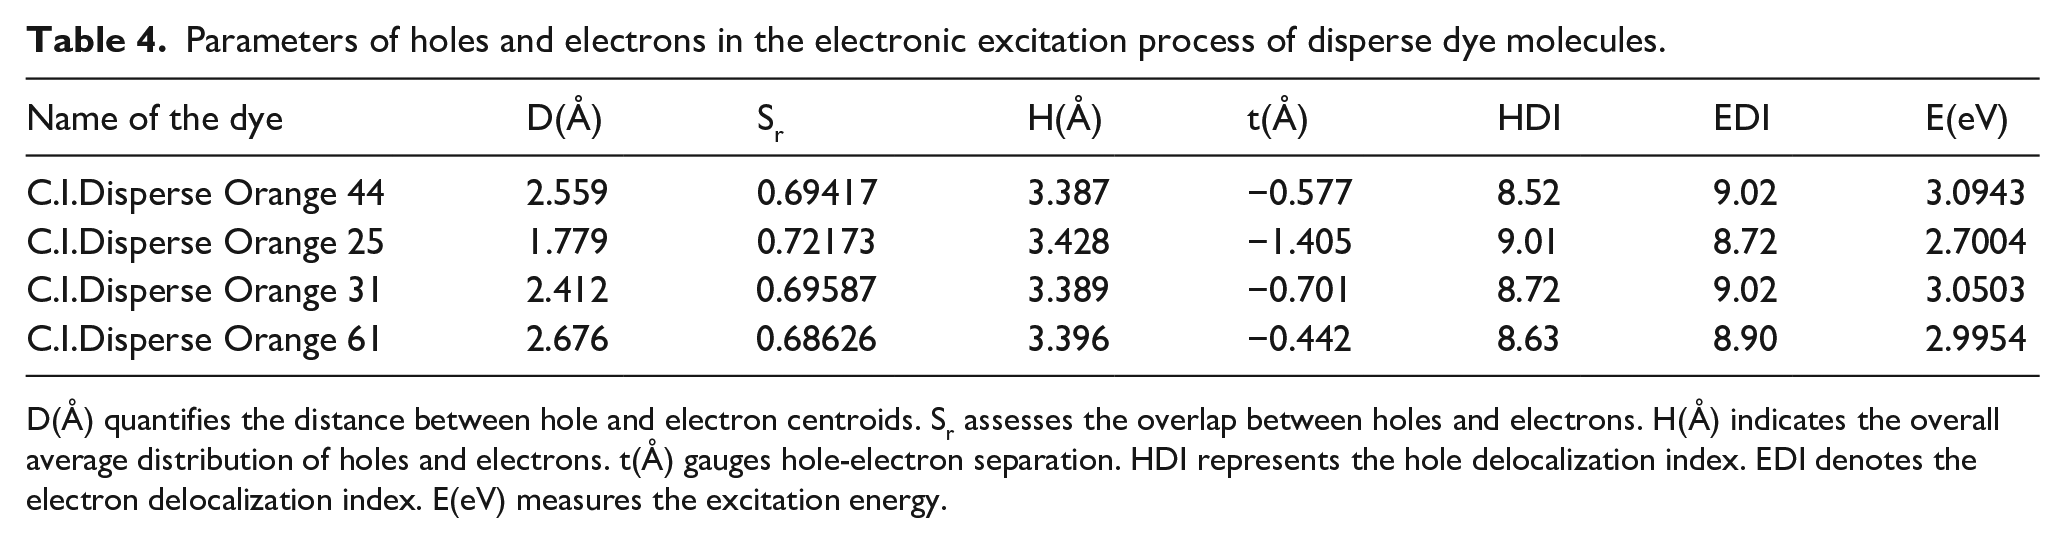
D(Å) quantifies the distance between hole and electron centroids. Sr assesses the overlap between holes and electrons. H(Å) indicates the overall average distribution of holes and electrons. t(Å) gauges hole-electron separation. HDI represents the hole delocalization index. EDI denotes the electron delocalization index. E(eV) measures the excitation energy.
Figure 4 illustrates the structural differences between C.I. Disperse Orange 44 and C.I. Disperse Orange 31; C.I. Disperse Orange 44 features a cyano group on its coupling component, whereas C.I. Disperse Orange 31 incorporates an ester group. The stronger electron-withdrawing capability of the cyano group, compared to the ester group, results in a shorter maximum absorption wavelength for C.I. Disperse Orange 44. According to Table 4, C.I. Disperse Orange 31 exhibits lower D(Å) and t(Å) values than C.I. Disperse Orange 44, indicating reduced electron transfer amplitudes from ground to excited states in C.I. Disperse Orange 31. Furthermore, the excitation energy of C.I. Disperse Orange 31 is lower than that of C.I. Disperse Orange 44, confirming the inverse relationship between photon energy and wavelength. This results in a longer maximum absorption wavelength for C.I. Disperse Orange 31 compared to C.I. Disperse Orange 44, aligning with both experimental and calculated results.
Figure 4 illustrates that C.I. Disperse Orange 61 possesses two additional electron-withdrawing bromine groups on its diazo component compared to C.I. Disperse Orange 25, which likely contributes to a deeper color effect and a red shift. However, experimental data reveal that the maximum absorption wavelength of C.I. Disperse Orange 61 is shorter than that of C.I. Disperse Orange 25. This discrepancy could stem from significant steric hindrance introduced by the bromine groups, which impacts the molecular conjugation system and potentially induces a blue shift. Structural distortions that reduce the effective conjugation system length are observed in the excited state calculations for C.I. Disperse Orange 61, as depicted in Figure 1.
Table 4 indicates that C.I. Disperse Orange 61 exhibits higher D(Å) and t(Å) values, alongside lower Sr values, compared to C.I. Disperse Orange 25, suggesting greater electron transfer amplitudes. Furthermore, the excitation energy of C.I. Disperse Orange 25 is lower than that of C.I. Disperse Orange 61, confirming the inverse relationship between photon energy and wavelength. This results in a longer maximum absorption wavelength for C.I. Disperse Orange 25 than C.I. Disperse Orange 61, aligning with the calculated results.
Optimization of fitting model for maximum absorption wavelength of dispersed dyes
To mitigate the complexity of experimental testing, quantum chemical calculations were employed to predict the maximum absorption wavelengths of dyes based on their molecular structures. The theoretically calculated values for the maximum absorption wavelengths of C.I. Disperse Orange 44, C.I. Disperse Orange 25, and C.I. Disperse Orange 31 were compared to and fitted with their corresponding experimental values. The linear equation obtained, as presented in equation (1), serves as the predictive model for the maximum absorption wavelength of disperse dyes. The coefficient of determination (R²) of this equation is 0.99, indicating an excellent fit, and further demonstrating the model’s capacity to effectively predict the maximum absorption wavelength of dyes.

Here, λexp represents the experimental maximum absorption wavelength, and λcal denotes the theoretical maximum absorption wavelength.
Using the optimized fitting equation (1), the C.I. Disperse Orange 61 dye, as listed in Table 3, was subjected to optimization and fitting calculations, yielding a maximum absorption wavelength of 441.28 nm. This value demonstrates a reduction in error compared to the pre-optimization fitting calculations and experimental results, decreasing from −9.64% to −5.51%. This indicates an improvement in prediction accuracy, though a discrepancy remains.
For comparative purposes, the maximum absorption wavelengths of C.I. Disperse Orange 30 and C.I. Disperse Orange 73, as used in Qiu Jingsi’s experiments, were computed under identical theoretical conditions and juxtaposed with experimental data, as presented in Table 5. 32
Optimization prediction of maximum absorption wavelength of disperse dyes.

λexp denotes the experimental maximum absorption wavelength, λcal represents the theoretical maximum absorption wavelength, and λpre refers to the optimized predicted maximum absorption wavelength.
It is evident that, after optimization fitting, the calculated results are in much closer agreement with the experimental values, indicating that the maximum absorption wavelength model for disperse dyes yields accurate simulation results. The optimized calculation and experimental error for the maximum absorption wavelength of C.I. Disperse Orange 30 is 3.13%, while for C.I. Disperse Orange 73, the error is −0.33%. The calculated predictions closely approximate the actual values, demonstrating a significant degree of practical feasibility for real-world application.
Conclusion
Through experimental testing and a series of quantum chemical calculations, the maximum absorption wavelength values for the disperse dyes were obtained, both experimentally and computationally, and an optimization-based fitting prediction model for the maximum absorption wavelength was subsequently established. The experimental results indicate that for the selected azo orange series disperse dyes, the maximum absorption wavelength model yields predicted values with minimal error (within 5.51%) when compared to the experimentally measured values. This demonstrates that when selecting a set of disperse dyes with specific molecular structures, quantum chemical calculations can predict the maximum absorption wavelength with a certain degree of accuracy. However, due to limitations such as computational constraints and the relatively small dye sample size, the obtained maximum absorption wavelength model still presents opportunities for further optimization. In the future, expanding the dye sample set and diversifying computational conditions may reveal new patterns and insights. Furthermore, a deeper exploration of the optical properties of dyes could facilitate the establishment and optimization of alternative computational models for fitting and prediction, thereby enabling the accurate prediction of various properties of disperse dyes within a specified accuracy range. Such models could be applied to various categories of disperse dyes, offering a foundation for the design of novel materials, thereby reducing experimental costs and time, and enhancing research and development efficiency.
Footnotes
Declaration of conflicting interests
The author(s) declared no potential conflicts of interest with respect to the research, authorship, and/or publication of this article.
Funding
The author(s) disclosed receipt of the following financial support for the research, authorship, and/or publication of this article: This work was supported by (Applied Research Project of Public Welfare Technology of Zhejiang Province (No. LGF20E030002)).