
Abstract
This study’s primary goal is to use a fuzzy logic expert system (FLES) to anticipate and create a model for the impact of thread density on plain-woven fabric’s thermal characteristics. Every plain-woven fabric utilized in this study has 100% cotton fiber in it. The input variables for this fuzzy logic expert system are PPI and EPI, while the output variables are thermal transmittance, thermal conductivity, and CLO. It is quite difficult to give the engineers a statistically or mathematically based forecasting model. On the other hand, a large volume of trial data is needed for artificial neural networks (ANN) and adaptive neuro-fuzzy inference systems (ANFIS), which will take a lot of time and effort to maintain. Fuzzy expert systems, on the other hand, may effectively map nonlinear domains and provide a viable model even with a small quantity of experimental data. New experimental results have validated the model in the current study. Predicting production might be a more beneficial approach for industrial practitioners than using the current trial-and-error method. The root mean square, mean absolute error percentage, and coefficient of determination (R2) of CLO, thermal conductivity, and thermal transmittance between the expected and experimental values were determined to be, respectively, 0.002, 0.001, 0.802; 0.857%, 2.642%, 2.359%; and 0.994, 0.969, and 0.955. The results validate the model’s predictions for the CLO, thermal conductivity, and thermal transmittance of plain-woven fabric in the textile sector, and it was discovered that FLES is capable of accurately predicting the result.
Keywords
Introduction
Clothing comfort is the subjective and objective feelings or sensations of happiness when a person wears it. In a broad sense, clothing comfort can be broken down into three categories. The first category is psychological comfort. This phenomenon is intricately linked to the realm of fashion and encompasses the emotions of self-assurance, contentment, and congruence with individual, cultural, or societal identity that garments can evoke. Second is tactile comfort, which includes the mechanical interaction of the fabric with skin and is strongly correlated with the mechanical and surface properties of the fabric; and third is thermal comfort, which is connected to the ability of the fabric to regulate skin temperature through heat and moisture transfer.1,2 It is governed by many parameters like the ability to transfer heat and moisture from the human body to the outer environment and how it can adapt with different climate conditions. Thermal comfort is attained when an individual experiences a state of stability and comfort in their body temperature. Accurate determination of thermal comfort in garments is crucial to assure suitable end uses and facilitate product development. 3 Thermal conductivity is an important material attribute because it influences heat flow. To maintain thermal equilibrium, heat can be transferred from clothing to the surrounding area by conduction, convection, and radiation. In the technological design of protective clothing, textile thermal insulation properties are crucial. The purpose of a fabric is to function as an insulator in order to prevent heat loss from the body to the outside environment in the event of extreme cold. 4 This requires that the fabric have either strong thermal resistance or low thermal conductivity. A person’s thermal stability must be maintained by maintaining the thermal equilibrium between body heat production and loss in order to ensure thermal comfort.5,6 When heat loss and heat production are equal, the human body maintains thermal balance with its environment. This relationship between generation and loss of heat can be mathematically expressed using following the heat balance equation.7,8

Or

Here, M represents metabolic rate (W/m²). W stands for external work (W/m²). Cv, Ck & R denotes heat loss through convection, conduction, and radiation (W/m²) respectively. Esk represents heat loss through skin via evaporation (W/m²), and Eres represents the evaporative heat loss due to respiration (W/m²). Finally, Cres is the sensible heat loss associated to respiration (W/m²). People of different shapes and sizes may utilize the equation since all of the components are represented per unit area of body surface.
The thermal insulation property of apparel is expressed in CLO. It plays a key role in how well clothing maintains a balanced and pleasant thermal environment for the end user. Clothes serve as a crucial barrier between the body and the outside world, and their ability to regulate heat flow is closely correlated with their CLO value. An optimal CLO value ensures thermal insulation in cold temperatures by minimizing heat dissipation and effectively preserving the body’s inherent warmth. On the other hand, in warmer areas, an optimal CLO value avoids overheating by enabling excess heat to escape and permitting appropriate ventilation. One CLO is equal to the intrinsic insulation of a business suit worn by a sedentary, resting guy at 21°C, 50% RH, and 0.1 m/s air ventilation in a typically ventilated room. Under these circumstances, 1 CLO of clothes equals 0.155 m2 K/W. 9
The fabric’s thermal conductivity is an essential property that directly affects the thermal comfort of clothing. This property determines the rate at which heat is transferred through the fabric and, consequently, the garment’s ability to keep the wearer at a comfortable temperature. Optimizing thermal conductivity in clothing needs a careful balance of insulation and breathability. Advances in textile technology continue to drive the development of clothing that provides adequate thermal comfort, making it feasible for people to be comfortable in a wide range of temperatures and activities. The following formula describes how to measure the thermal conductivity (λ) of homogeneous materials10,11:

where: Q = the amount of heat transmitted, A = the area, Δt = the temperature difference, h = the sample thickness.
Therefore, the construction of a precise model that links the process and quality aspects may aid industry practitioners in predicting the thermal comfort of plain-woven fabric. The prediction of thermal comfort is facilitated by three prevalent modeling techniques: mathematical models, statistical analytic models, and soft computing techniques. These techniques are experiencing a growing trend in popularity. Several researchers employ soft computing systems to illustrate various property characterizations for improved practitioner performance. To demonstrate the relative influence of different inputs on yarn strength, Hafez, 12 Smith and Waters 13 developed statistical regression models and the beta co-efficient analysis. A number of researchers have created mathematical models that are incredibly alluring because they are built on the fundamental principles of the basic sciences and give a thorough understanding of the process procedure.13–16 But based of the assumptions used in the development of this model, the mathematical model’s forecasting accuracy is not particularly encouraging. Furthermore, statistical, and mathematical modeling are insufficient to capture the non-linear interaction between inputs and outcomes. In order to determine the impacts of the chosen sewing parameters on seam strength in denim fabric, Ünal et al. 17 created a model, and the outcomes were statistically and graphically analyzed. On the other hand, Sarkar et al. used FLES to develop models the for prediction the seam strength of denim garments.18,19 In this study, linear density (Tex) and stitches per inch (SPI) were used as input variable to predict seam strength in denim garments. Hung et al. 20 experimented with the effect of laser processing parameters (time, resolution and grayscale) on a 100% cotton denim fabric and developed prediction models based on linear regression (LR) and artificial neural network (ANN). In this study, ANN and LR techniques are presented for predicting the color properties of laser-treated denim fabric. The findings of the study indicate that the artificial neural network (ANN) approach had outstanding ability to predict in comparison to the linear regression (LR) technique, resulting in more accurate forecasts. Hossain et al. studied the comparison of the accuracy of developed prediction models of the color strength of knitted viscose fabric, considering the effect of varying concentrations of dye, salt, and alkali. They developed two models: one based on fuzzy logic (FL), and another based on artificial neural network (ANN) considering same input parameters. Their findings indicated that both the ANN and FL models had significant efficacy and precision in forecasting cloth color intensity. However, they also found that the ANN prediction model had exhibited better predictive results compared to the FL model. 21 Luo et al. developed a model of clothing thermal comfort based on fuzzy neural networks (FNN). This study was carried out for the evaluation of human thermal comfort in a functional textile design system. 22 The core temperature may act as an indicator of the cumulative impact of changes in skin temperature, known as adaptation. Another study using a computer program developed in Visual C++ to illustrate the comfort properties of plain weave fabrics made entirely of cotton. 23 This research reported that the yarn sett and yarn linear density of a particular plain-woven cloth are the only inputs required to run the ready-to-implement software. The program’s output was confirmed by comparing it to experimental data collected using Alambeta, Permetest, and FX 3300 air permeability tester equipment, respectively. The majority of the fabric samples produced thermal absorptivity, thermal resistance, and water-vapor resistance values with acceptable relative errors of less than 25%. Another recent approach was also developed to predict the thermal protection and thermo-physiological comfort capabilities of the fabrics used in firefighter clothing using multiple linear regression and artificial neural network models. 24 The thermo-physiological comfort properties of woven fabrics were examined by researchers in relation to many aspects of cotton yarn, including count, twists, coefficient of variation of mass (CVm), neps, hairiness, thick and thin areas, strength, and elongation. The study involved the measurement and statistical evaluation of many properties of woven fabric, including thermal resistance, thermal conductivity, thermal absorptivity, air thermal diffusivity, air permeability, and relative water vapor permeability. The results indicated no significant changes, although yarn characteristics did not affect the thermal diffusivity or water vapor permeability of the woven fabric. 25 An investigation discovered thermal comfort components in 65/35 and 33/67 polyester/cotton blend fabrics with various weave patterns, including 2/2 twill, matt twill, cellular, and diced weaves often used in clothing. The findings indicate that both fabric structure and constituent fiber quality impact the thermal comfort capabilities of garment woven materials. Cellular weave, which is a derivative of sateen weave, and diced weave, a complex weave, exhibit superior thermal resistance, rendering them very suitable for regions characterized by low temperatures. In contrast, the matt twill weave, a descendant of the sateen weave, and the 2/2 twill weave have the lowest resistance to water vapor thermal expansion, making them suited for usage in humid regions. 26 Recent research investigated the impact of yarn spacing, yarn width, fabric thickness, compressing coefficients of air layers, and weave type on heat conductivity. The goal of this study is to investigate the interaction between heat transfer characteristics, fabric structure, and yarn properties. It employs a parametric mathematical model to estimate the effective heat conductivity of single-layer woven textiles. The model shows polynomial fitting curves with varied orders that describe the relationships between effective thermal conductivity and each parameter. The weaving type has a significant impact on effective heat conductivity by changing the number of distinct parts and their area ratios. 27 Researchers predicted comfort based on the fabric’s physical and structural parameters using a specific algorithm that took into account the following input parameters: fabric, GSM, fabric thickness, thermal conductivity, air permeability, and moisture vapor transmission rate. Different plain-woven textiles of the same composition (i.e. 100% cotton) are evaluated for the various criteria listed above. This prediction model was determined to be satisfactory when tested on certain new fabric samples to determine the model’s appropriateness and accuracy. 28
To forecast characteristics and optimize process factors, the textile industry has adopted a variety of modeling tools. For instance, modeling approaches based on genetic algorithms (GA),29,30 ANN, 31 adaptive neuro fuzzy inference system (ANFIS) models, 32 and others have been used to model and predict various textile qualities. Additionally, these techniques significantly improved the accuracy of selecting the right process parameters.33–36 For instance, in order to function effectively, the most popular textile approaches, like ANN and ANFIS, typically need a greater amount of data.30,37 On the other hand, the fuzzy inference system (FIS), which is based on fuzzy logic and can readily translate the knowledge of experts into a set of inference system-based rules, is a very potent modeling tool to get around the limitations of the ANN and ANFIS models.18,38 The fuzzy mathematical set theory proposed by Zadeh (1965) served as the foundation for the fuzzy inference system, a derivation of crisp logic. 39 It is a multi-valued logic artificial intelligence, and its implementation is simpler than that of other models due to its capacity to operate with a small quantity of experimental data in a non-linear, trial-and-error, poorly defined, and complex textile domain.40,41 To the author’s best knowledge, there has been no significant research work carried out regarding the prediction of thermal comfort considering important fabric parameters like the EPI and PPI of woven fabric. As a result, in our current study, we used a fuzzy logic expert system to construct a model to predict the CLO value, thermal conductivity, and thermal transmittance of plain-woven fabric, considering these two parameters. 42 The main elements of the fuzzy expert system are shown in Figure 1.

Introductory elements of fuzzy inference systems.
It is necessary to build membership functions for both input and output functions. The membership functions quantify the degree to which a given element is a component of the set. The triangle membership function is the most basic and frequently used among the various types of membership functions, including the trapezoid, Gaussian, and triangle functions.38,43,44 Mamdani and Sugeno are the names of the two categories of fuzzy expert rule bases. In this study, Mamdani rules have been used. Fuzzy rules form the foundation of an expert system that uses fuzzy logic.19,40,45 Mamdani are conditional statements that describe connections between the fuzzy input variables and the fuzzy output variables. Each rule consists of an antecedent (the “if” component) and a consequent (the “then” section). The antecedent comprises conditions based on the linguistic terms of the input variables, whereas the consequent describes the linguistic terms of the output variable. For example, if X (input) is high and Y (input) is low, then Z (output) is medium.40,46 A fuzzy expert system’s decision-making logic is extremely important since it may provide choices that are comparable to human judgments. In this study, we used the Mamdani max-min fuzzy inference approach to guarantee a linear interpolation of outputs across rules. The last part of fuzzy logic expert system is the defuzzification interface.30,37 The defuzzification technique involves the conversion of fuzzified outputs into a single defuzzified crisp value. Among various defuzzification approaches, there are the centroid, center of total, mean of maxima, and left-right maxima. But the most widely used defuzzification technique is centroid method. This method is also known as center of gravity or center of area. The defuzzied value, z*, in this method, can be defined by utilizing following algebraic expression (3) 47

Here
Materials & methodology
Fabric
The experiment utilized plain woven cotton fabrics manufactured by Shantex Apparel Ltd. These fabrics had a warp and weft count of 40 Ne, with EPI ranges ranging from 90 to 125 and PPI ranges ranging from 65 to 95. The selected range of EPI and PPI is typically utilized in the industry for the production of plain-woven fabric. Figure 2 displays a microscopic picture of the plain-woven fabric sample. A microscope (DMM 2000) was utilized to capture a microscopic image.
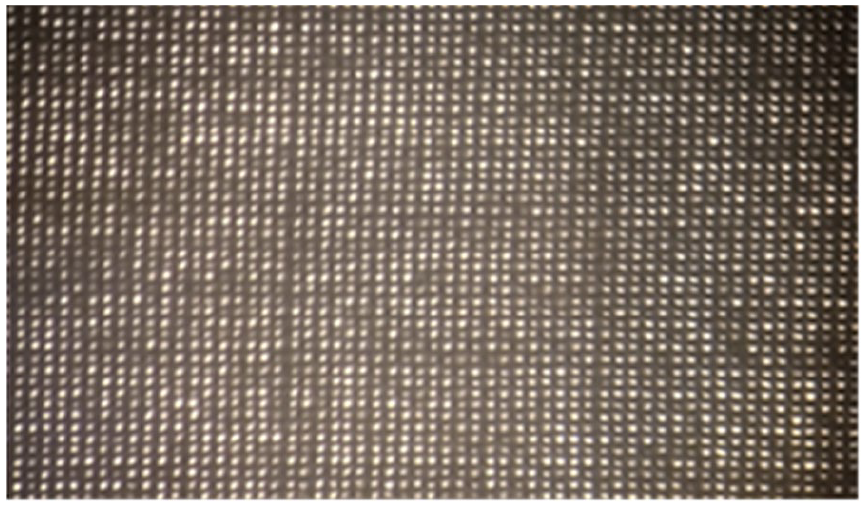
Microscopic image of plain-woven fabric sample.
CLO, thermal conductivity & thermal transmittance measurement
The CLO value, thermal conductivity, and thermal transmittance were determined for this experiment at the Apparel Engineering Lab of the Bangladesh University of Textiles using guarded hot plate equipment according to ISO 8302:1991 48 (Figure 3). The guarded hot plate method is a steady-state measurement method that determines a material’s CLO, thermal conductivity, and thermal transmittance using the electrical power output of a hot plate with directed heat conduction. An electrically heated plate heats the sample from one side. The values of both input variables (EPI and PPI) and the respective experimental values of the output variables (CLO, thermal conductivity, and thermal transmittance) for sixteen different samples are shown in Table 1.

The guarded hot plate equipment for measuring CLO, thermal conductivity, and thermal transmittance.
Experimental result of CLO, thermal conductivity, and thermal transmittance.

Development of fuzzy prediction model
EPI and PPI were employed as input factors, and CLO (C), thermal conductivity (TC), and thermal transmittance (TT) were used as output variables to create the fuzzy prediction model for woven fabric. The MATLAB Fuzzy Logic Toolbox (version 7.10.0) was utilized to develop the suggested fuzzy prediction model for CLO, TC, and TT. Five linguistic fuzzy sets—Medium (M), Medium High (MH), High (H), Very High (VH), and Very Very High (VVH)—were used to describe the fuzzified input variable EPI. Four fuzzy numbers—Low (L), Medium (M), Medium High (MH), and High (H)—were used for the PPI input variables. These linguistic fuzzy sets encompassed the whole range of input and output factors for determining woven fabric CLO, TC, and TT. Table 2 displays the linguistic fuzzy sets for input-output parameters. The following functions, (4)–(8) aid in the fuzzification of the utilized factors:


where i1 is the first input (EPI) and i2 is the second input (PPI) and o1, o2, and o3 are the output (CLO, TC, TT) variables respectively.
Fuzzy linguistic sets for input-output parameters.

Triangular-shaped membership functions were taken into consideration for both the input and output variables in this fuzzy prediction model since they were the most accurate of all the membership functions.
A triangular membership function plot in fuzzy logic provides a concise visual representation of the degree to which elements belong to a fuzzy set or linguistic variable across a defined range of values. With its characteristic triangular shape determined by three parameters (minimum value, peak value, and maximum value), it illustrates how membership gradually increases from the lower bound to the peak, and then decreases to the upper bound. This representation allows for intuitive interpretation of fuzzy sets, where the degree of membership at any point along the axis signifies the extent to which an element pertains to the set described by the membership function. For example, in modeling linguistic variables such as “EPI (Ends Per Inch)” with fuzzy sets like “Medium (M),” “Medium High (MH),” “High (H),” “Very High (VH),” “Very Very High (VVH),” triangular membership functions help quantify the uncertainty inherent in human language, facilitating fuzzy reasoning and decision-making processes within fuzzy logic systems.
Figure 4 displays the triangular-formed membership functions created with the MATLAB Fuzzy Toolbox for the fuzzy variables EPI, PPI, CLO, TC, and TT. By utilizing the Mamdani max-min inference technique, the fuzzy sets were integrated into a single fuzzy set. Finally, the fuzzy result was transformed into a crisp, non-fuzzy numeric number using the center of gravity defuzzification approach. For two inputs and four outputs fuzzy system, the fuzzy inference method is expressed in equations (9)–(12) 43


Diagrammatic representation of fuzzy modeling for the prediction of CLO, thermal conductivity, and thermal transmittance.
I1, I2, and O1, O2, O3 the input and output variables, αi is the weighting factor as a measure of the influence of i-th rule to the fuzzy control action, and μAi, μBi, μCi, and μC are the membership functions associated with fuzzy sets Ai, Bi, Ci, and C respectively. The defuzzification module transforms the fuzzy output into a nonfuzzy numeric value (z) as control actions. Among the methods of defuzzification, the center of gravity method is most regularly used, which is calculated from 39 equation (15).

bi represents the position of the singleton in the i-th universe, whereas μi is equal to the membership function of rule i.
In Figure 4, a diagrammatic representation of fuzzy modeling is presented for the prediction of CLO, TC, and TT. Of the 16 rules we have developed for the fuzzy logic expert system, the actions of 4 (Rule -1, Rule-2, Rule-10, and Rule-14) rules are shown to illustrate the fuzzy logic expert system’s prediction process. Other rules are discussed below:
Rule 3: if (EPI is H) and (PPI is H) then CLO is C4, thermal conductivity is TC8, and thermal transmittance is TT3.
Rule 4: if (EPI is MH) and (PPI is H) then CLO is C5, thermal conductivity is TC5, and thermal transmittance is TT2.
Rule 5: if (EPI is VVH) and (PPI is L) then CLO is C5, thermal conductivity is TC6, and thermal transmittance is TT2.
Rule 6: if (EPI is MH) and (PPI is MH) then CLO is C6, thermal conductivity is TC1, and thermal transmittance is TT1.
Rule 7: if (EPI is H) and (PPI is M) then CLO is C4, thermal conductivity is TC2, and thermal transmittance is TT2.
Rule 8: if (EPI is M) and (PPI is M) then CLO is C6, thermal conductivity is TC1, and thermal transmittance is TT1.
Rule 9: if (EPI is H) and (PPI is L) then CLO is C4, thermal conductivity is TC2, and thermal transmittance is TT3.
Rule 11: if (EPI is VVH) and (PPI is M) then CLO is C1, thermal conductivity is TC8, and thermal transmittance is TT9.
Rule 12: if (EPI is VVH) and (PPI is MH) then CLO is C5, thermal conductivity is TC2, and thermal transmittance is TT2.
Rule 13: if (EPI is VVH) and (PPI is M) then CLO is C4, thermal conductivity is TC3, and thermal transmittance is TT3.
Rule 15: if (EPI is M) and (PPI is L) then CLO is C4, thermal conductivity is TC2, and thermal transmittance is TT3.
Rule 16: if (EPI is VVH) and (PPI is H) then CLO is C2, thermal conductivity is TC3, and thermal transmittance is TT4.
Analysis of predictions performance
The effectiveness of the fuzzy logic predictions was evaluated by analyzing the coefficient of determination (R2), root mean square, and mean absolute error%. The equations for these evaluations can be found in equations (14) to (16).


EM stands for the average, Ep for the predicted result, Ea for the actual result, and N are different patterns. Although the coefficient of determination (R2) is probably used to compare a model’s accuracy to that of a meaningless benchmark model, the root mean square shrinks for accurate predictions until it is almost zero. The mean absolute error percentage, which must be zero, is used to represent the discrepancy between the actual and predicted values.
Results and discussion
Fuzzy prediction model execution
Sixteen samples are considered in the fuzzy prediction model’s development, leading to the formation of sixteen rules that will allow the model to anticipate the results of each new sample. While input variables are suggested to the developed fuzzy expert model, the predicted values of output variables are shown by the developed fuzzy expert model by simultaneously synchronizing all sixteen rules that were provided during the construction of the model from experimented data. Figure 5 illustrates an example of how fuzzy logic functions graphically. According to the model, the CLO was C5, thermal transmittance was TT2, and thermal conductivity was TC3 when EPI wash was high (H) and PPI was medium high (MH). For instance, if EPI was 108 and PPI was 80, then CLO was 0.201, TT was 32.5 W/(m2.K), and TC was 0.00845 W/(m.K). In this case, the suggested model successfully produced output results by simultaneously examining all 16 rules to produce the fuzzy output after aggregation and defuzzification.
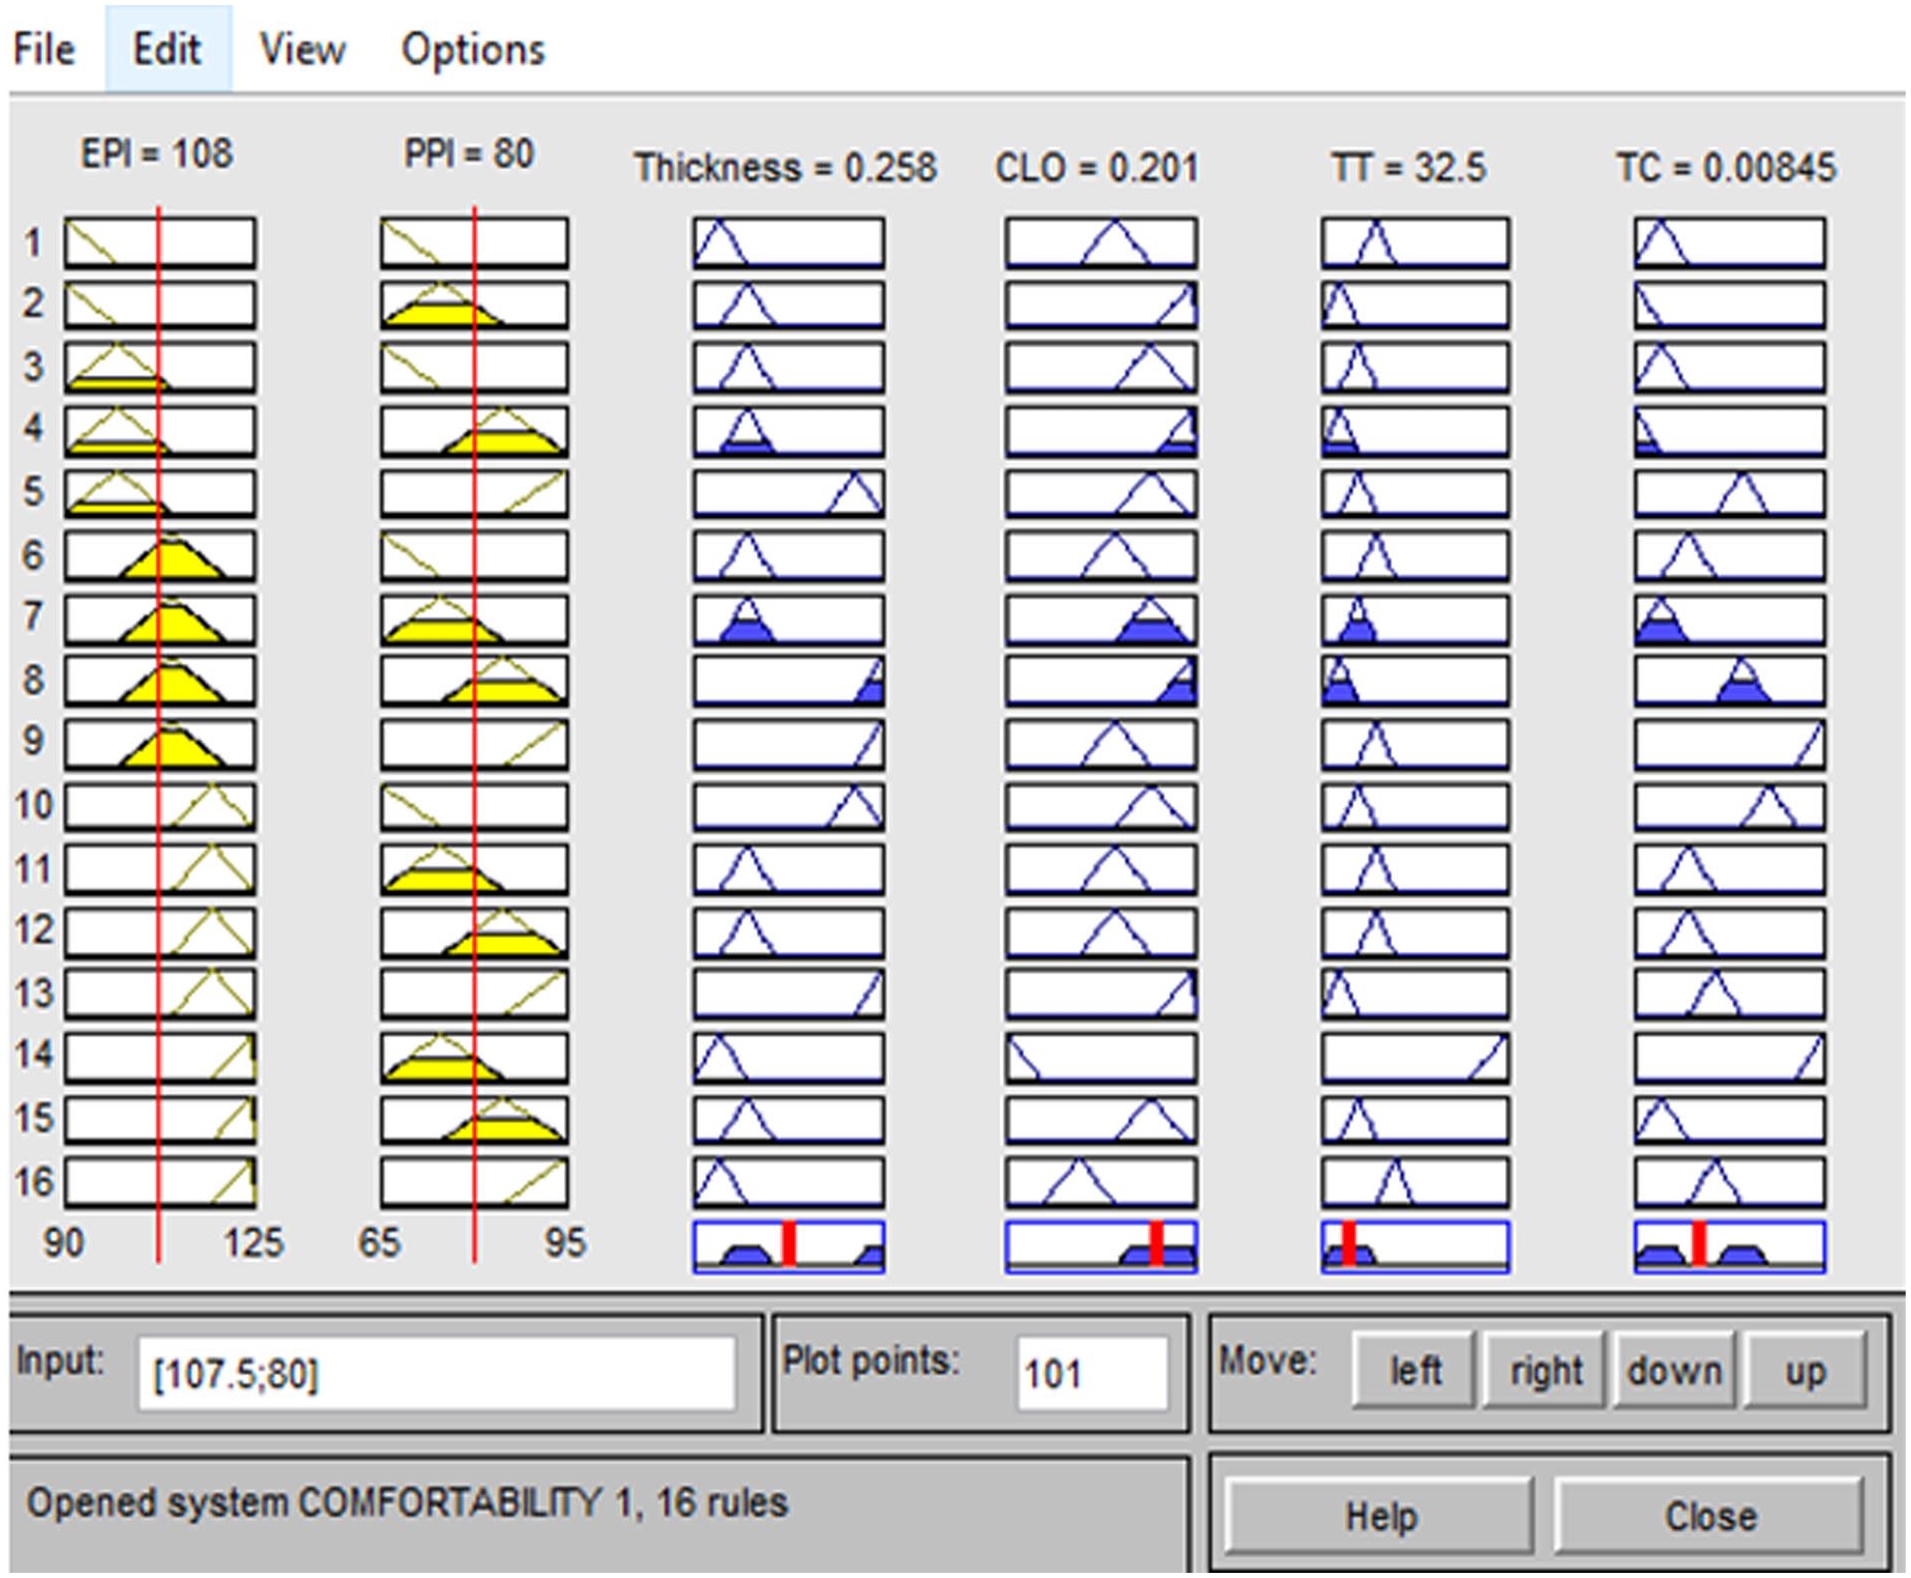
Fuzzy logic model in graphical operation.
Influence of input variables (EPI & PPI) on, thermal conductivity, and thermal transmittance
Figure 6 illustrates the impact of EPI and PPI on CLO. As depicted in Figure 6, a comparable outcome was observed for both EPI and PPI when compared to the CLO value. From the practical data, it has been observed that for a 20% increase in EPI (from 100 to 120), for the same PPI of 95, CLO is increased by 16.86%. From another observation, for the same EPI of 120, with an almost 30% decrease in PPI (95–65), CLO also decreases by almost 19.06%.

Graph displaying the impact of EPI and PPI on CLO value.
It appears that the fluctuation of CLO closely resembles the fluctuation of EPI or PPI when one of the input variables remains constant. However, certain experimental results exhibit slight deviations in the trend of CLO with input variables, potentially attributable to variations in fabric samples obtained from different lots within the industry. The impact of EPI and PPI on thermal transmittance (TT) is shown in Figure 7. It is clearly shown that, with increasing EPI and PPI, thermal transmittance decreased and vice versa. According to the investigated data, TT decreases by 14.42% for a 20% rise in EPI (100–120) within the same PPI of 95. According to another observation, at the same EPI of 120, CLO similarly increases by almost 23.54%, with an almost 30% fall in PPI (95–65). However, it was also shown that under specific EPI and PPI conditions, there was a significant increase in thermal transmittance. Despite the atypical nature of the phenomena, this outcome is also incorporated into the model’s prediction, as it has been observed through empirical experimentation.

Surface plot displaying the impact of EPI and PPI on TT.
Figure 8 illustrates the influence of EPI and PPI on thermal conductivity (TC). There is a correlation between increased EPI and PPI and increasing TC, and vice versa. From the practical investigation, it has been observed that for a 10% increase in EPI (from 100 to 110), for the same PPI of 95, TC is increased by 30.75%. From another observation, for the same EPI of 110, with an almost 12% increase in PPI (85–95), TC also increases by almost 34%. By maintaining one of the input variable constants, it appears that the rising or decreasing pattern of TC is almost identical to the increasing or decreasing pattern of EPI or PPI. Nevertheless, several experimental observations suggest a minor deviation in the trend of increasing or decreasing TC when compared to input variables. This anomaly could potentially be attributed to the utilization of fabric samples collected from diverse lots within the industry. It is generally observed that the increase in EPI and PPI results in increasing CLO, thermal conductivity, and the thermal transmittance of fabric. The use of EPI and PPI leads to an augmentation in fabric thickness, thus resulting in an elevation in fabric-specific volume and a reduction in the fabric packing factor. This is attributed to the presence of a greater quantity of entrapped air, which exhibits diminished heat conductivity and thermal transmittance.

Surface plot displaying the impact of EPI and PPI on TC.
In order to validate the output values of the fuzzy expert model, an additional 7 samples are randomly selected. Table 3 displays the CLO, thermal conductivity, and thermal transmittance of these new samples, as determined by the thermally guarded hot plate mentioned earlier. Additionally, it includes the predicted thermal conductivity values provided by the fuzzy expert model when all 16 rules are applied simultaneously. This validation process is conducted to verify the accuracy of the fuzzy expert model’s output values. And to verify the predicted values here by using equations (14), (15), and (16), the coefficient of determination (R2), mean absolute error percentage, and root mean square were calculated and found to be 0.994, 0.969, and 0.955; 0.857%, 2.642%, 2.359% and 0.002; 0.001; and 0.802 for CLO, thermal conductivity, and thermal transmittance, respectively.
Prediction performance of fuzzy model for CLO, thermal conductivity, and thermal transmittance.
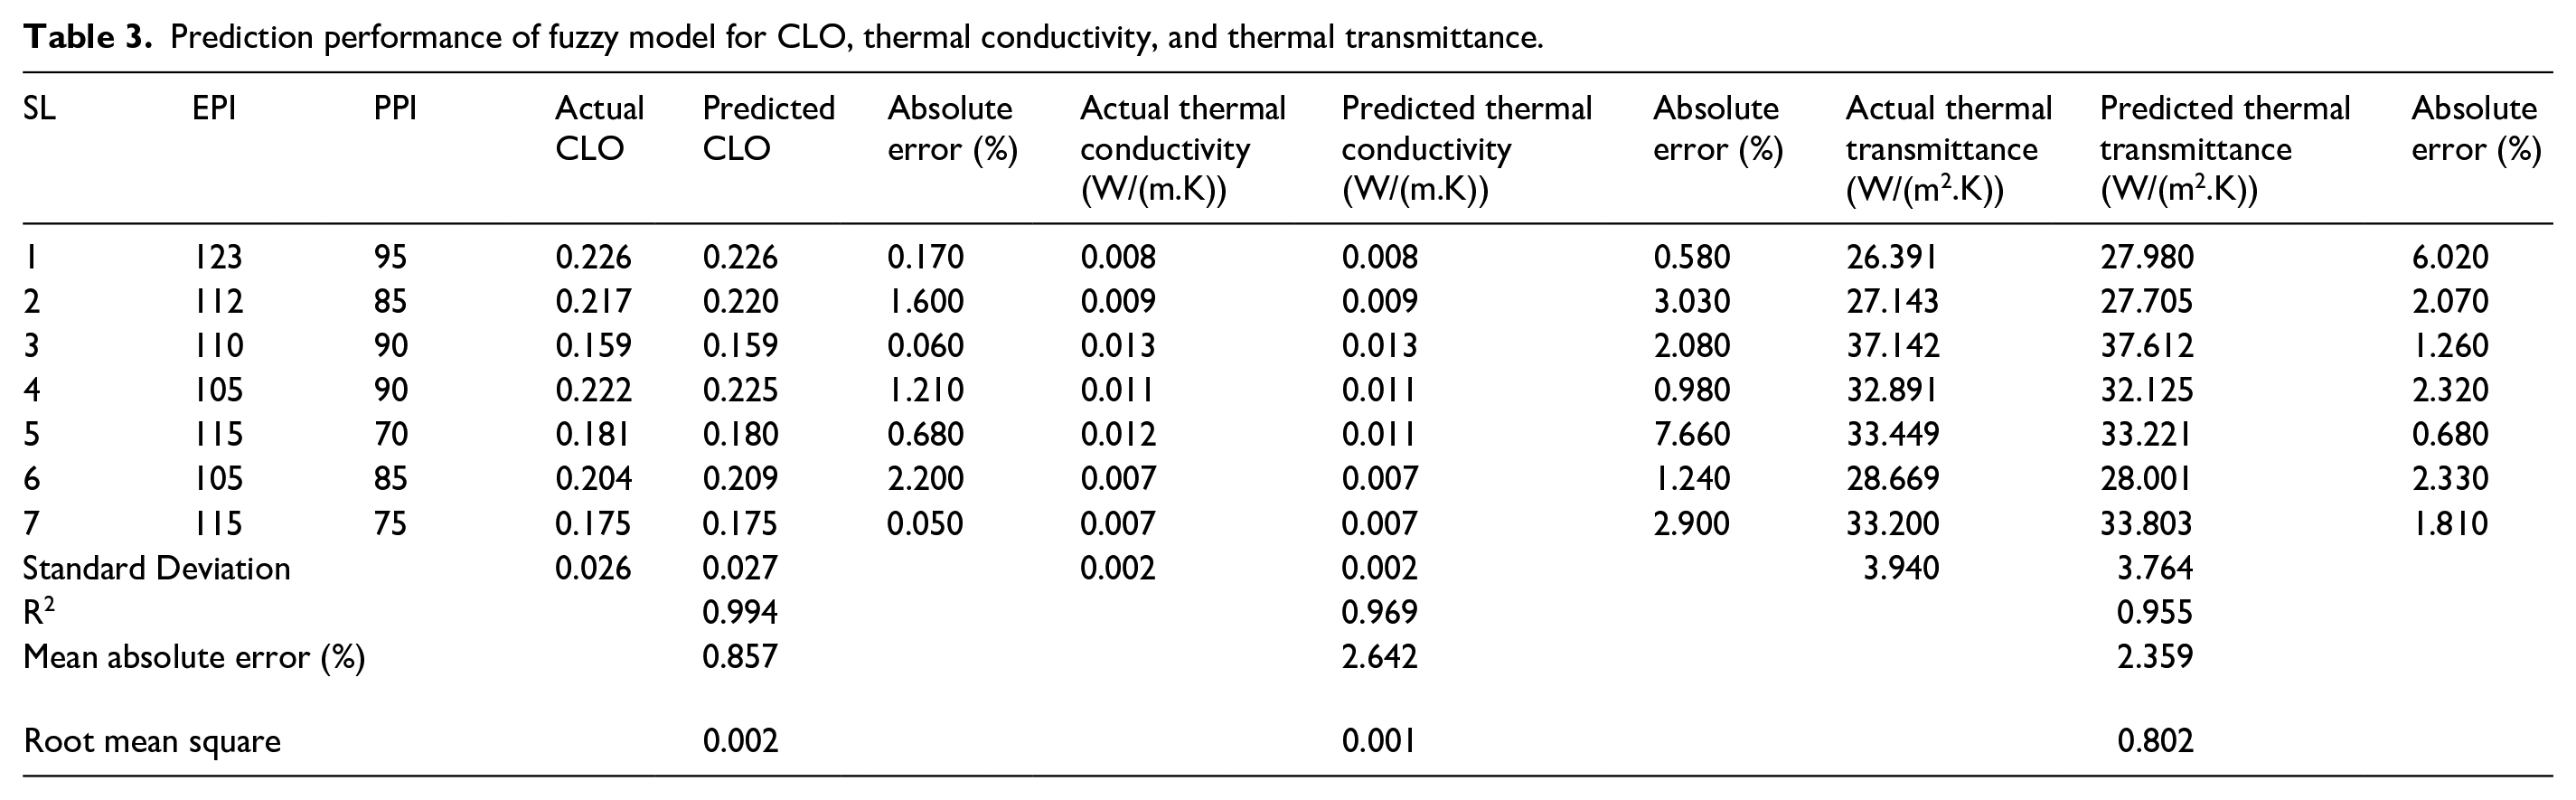
Figure 9(a) demonstrates the correlation between the actual and predicted CLO values, indicating a fairly linear relationship between both. The coefficient of determination (R2) was calculated to be 0.9949, reflecting the accuracy of the recommended model. Correlation curves were graphed, and R2 values were calculated using the web-based statistical analysis tool, GraphPad QuickCalcs. In Figure 9(b), an analysis of the actual and predicted values of thermal conductivity was carried out. The figure reveals a correlation, with a coefficient of determination (R2) of 0.9699. This high R2 value indicates a high level of accuracy and precision in predicting thermal conductivity using the developed model. Similarly, in Figure 9(c), the relationship between actual and predicted thermal transmittance values is depicted, yielding a coefficient of determination (R2) of 0.9558. This R2 value, close to 1, underscores the reliability and trustworthiness of the developed fuzzy expert model in accurately forecasting the thermal transmittance of woven fabric.

Correlation between the actual and predicted values of (a) CLO (b) Thermal conductivity and (c) Thermal transmittance.
Validation and comparison of fuzzy model
New research data were used to validate the fuzzy prediction model. To validate the fuzzy model, seven fabric samples were assessed once again under arbitrary settings. The projected value of that newly constructed fuzzy expert model was then applied to those seven fresh fabric samples. After that, the actual and predicted values were used to validate and compare the fuzzy model. There is a link between the CLO, thermal conductivity, and thermal transmittance and those predicted by the fuzzy logic model, as shown in Figure 9. The fabric CLO, thermal conductivity, thermal transmittance predicted, and experimental values are well correlated with each other, as are the root mean square, mean absolute error percentage, and coefficient of determination (R2) were 0.002, 0.001, 0.802; 0.857; 2.642%, 2.359% & 0.994, 0.969, 0.955. Table 3 summarizes the data and emphasizes the created model’s strong prediction capabilities.
Limitations and scopes
Because of the limitations in the input and output values of the prediction model, we could not account for factors such as moisture content, yarn porosity, yarn twist, etc. Our prediction model is only applicable to predicting the thermal comfort of plain-woven fabric with EPI ranges of 90–125 and PPI ranges of 65–95 for the same warp and weft count of 40 Ne. Thus, in order to create a new prediction model that may benefit in a variety of ways in this field, further research may be conducted by adjusting fabric types, the range of input and output variables, different yarn counts, and other characteristics.
Conclusions
A fuzzy model was developed to estimate the CLO, thermal conductivity, and thermal transmittance of plain-woven fabric using various EPI and PPI values, while keeping the warp and weft count constant. The model was created using the input variables EPI and PPI and the output variables CLO, thermal conductivity, and thermal transmittance. The model provided a clear explanation of how the input and output variables interacted and affected thermal comfort. Based on the experimental data and comparison with the values predicted by the model, it is possible to draw the following conclusion:
(a) After analyzing and calculating, the mean absolute error percentage was found to be 0.857%, 2.642%, and 2.359% between the predicted and experimental CLO, thermal conductivity, and thermal transmittance, which lies within an acceptable limit of 5%. This shows that the developed model works well and proves the model’s accuracy.
(b) The coefficient of determination (R2) is 0.994, 0.969, and 0.955, which are all within acceptable limits, indicating that the model data and experimental data were well aligned, suggesting that the model is sufficiently compatible.
(c) The root mean square error (RMSE) was found to be 0.002, 0.001, and 0.802 for CLO, thermal conductivity, and thermal transmittance, respectively, indicating higher accuracy of the model.
The developed model exhibits reduced time requirements and more adaptability. Contrarily, this model can explain the variations in CLO, thermal conductivity, and thermal transmittance with a high degree of accuracy in relation to the input parameters. As a result, it may be able to assist industry professionals in choosing the best processing conditions when examining the thermal comfort of plain-woven fabric. Additionally, our proposed prediction model is based on the mentioned EPI and PPI range as input variables for plain woven fabric, so future research may be carried out by varying fabric types, the range of input variables and other parameters to develop a new prediction model that can serve industrial practitioners in different dimensions.
Footnotes
Declaration of conflicting interests
The author(s) declared no potential conflicts of interest with respect to the research, authorship, and/or publication of this article.
Funding
The author(s) received no financial support for the research, authorship, and/or publication of this article.