
Abstract
In order to efficiently reconstruct 3D fabric drape models with consistent topology, a 3D fabric drape model dataset named Ddrape was created firstly.The dataset consists of topologically consistent 3D fabric drape models and their corresponding 2D binary images. Subsequently, a reconstruction model named Rec3FDNet, which incorporates a convolution module and a graph convolution model, was constructed and trained to reconstruct 3D fabric drape models with consistent topology based on a single binary image. During the training of Rec3FDNet, the loss function, the normalization of 3D fabric drape model, and the structure of the initial mesh of Rec3FDNet were explored. The reconstruction results were characterized using Hausdorff distance toolbox of Meshlab in Python. The results demonstrated that Rec3FDNet enables fast and accurate reconstruction of 3D fabric drape models with consistent topology. Under the optimal parameter combination, the average Hausdorff distance(error) of the reconstructed 3D fabric drape models is 1.752 mm. In addition to reconstructing results with a consistent topology, Rec3FDNet is also robust to random translation of the input image. This study provides a practical method for large-scale acquisition of 3D fabric drape models.
Keywords
The drape performance of fabrics refers to the three-dimensional (3D) deformation of fabrics in their natural drape state, which is one of the manifestations of the mechanical properties and structural parameters of fabrics. The beautiful drape is one of the priority factors in clothing design and home textile design, therefor it is meaningful to systematically evaluate and analyze the drape performance of fabrics.1–5 In the study of fabric drape, the research object could be a two-dimensional (2D) projection or a 3D model (point cloud or triangular mesh) of draped fabric. The acquisition of 2D projection of draped fabric is relatively simple, however some useful information may be ignored during converting the 3D model into 2D projection. With the improvement of computer hardware, more and more researchers turn to 3D fabric drape models as the research object of fabric drape performance. 6 For example, Wang et al. 7 first projected the panoramic grating image onto the surface of the draped fabric, and then extracted contour information from the panoramic grating image. By calculating the height of the grating stripes on the surface of draped fabric, the 3D coordinates of each grating sampling point on the draped fabric were finally obtained. This method provides a feasible approach for collecting 3D fabric drape models, but due to the panoramic grating being directly above the draped fabric, fabrics with good drape performance, such as silk fabrics, have self occlusion during draping, and the panoramic grating cannot reconstruct such kind of fabrics. In response to this phenomenon, Mah et al. 8 collected point clouds of a 3D fabric drape model using a 3D human scanner and studied the distribution of distances between different cross-sectional contour lines of the draped fabric and the supporting cylinder. Mah et al. pointed out that the distance distribution of 3D fabric drape models can better characterize the drape performance of fabrics than traditional 2D projection. However, due to the use of equidistant cross-sectional contour, the drape degree of different fabrics is not comparable. Therefore, their proposed method makes the comparability of different drape models not strong enough. In order to reconstruct a 3D fabric drape model using a portable device, Hu 9 obtained dozens of image sequences of the draped fabric with a smartphone camera, and then a 3D color model of the draped fabric was reconstructed by matching feature points between the images. 10 Although this method simplifies the device, it sacrifices the efficiency of 3D reconstruction. In order to improve the collection efficiency, Yu et al. 11 combined multiple depth cameras and Zhang Zhengyou calibration method 12 to fuse the depth information collected by multiple cameras into the same world coordinate system, achieving the scanning reconstruction of a 3D fabric drape model. Although the time required to collect a single drape model is considerable, the results obtained by this method are dense 3D point clouds. When analyzing the results, tedious steps such as denoising, encapsulation, and resampling need to be performed on the 3D point clouds. Note: unless otherwise specified, the term 3D fabric drape model in this paper refers to a 3D triangular mesh of draped fabric.
In summary, the existing methods to capturing 3D fabric drape model cannot balance the simple equipment, high acquisition efficiency, and good operability of acquisition results. Therefore, collecting 3D fabric drape models with consistent topology by simple devices has important practical significance, such as collecting large-scale 3D fabric drape models for training deep learning large models. Based on this, Yu et al. 13 extracted low latitude features of a 3D fabric drape model with principal component analysis (PCA). They converted the problem of reconstructing a 3D fabric drape model of into a problem of predicting low-dimensional features of a 3D fabric drape model. The 3D point cloud of draped fabric was reconstructed by predicting the low latitude features of 3D fabric drape according to the single image of draped fabric. However, limited by the small training dataset, the reconstruction accuracy is insufficient. Besides, the generated 3D point cloud of draped fabric should be encapsulated into triangular mesh firstly. Therefore the reconstruction model that can generate 3D mesh of draped fabric is what we need. Following the method, Yu et al. 14 also explored the reconstruction of 3D fabric drape model with Poisson deformation and neural networks. Their results show that their method also fails in the reconstruction accuracy because of small training set and simple fitting method. With the development of 3D reconstruction technology, more and more excellent algorithms have been proposed, such as Pix2Mesh, 15 Image2Mesh, 16 Pix2Vox, 17 SparseFusion, 18 etc. This type of methods focuses on the reconstruction of various types of 3D models, and its reconstruction results are often used for subjective analysis. To use the results of 3D reconstruction for subsequent objective calculations, it is necessary to train the reconstruction network with a professional dataset. Based on this, this study aims to achieve efficient reconstruction of 3D fabric drape models with consistent topology by preparing a 3D fabric drape model dataset, as well as training a deep learning 3D reconstruction network.
Material and methods
Pipeline of reconstructing topologically consistent 3D fabric drape models
The pipeline of reconstructing topologically consistent 3D fabric drape was shown in Figure 1. Before reconstructing, a 3D fabric drape model dataset Ddrape that corresponds one-to-one between binary images and 3D fabric drape models was constructed. As shown in Figure 1(a), Ddrape includes a binary image (input) and a 3D triangular mesh (output). To reconstructed 3D fabric drape model based on the binary image, a reconstruction network named Rec3FDNet (
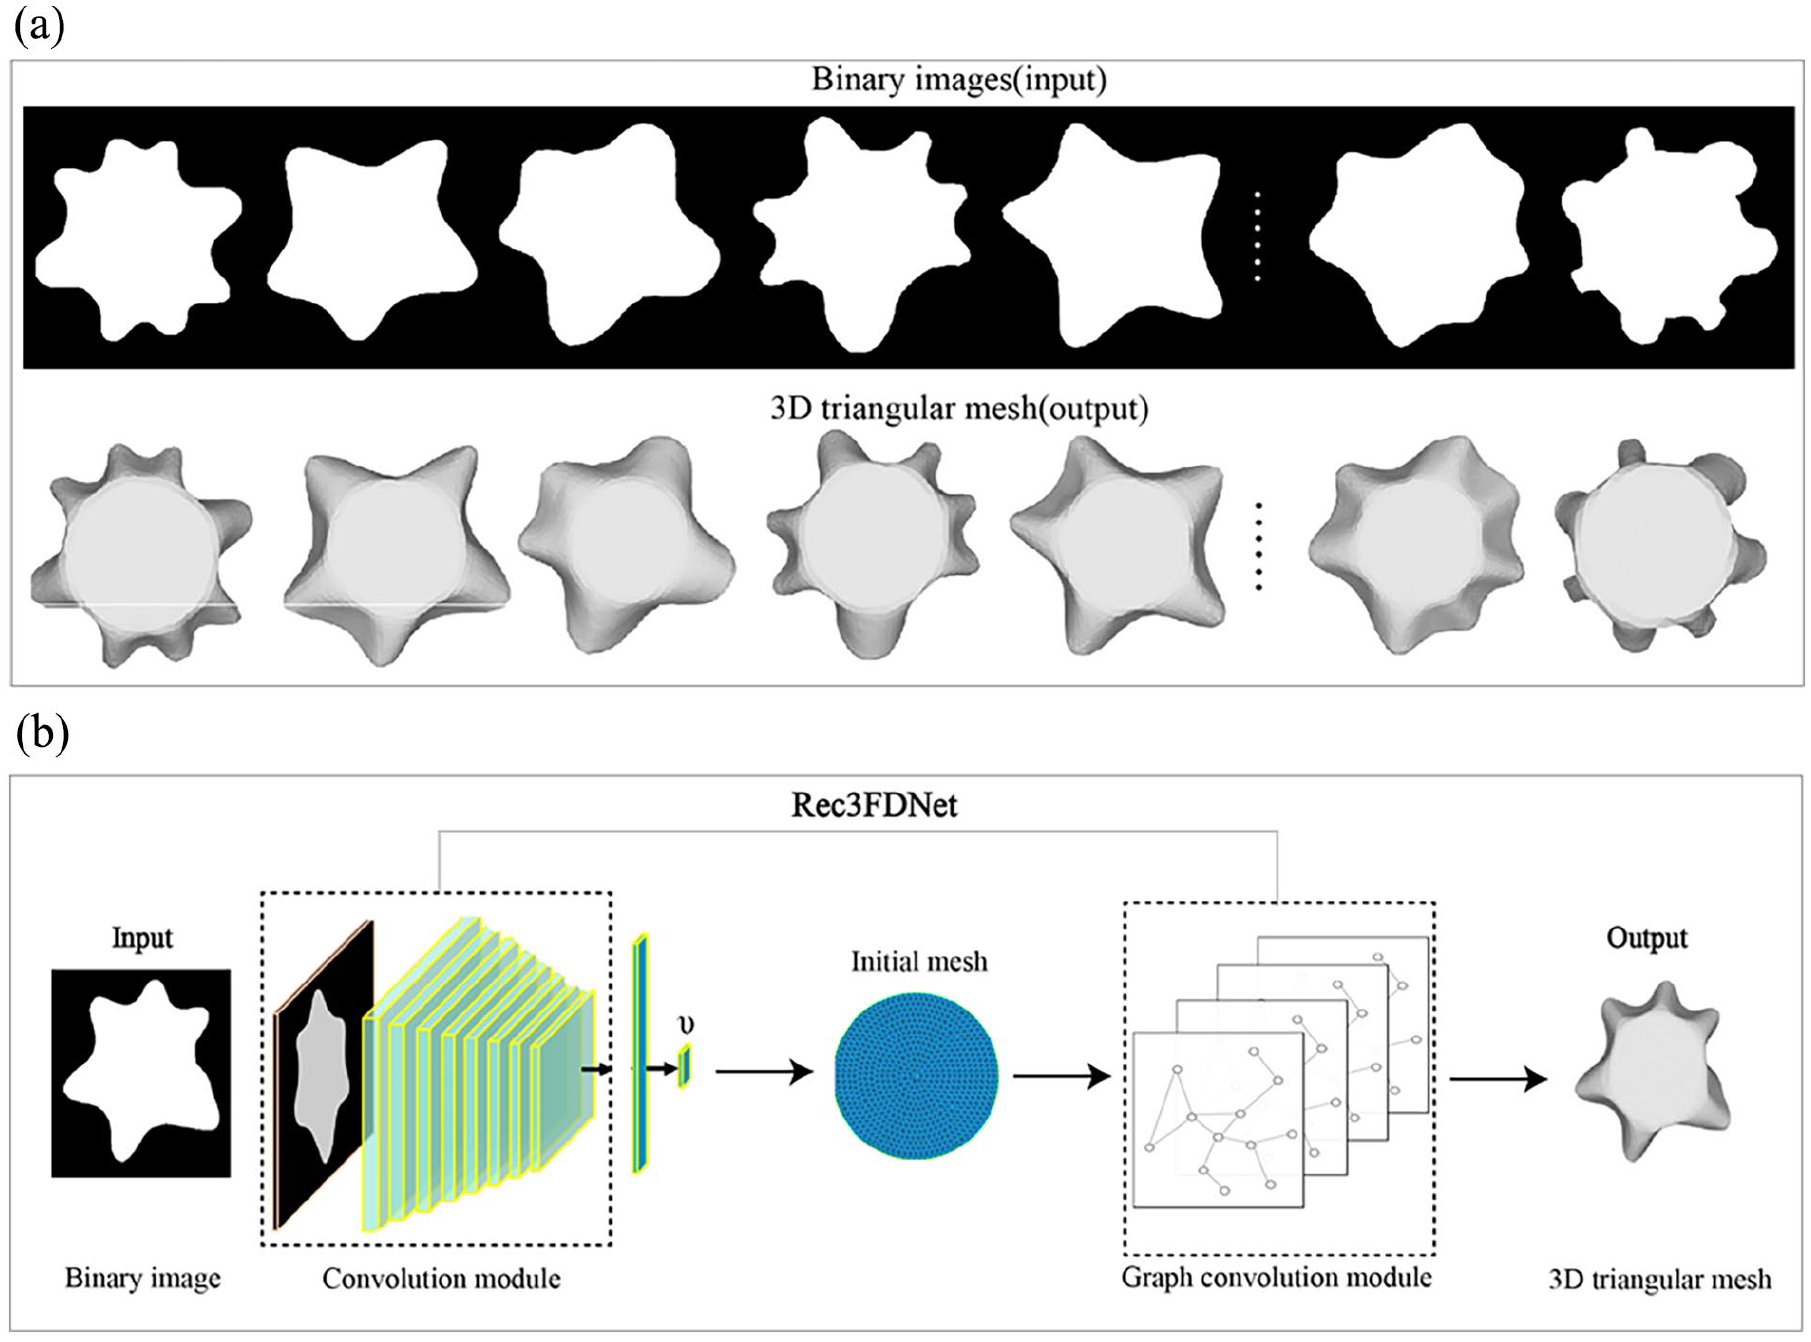
Ddrape composition and Rec3FDNet workflow: (a) Ddrape and (b) pipeline of reconstructing 3D drape model.
Preparing fabric samples
In order to create Ddrape, which contains multiple 3D fabric drape models, 60 different types of woven fabric samples were collected in this study. After washing, ironing, and wetting the sample, three circular samples with a diameter of 240 mm at different positions on the fabric sample were collected.
Preparing the output (label) of Ddrape
The point cloud fusion method provided by Microsoft’s Kinect SDK application was used to obtain the 3D fabric drape model in this study. As shown in Figure 2(a), a circular fabric with a diameter of 240 mm was draped onto a supporting disk with a diameter of 120 mm. The supporting disk was placed on a display disk that can rotate at a constant speed. It takes 90 s for the display disk to rotate once. On one side of the draped fabric, the Microsoft Kinect V2 depth camera captures a 3D point cloud of the draped fabric. During the rotation of the display disk, the computer collects multiple consecutive frames of 3D point clouds and automatically concatenates them to form a complete 3D point cloud of the draped fabric. The 3D point cloud collection was completed after the display disk rotates once. Then a software named Geomagic was used to encapsulate the dense 3D point cloud. The encapsulated triangular mesh, as shown in Figure 2(b), was resampled to make sure all 3D fabric drape models with the same vertices number and order. Finally, the resampled point cloud was encapsulated with the same triangle indexes. Therefore, all resampled triangular mesh share the same triangular topology. To make the reconstruction more accuracy, the resampled triangular mesh was scaled based on the area of the circular fabric.
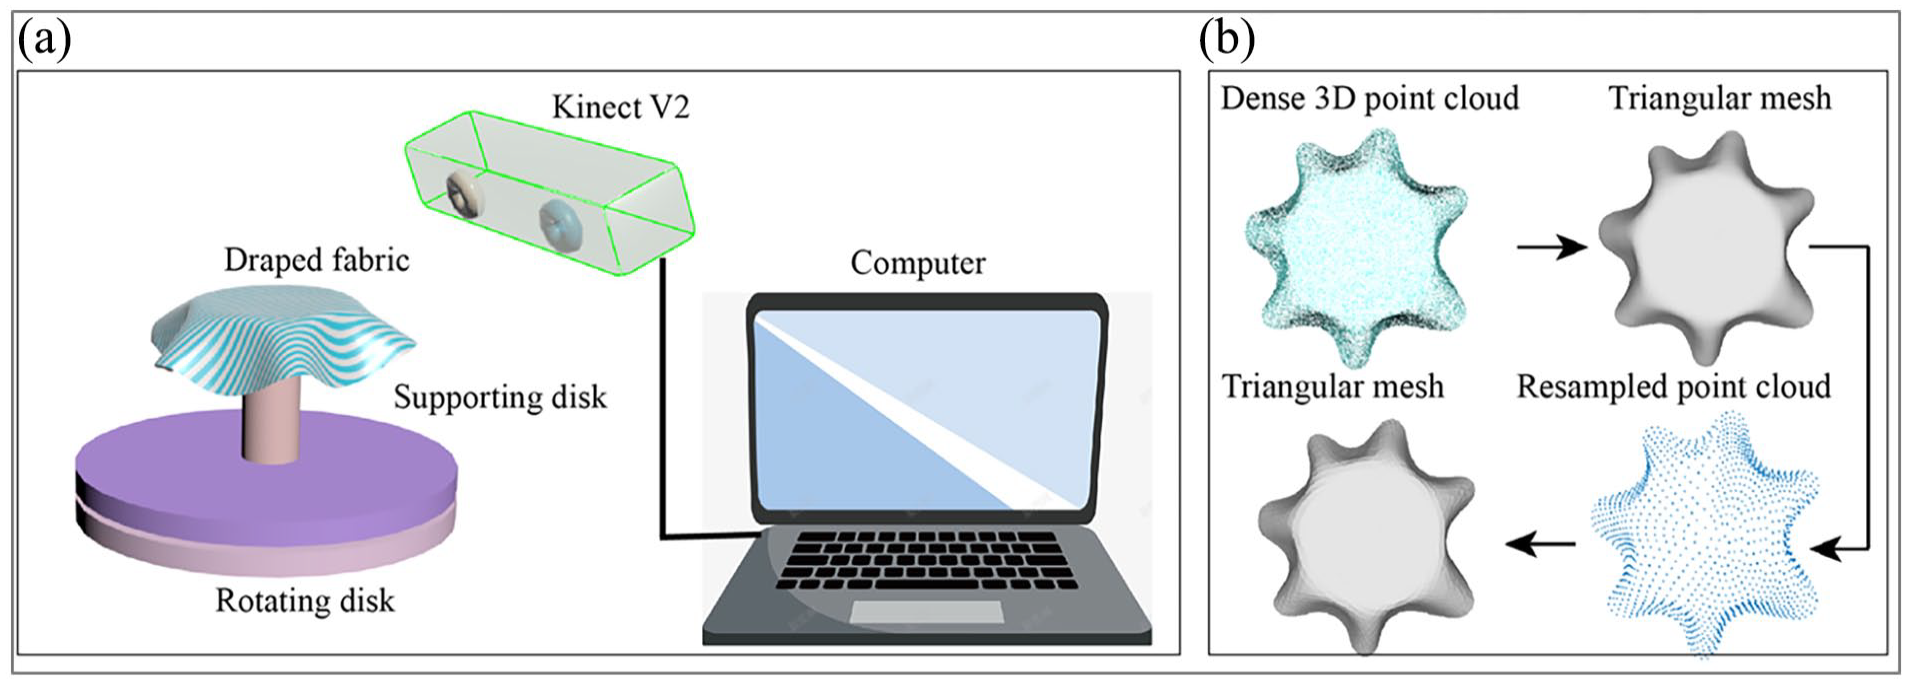
Scanning device and post process of 3D point cloud: (a) scanning device and (b) post process of 3D point cloud.
Each circular fabric sample was scanned three times. In order to compensate for the lack of fabric sample types, this study performed ordered rotation on the scanned 3D fabric drape model, as shown in Figure 3. The Z-axis in Figure 3 was used as the rotation axis, with pi/16 per rotation, and each 3D fabric drape model was rotated 31 times. Therefore, there are 17,280 3D models of 60 × 3 × 3 × (1 + 31) for the 60 fabrics. Select 54 out of 60 fabrics for training and the remaining 6 for testing. Therefore, there are 15,552 3D fabric drape models in the training set and 1728 3D fabric drape models in the testing set. Resampling method described in Zhang 12 was used to resample the augmented training and testing sets to ensure that all 3D fabric drape models share the same topology.

The definition of coordinate system of draped fabric and data augmentation of Ddrape: (a) defining the coordinate system of draped fabric and (b) rotating 3D triangular mesh.
Preparing the input of Ddrape
The pipeline of preparing the input of Ddrape was shown as Figure 4. The Open3D toolkit in Python was used to render 3D triangular mesh, obtaining grayscale image. The grayscale image was converted to a binary image. Then the background and foreground of the binary image were reversed. To improve the diversity of training samples and enhance robustness of Rec3FDNet, the fabric samples in the binary image are randomly translated and scaled to obtain the binary image shown in Figure 4, as well as Figure 1(a).

Pipeline of preparing the input of Ddrape.
Preparing initial mesh
As shown in Figure 2, all reconstructed triangular meshes were deformed from the initial triangular mesh, therefore the structure of the initial mesh will affect the generated results. In theory, the higher the triangular mesh density of the initial mesh, the more accurate the fitting result, and the better it can show the details of the 3D model. However, the higher the triangular mesh density of the initial mesh, the greater the computational cost and the larger the number of training samples required. Therefore, three initial meshes were compared in this study. As shown in Figure 5, Initial mesh 1 contains 2530 triangles and 1329 vertices. Initial mesh 2 contains 6462 triangles and 3333 vertices. Initial mesh 3 contains 14,522 triangles and 7413 vertices. The diameter of each of the three initial meshes is 240 mm. If the 3D fabric drape models involve normalization when training Rec3FDNet, the radius of the initial mesh was divided by 120.

The structure of three initial meshes in Rec3FDNet.
Setting the loss function
The Chebyshev distance is one of the widely used loss functions in the reconstruction of 3D point cloud. The Chebyshev distance
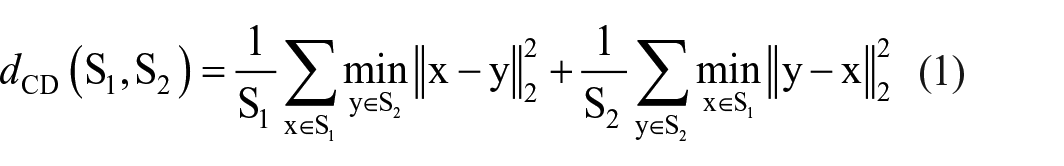
Formula (1) represents
Among them,
Normalization of 3D fabric drape model
In theory, the true diameter of the 3D fabric drape model collected in this study ranges from 60 to 120 mm. In order to better train Rec3FDNet, it is necessary to scale the 3D fabric drape model so that all vertices of the 3D fabric drape model within the unit sphere. Therefore, this study simultaneously conducted normalization and non-normalization experiments when training Rec3FDNet. In the normalization experiment, the real 3D fabric drape model was divided by 120 mm (normalized), and then the scaled 3D fabric drape model was used to train Rec3FDNet. When testing, the reconstructed 3D fabric drape models will be multiplied by 120. In non-normalized experiments, Rec3FDNet was directly trained with the resampled 3D fabric drape model without any scaling.
Training of Rec3FDNet
The image feature extraction module in this study was ResNet18, therefore the input image size was fixed at 224 × 224 × 3. The feature vector υ dimension extracted by ResNet18 was 512 × 1. In terms of initial mesh deformation, the graph convolution module includes 15 layers of residual graph convolution with residual modules. The learning rate of Rec3FDNet was set to 0.0001 and the batch size to 8. The deep learning framework used in this study was PyTorch, version 1.12.1. The computer was configured with MSI RAIDER GE77 HX, Intel Core i9 12,900HX processor, and NVIDIA 3080 Ti (16 GB) graphics card.
Testing of Rec3FDNet
The testing set with 1728 samples was used to test the trained Rec3FDNet. Then the Python toolkit pymeshlab was used to perform statistical analysis on the errors of the test set. To visualize some reconstructed results, the Hausdorff distance calculation tool of pymeshlab was used to measure the minimum distance (error) between the reconstructed drape model and the real drape model. Finally, the error visualization of the reconstructed 3D fabric drape model was performed with the heat map tool of meshlab.
Results and discussion
Performance of the two loss functions
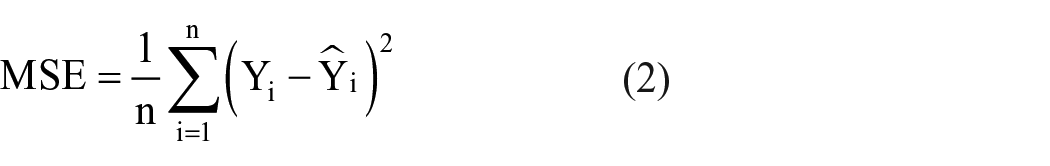
Under the same training conditions (initial mesh 1, training batch size 8, without normalization of 3D fabric drape models), the performance of the two loss functions are shown in Figures 6 and 7. As shown in Figure 6, when the loss function is MSE, the training loss can converge at 25,000 batches and fluctuate around 7.5. As shown in Figure 7, when
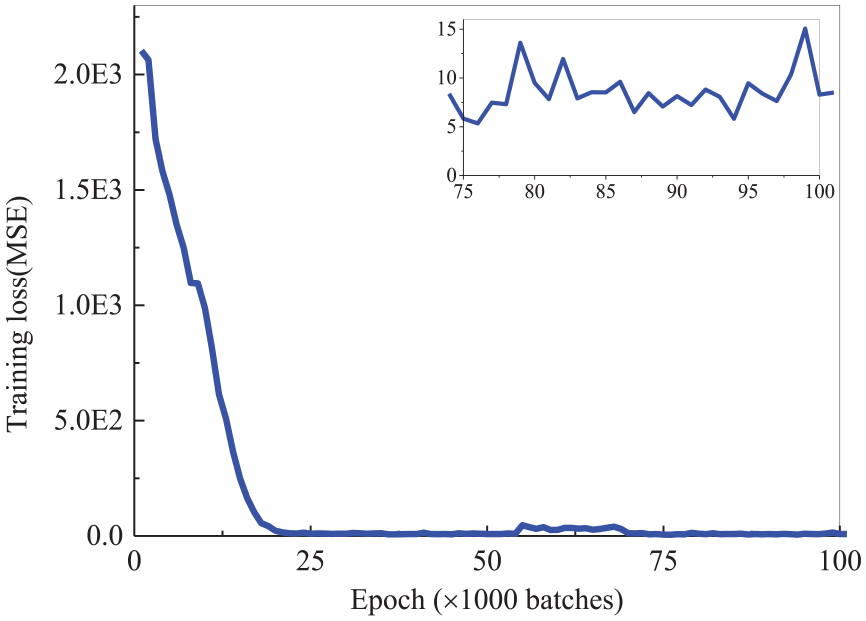
The relationship between training epoch and training loss when MSE was used as the loss function.
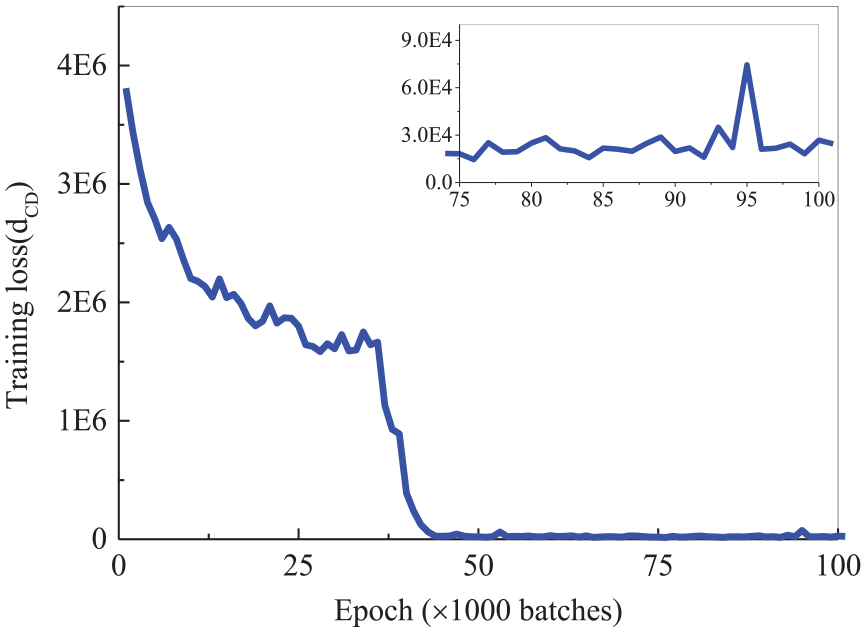
The relationship between training epoch and training loss when
In this study the CNN module of Rec3FDNet was set to ResNet18. When the batch size was set to 8, and the learning rate was fixed at 0.0001, the time consumed and loss reduction ratio (percentage of training loss to initial training loss) were shown in Table 1. When the loss function was set to MSE, training 1000 batches takes 475.40 s. When the loss function was set to
Comparison of
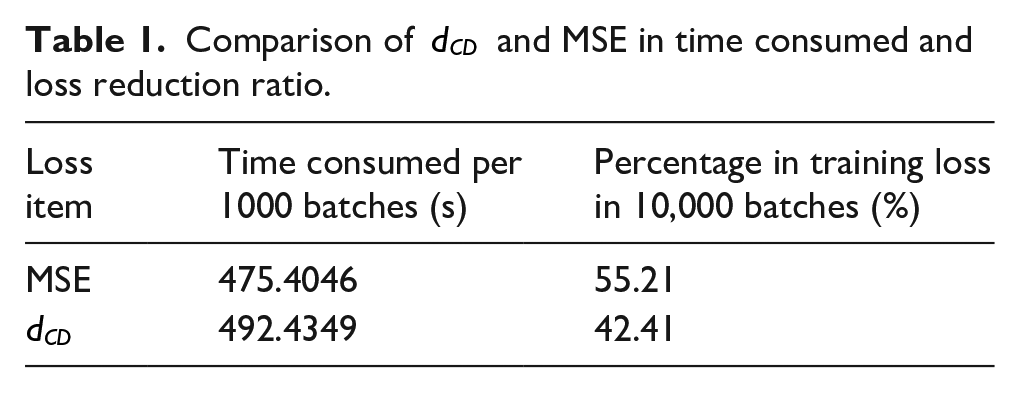
In terms of the decrease of the loss function, when the loss function is MSE, the change in the loss function after training 10,000 batches is 55.21%. When the loss function is
Performance of the three initial meshes
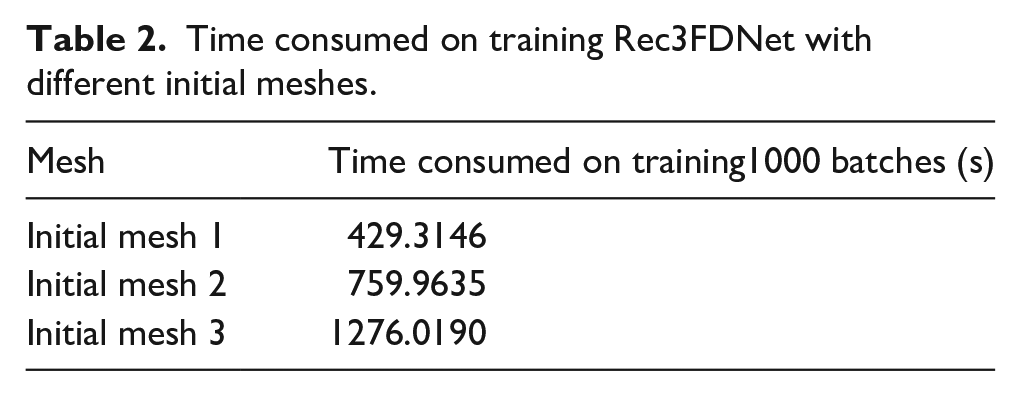
The time consumption on training Rec3FDNet with different initial meshes were shown in Table 2. The training batch size was set to 8. As shown in Table 2, under the same training hyper-parameters, initial mesh 1 corresponding to the smallest training time. When initial mesh 3 was used, it takes 1276.0190 s to train every 1000 batches, which is a significant increase in time compared to initial meshes1 and 2. This is because the more vertices in the initial mesh, the more weights need to be optimized, and the higher the difficulty and time cost of training Rec3FDNet.
Time consumed on training Rec3FDNet with different initial meshes.
The impact of initial mesh on Rec3FDNet training was shown in Figure 8. When the initial mesh was set to initial mesh 1, Rec3FDNet converges quickly and the training loss reaches a relatively stable state when training 21,000 batches. Finally, the MSE loss of Rec3FDNet fluctuates around 7.5. When the initial mesh was set to initial mesh 2, the convergence speed of Rec3FDNet decreases compared to initial mesh 1. When training 25,000 batches, the training loss reaches a relatively stable low value. Statistics show that the MSE loss fluctuates around 7.5 after Rec3FDNet converging. When the initial mesh was set to initial mesh 3, the training loss can also rapidly decrease. However, when the training 25,000 batches, loss of Rec3FDNet began to fluctuate dramatically and no significant sustained decrease was observed. The result indicates that the weights of Rec3FDNet may be insufficient to meet the correct deformation of all vertices in initial mesh 3. Therefore, it is necessary to combine initial mesh 3 with more complex models to achieve the reconstruction of 3D fabric drape models. Based on the performance of the three initial meshes, initial mesh 3 will no longer be discussed in this paper.
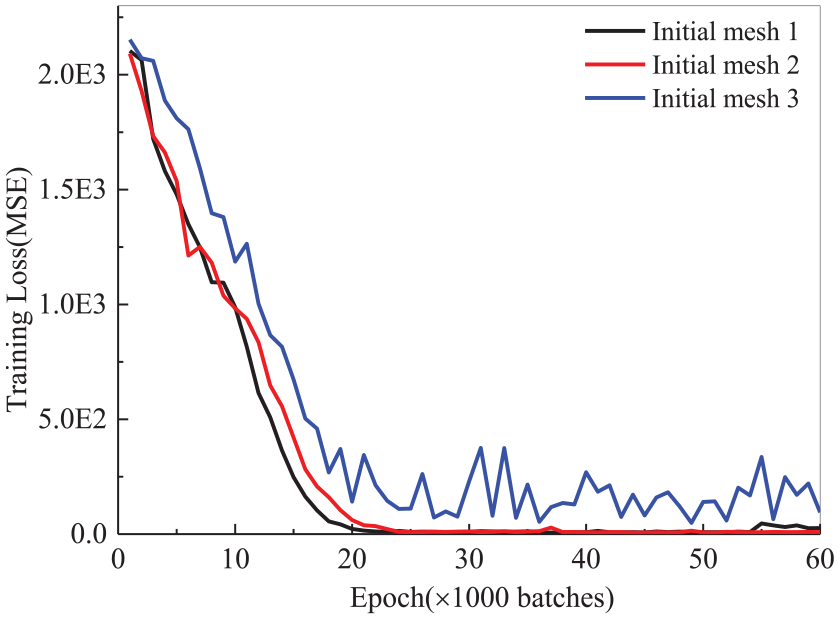
Relationship between initial meshes and training loss.
In order to evaluate the impact of initial mesh 1 and initial mesh 2 on Rec3FDNet, the reconstructed 3D fabric drape models with error hot-map were shown in Figure 9. As shown in Figure 9, both initial mesh 1 and initial mesh 2 can deform into the desired 3D triangular mesh under the constraints of the input image (Input example 1–4). The errors of the four reconstructed 3D meshes shown in Figure 9 were all below 11 mm, and the error distribution is mainly between 0 and 6 mm. This result indicates that both initial mesh1 and initial mesh 2 can effectively reconstruct 3D fabric drape models. Comparing the reconstruction results of Figure 9, it can be seen that there is no significant difference in error between the reconstruction results of initial mesh 1 and initial mesh 2. Taking into account the training difficulty, time cost, and reconstruction results, we are convinced that the initial mesh 1 can meet the needs of this research. Therefore, initial mesh 1 would be used as the initial mesh of Rec3FDNet in subsequent explorations.
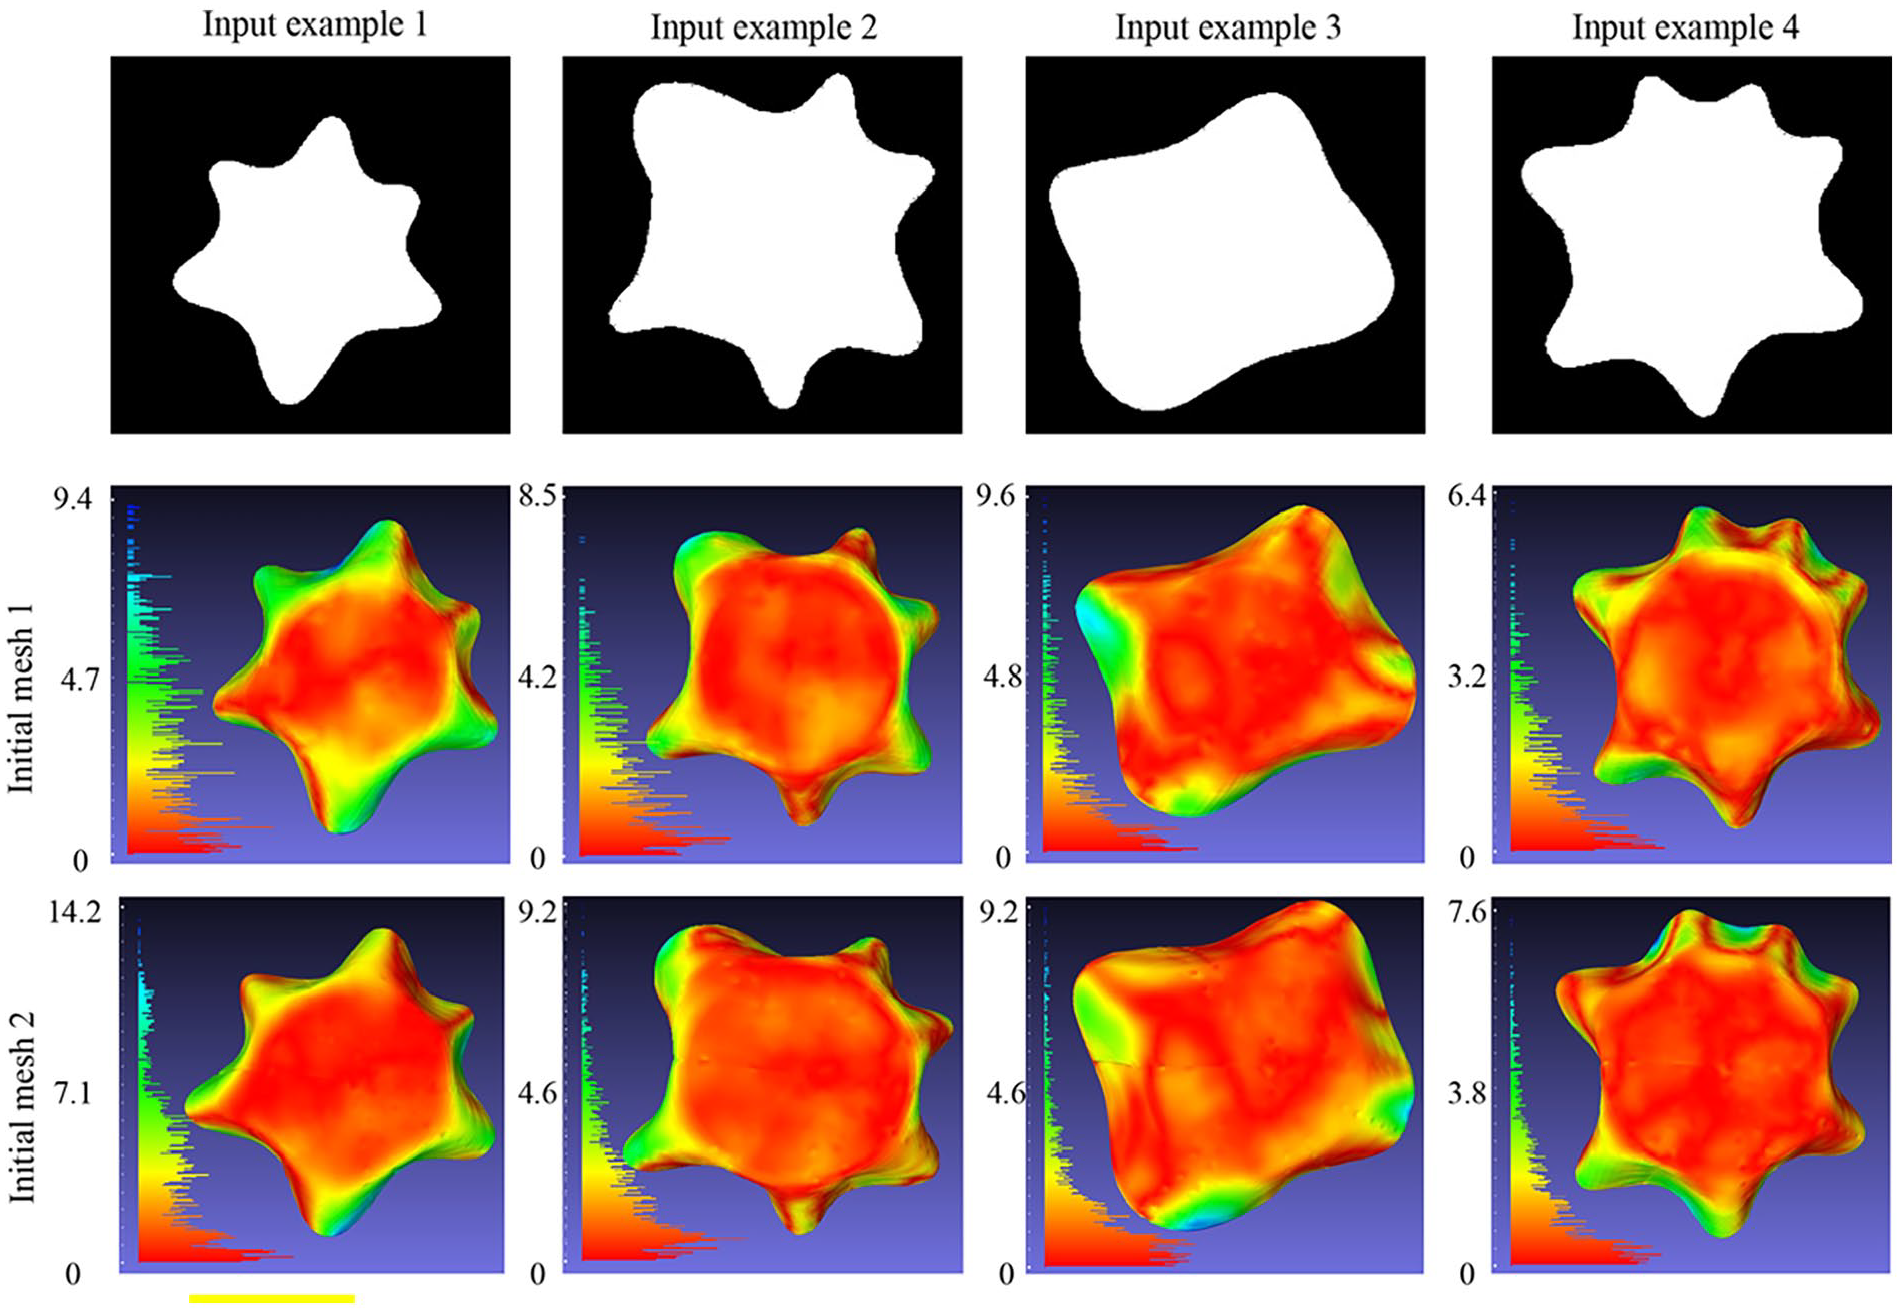
Reconstructed triangular meshes of initial mesh 1 and initial mesh 2.
The effect of normalization on Rec3FDNet
When normalization was used in training Rec3FDNet the relationship between training epoch and training loss was shown in Figure 10. It is obvious that with normalization Rec3FDNet shows significant convergence after training 3000 batches, and the training loss has been reduced to a very low level. That is to say the training loss in Figure 10 performs better than training loss in Figure 6 (without normalization of 3D fabric drape model). The reason for this result may be the difference in the fitting range of Rec3FDNet. When the 3D drape model is not normalized, the Rec3FDNet needs to continuously adjust the weights so that the coordinates of the output point cloud are in the range of −120 to 120. When the 3D drape model is normalized, the Rec3FDNet needs to continuously adjust the weights so that the coordinates of the output point cloud are in the range of −1 to 1. Since the initialization of the weights of Rec3FDNet is in the range of −1 to 1, the Rec3FDNet requires relatively shorter iteration steps to converge if 3D drape model is normalized. Therefore, when the learning rate of Rec3FDNet is the same, the iterative steps required for the training of Rec3FDNet are relatively short if the 3D drape model is normalized, and longer if the 3D drape model is not normalized. Coupled with the fact that the training of Rec3FDNet is characterized by random fluctuations, the longer training steps will increase the instability factor, therefore when the 3D drape model is normalized the training of Rec3FDNet is relatively less difficult.
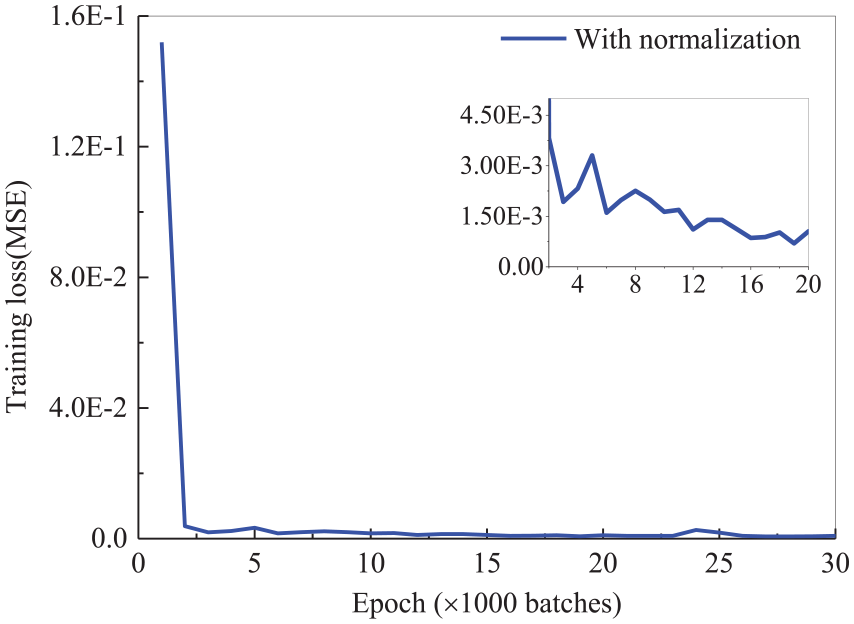
The relationship between training epoch and training loss when normalization was used in training Rec3FDNet.
To further validate the impact of normalization, the reconstructed 3D fabric drape models with or without normalization were compared in Figure 11. Initial mesh 1 was used as the original mesh of Rec3FDNet. As shown in Figure 11, four reconstructed 3D fabric drape models (with normalization of 3D fabric drape models) corresponding to the four binary images in first row were shown in the second row. Similarly, four reconstructed 3D fabric drape models (without normalization of 3D fabric drape models) were shown in the third row. Meanwhile the error distribution histograms of the reconstructed 3D fabric drape models were located on the left side of each sub-graph. The unit of error histogram is mm. As shown in Figure 11, there are significant difference in morphology for the four input samples, but all the reconstruction results are complete and full of rich details. In terms of error distribution, the red area represents vertices with smaller errors, all of which are less than 2 mm. The green area represents vertices with an error of less than 6 mm. The colors of the four sets of samples in Figure 11 are mainly red and green, with only a small number of vertices being blue in color. The left histogram also shows that the number of blue vertices is relatively small. This indicates that feasibility of Rec3FDNet in reconstructing 3D fabric drape model.
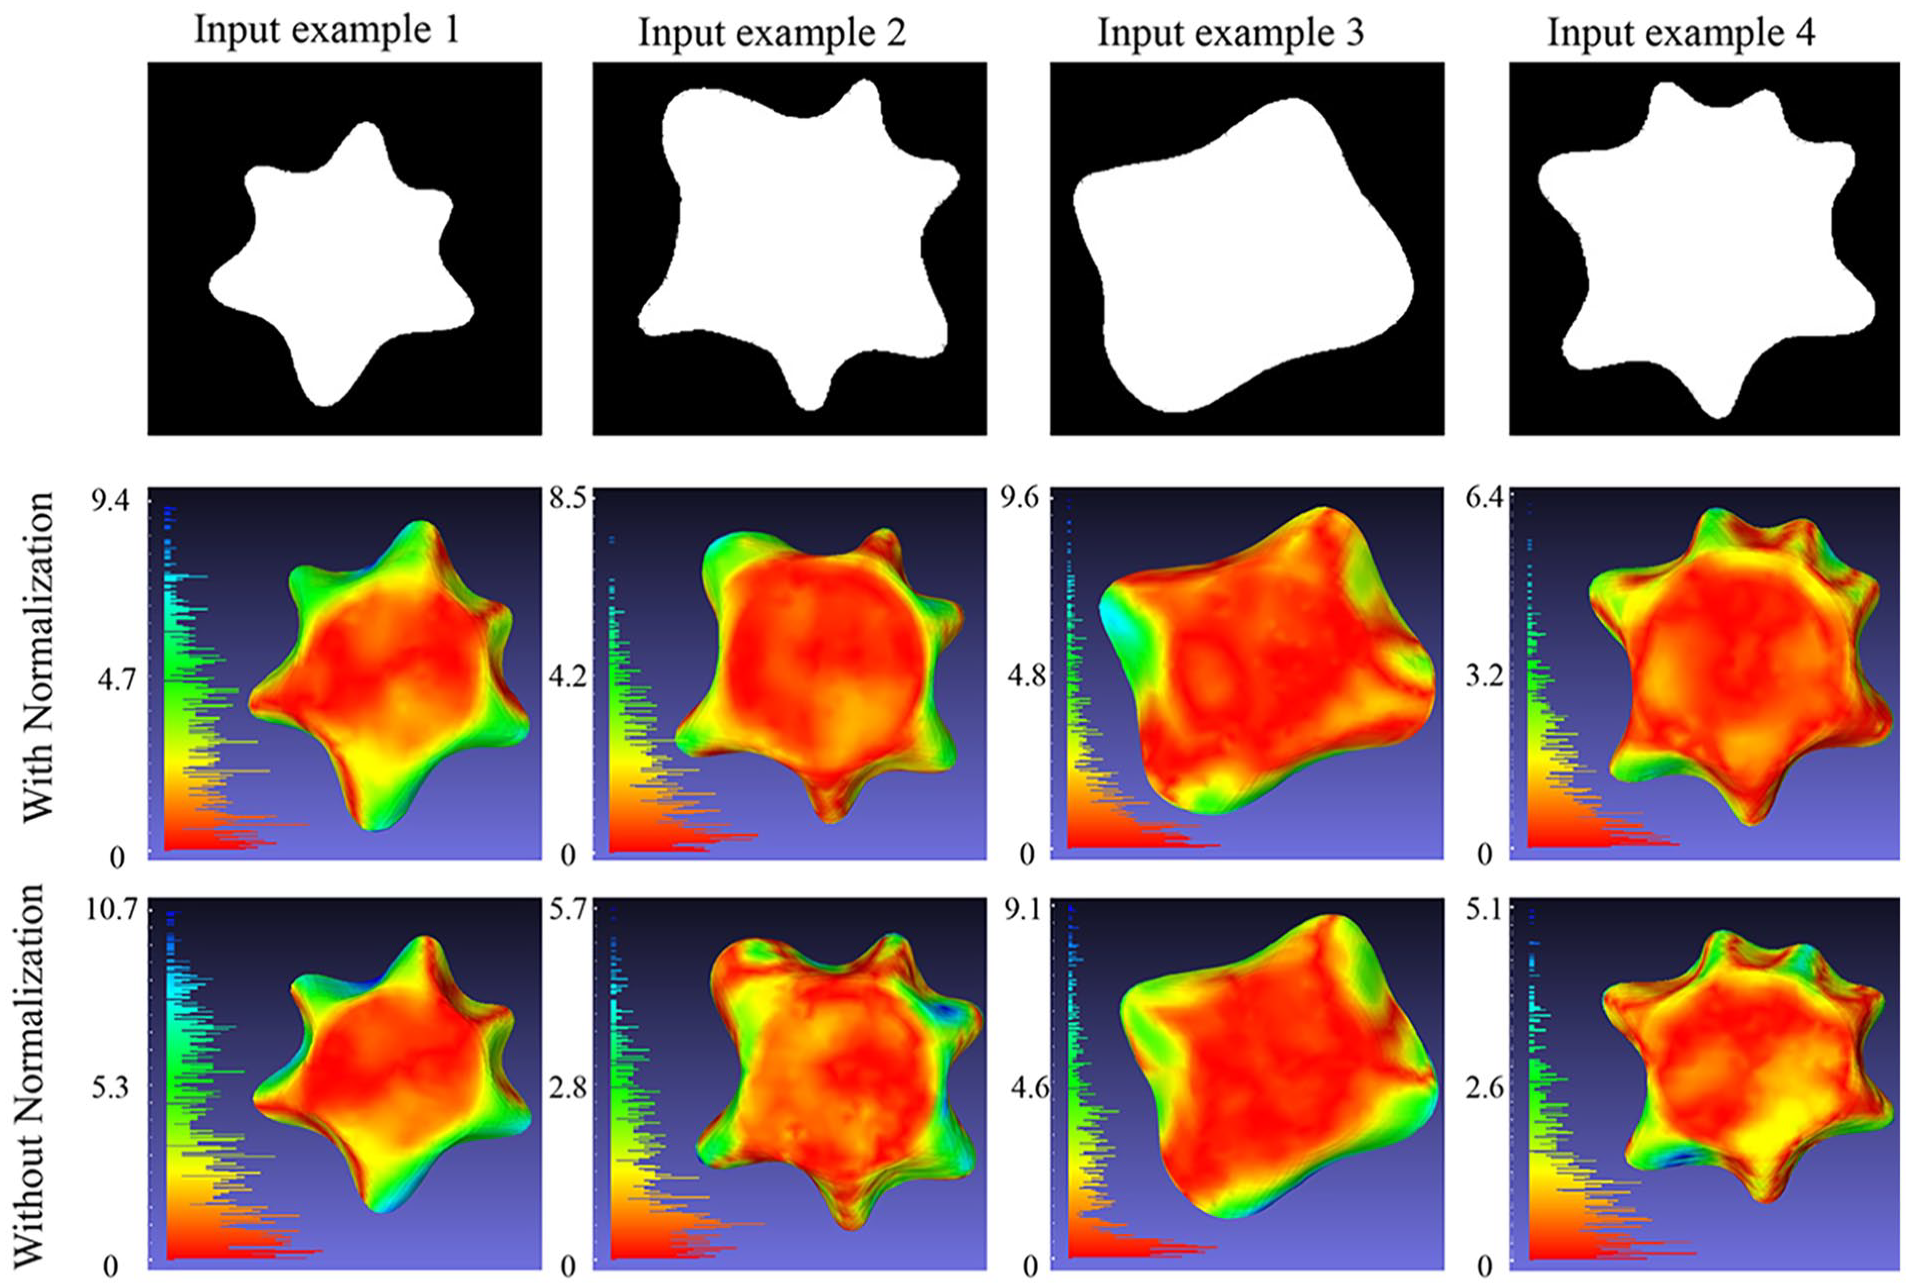
Reconstructed 3D fabric drape models with or without normalization.
Comparison shows that normalization of 3D fabric drape model does not fundamentally improve the accuracy of reconstruction. For example, the maximum error of output example 1 in third row is 10.7 mm, and the maximum error of example 1 in second row is 9.4 mm. The maximum error of Example 2 in third row is 5.7 mm, which is smaller than the 8.5 mm in second row. This means that due to the same structure of Rec3FDNet, normalization of 3D fabric drape models did not significantly improve the reconstruction accuracy. However, considering that normalization of 3D fabric drape models can improve accelerate the training of Rec3FDNet, normalization of 3D fabric drape models will be added in subsequent experiments.
Analysis of test set error
The error statistics of the testing set were shown in Figure 12. It’s observed that the mean error (Hausdorff distance) distribution of the test samples shows a normal distribution, mainly around 1.75. The variance of the test samples also follows a normal distribution, mainly around 2.0. With statistical analysis, it was found that the average Hausdorff distance of 1728 samples was 1.752 mm, with an average variance of 2.3108. This result further proves the accuracy of Rec3FDNet.This result was significantly better than that of previous PCA reconstruction. 13 This is mainly reflected in the following points: (1) Rec3FDNet has shorter steps, that is to say, Rec3FDNet can directly generate 3D, and mesh of draped fabric only 3D point cloud of draped fabric could be reconstructed by PCA reconstruction. (2) Rec3FDNet focuses on the generation of 3D drape model mesh, and it can generate the 3D drape model of the fabric with high accuracy and suitable for objective analysis. (3) Rec3FDNet can generate 3D mesh with a consistent topology, which is very favorable for the comparative analysis of fabric drape properties.
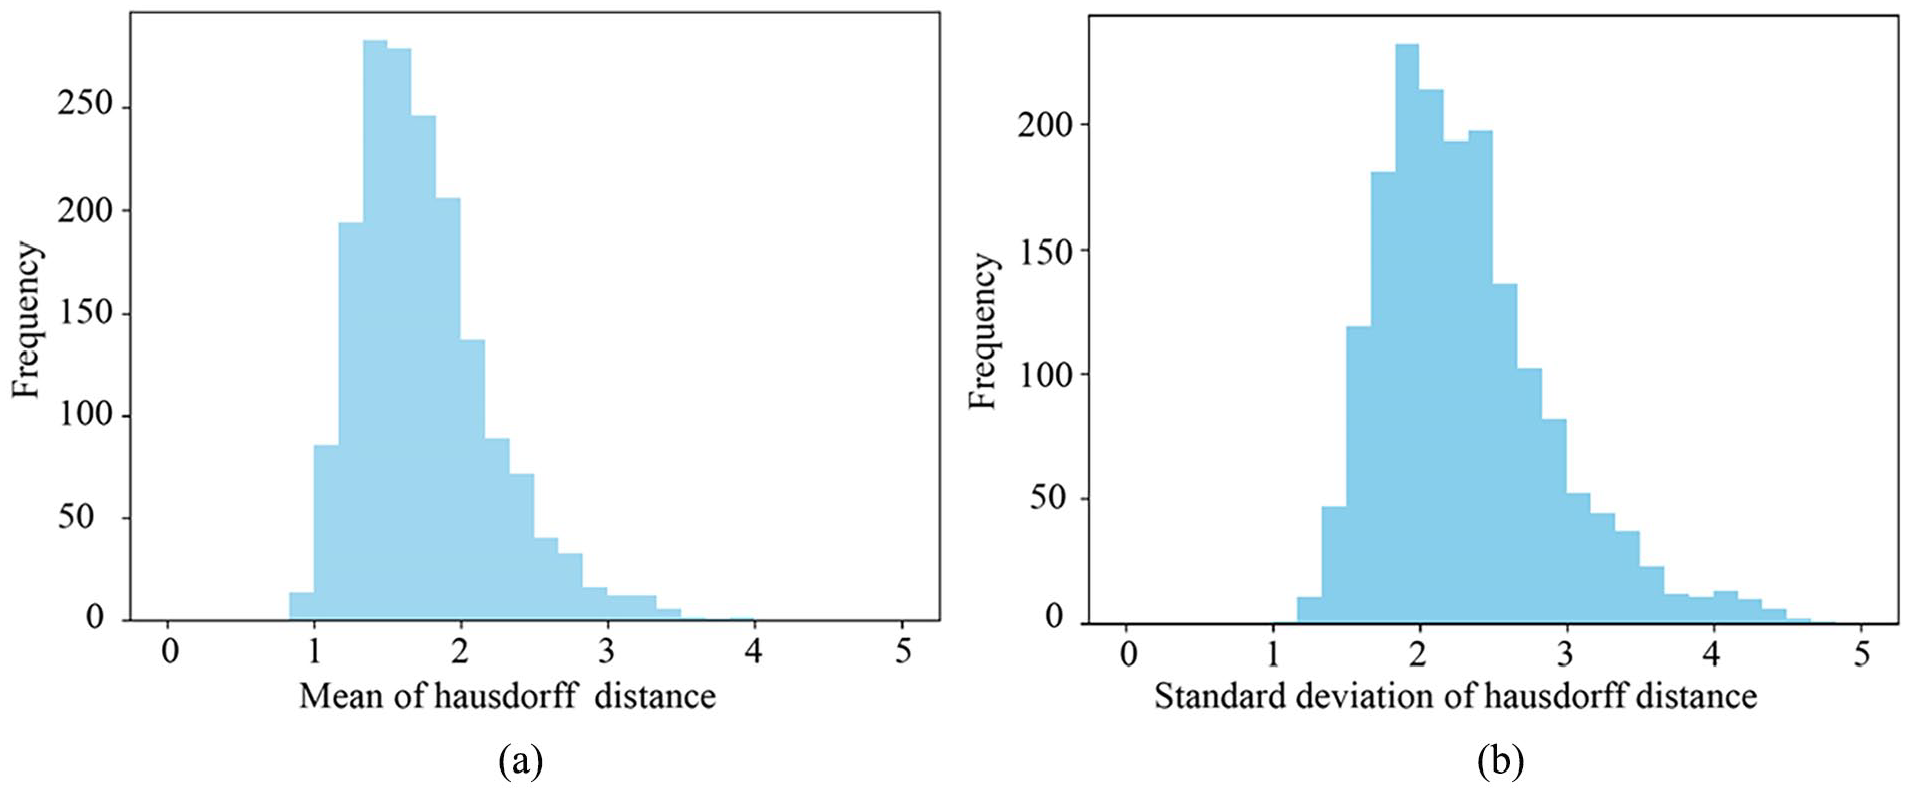
Histogram of Hausdorff distance distribution of test samples. (a) The mean of hausdorff distance. (b) The standard deviation of hausdorff distance.
Rec3FDNet stability to random translation
In order to test the stability of Rec3FDNet, the binary image of draped fabric were randomly translated (up, down, left, right) as shown in Figure 13. The original image as well as translated images were input to trained Rec3FDNet. The corresponding reconstructed 3D fabric drape models were shown in Figure 13. It’s observed despite of the arbitrary translating of fabric drape, 3D fabric drape models with accuracy detail could be reconstructed with trained Rec3FDNet. The error histogram shown in each sub-graph show that the error of each model is below 11 mm. The error distribution is dominated by small errors, with fewer obvious errors. This indicates that Rec3FDNet has good stability toward the input image. However Rec3FDNet may sometimes perform poorly. As shown in the second row and fourth column of Figure 13, the peak distribution of the draped fabric is relatively smooth, which is significantly different from the real 3D fabric drape model. This may be because when augmenting training data drape image was translated randomly with a normal distribution. Therefore, the vast majority of drape images fluctuate near the center of the image. If the data augmentation of training set is not enough, the trained Rec3FDNet may perform poorly for some rare training samples. The drape image in the column 4 of Figure 13 was located in the upper right corner of the entire binary image. It may be one of the rare samples. Therefore, the next steps of this study can be focused on expanding the training set purposefully and retraining Rec3FDNet.
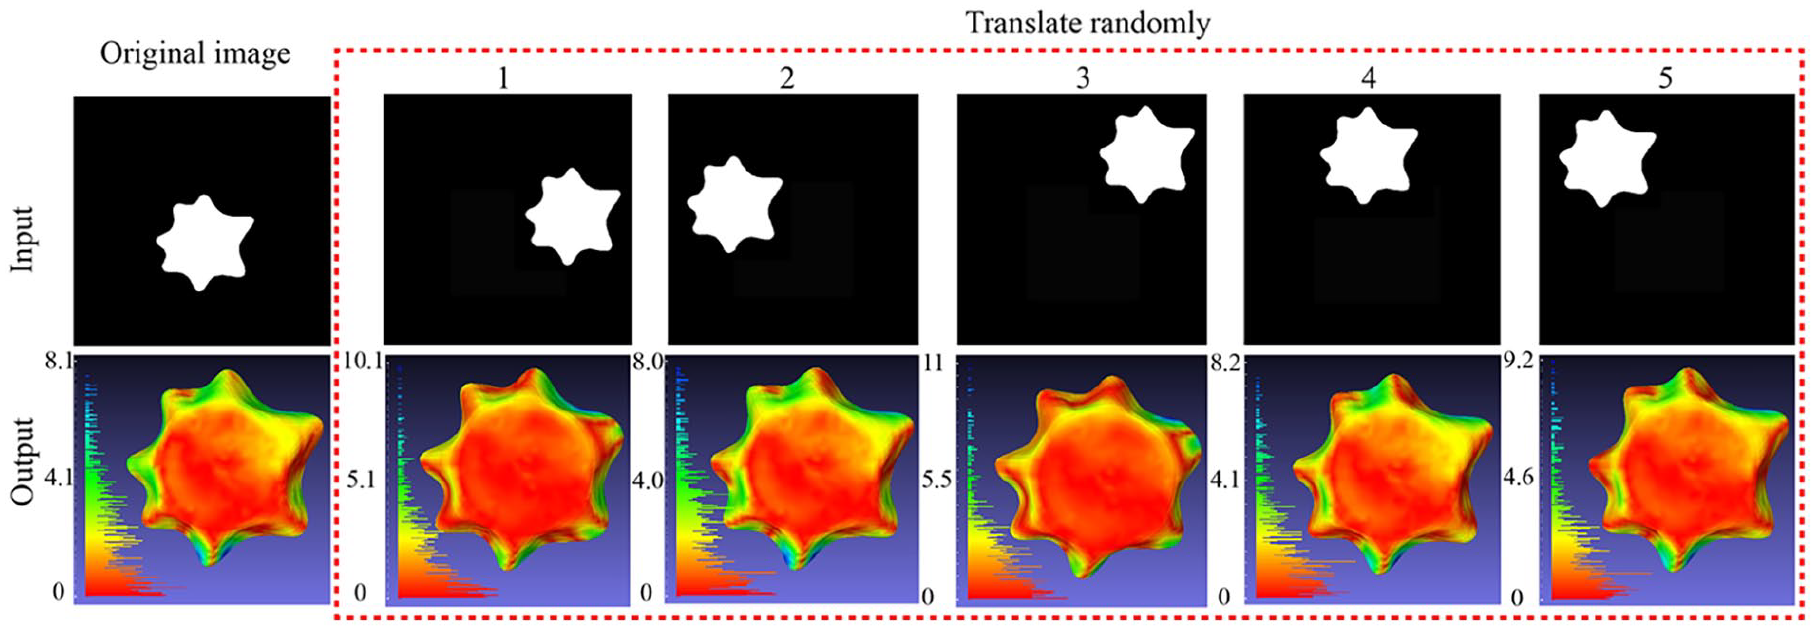
Rec3FDNet stability to random translation.
Topology of reconstructed 3D fabric drape models
All the reconstructed meshes in this study were deformed from the initial mesh, therefore theoretically all the reconstructed models share the same number and ordering of vertices. To verify the conclusion, three vertices of reconstructed 3D fabric drape models were shown in Figure 14. Where the point marked in red asterisks (*) is the first point of the reconstructed model, the point marked in green asterisks is the 100th point of the reconstructed model and the point marked in blue asterisks is the 1000th point. As shown in Figure 14, the 1st vertex is on the right side of the reconstructed model in all the different models. The 100th vertices are all on the lower right side of the reconstructed model. The 1000th vertices are all on the upper left side of the reconstructed model.
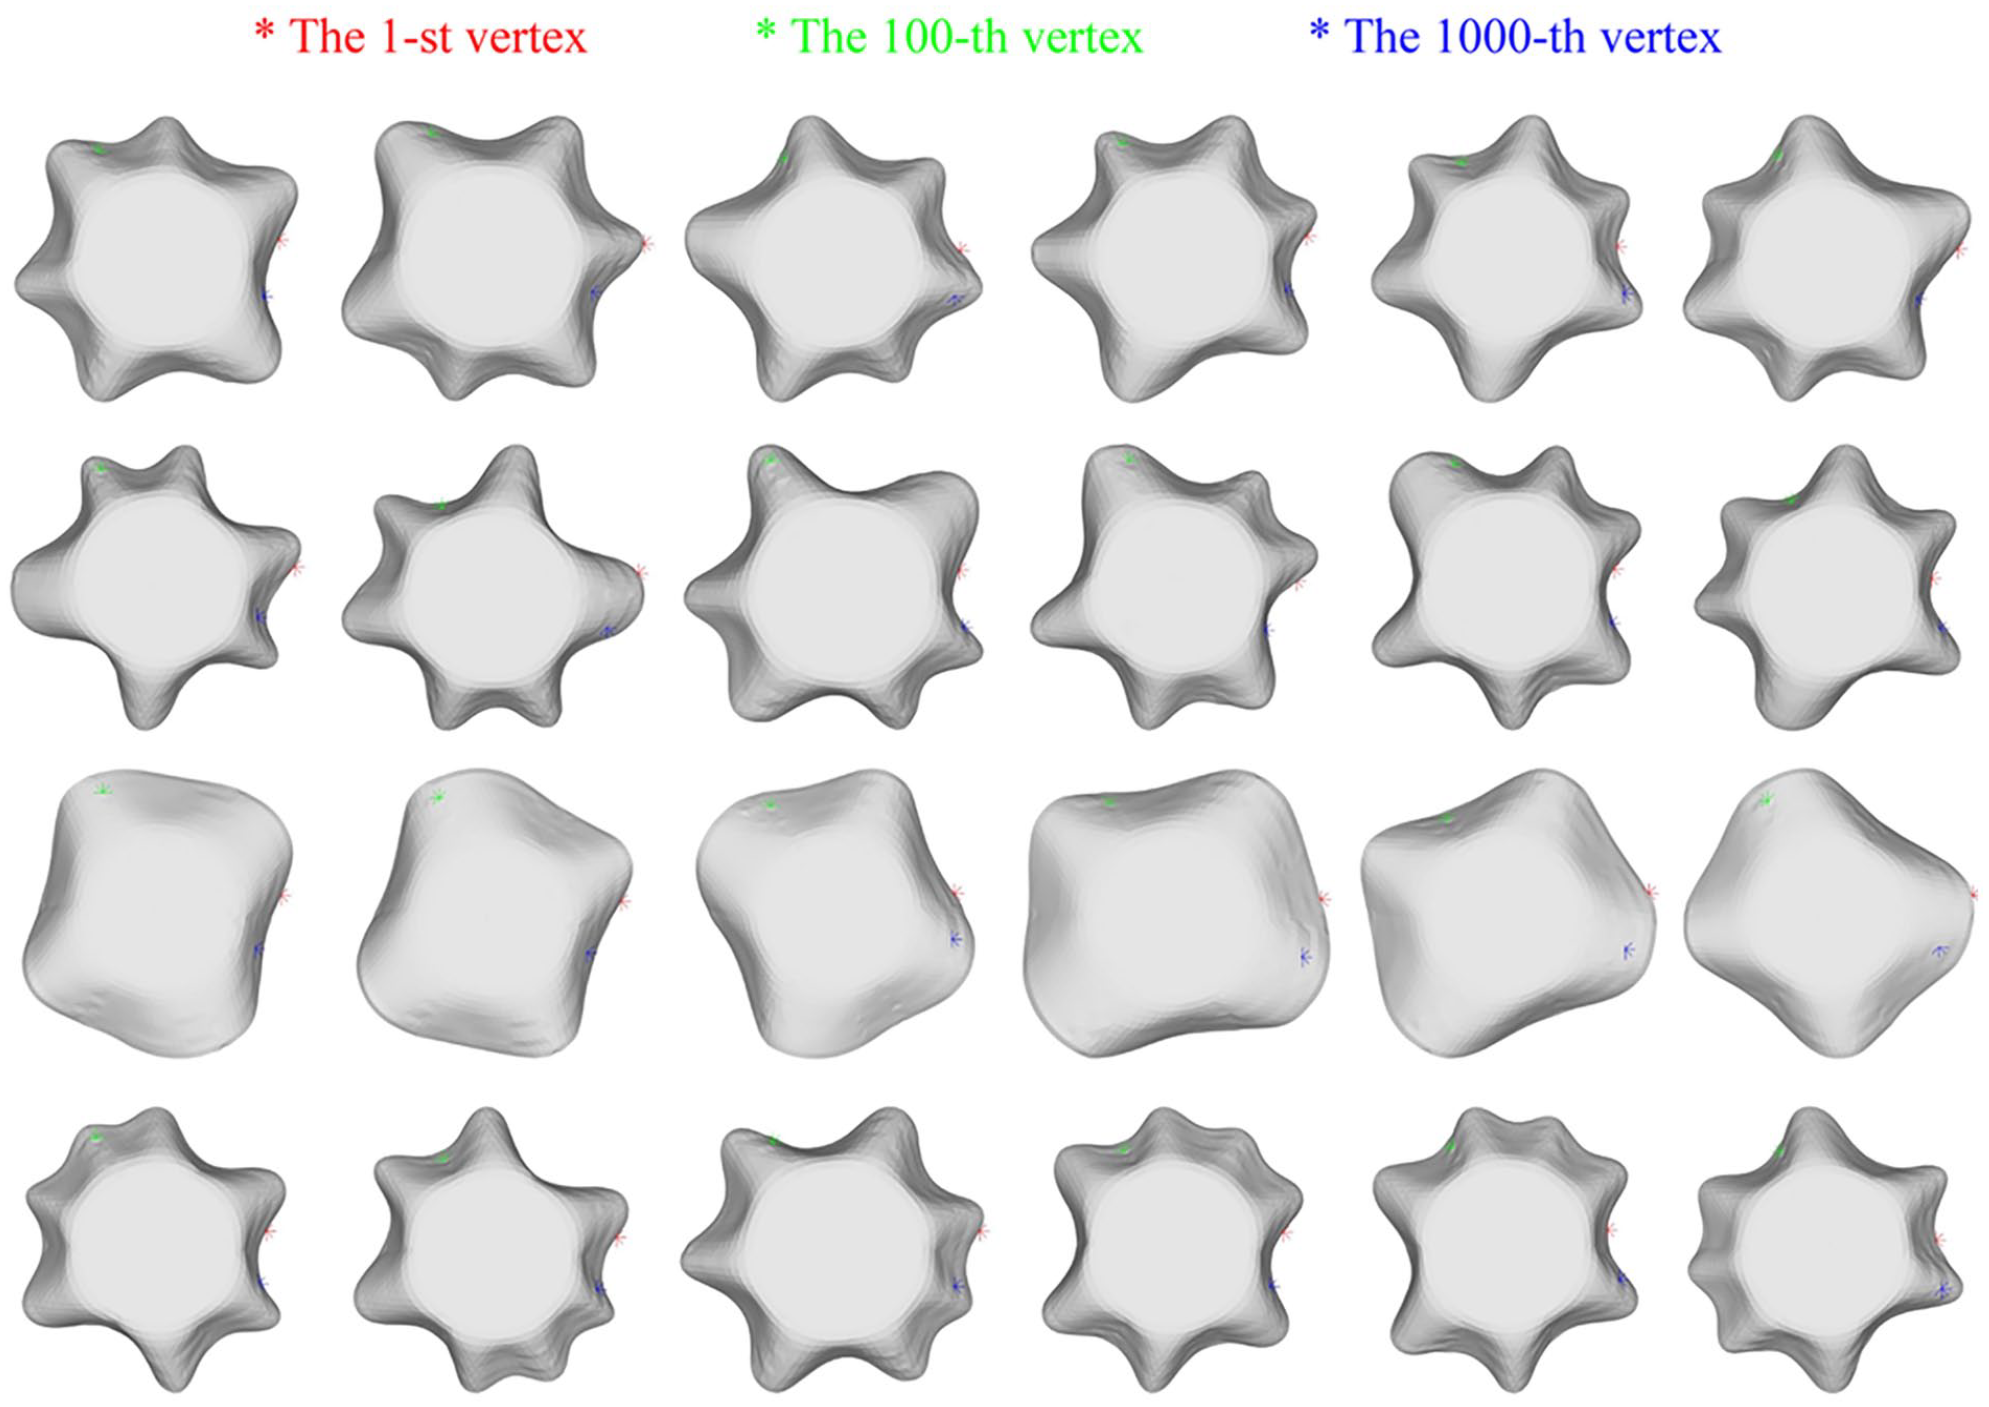
Topology of different reconstructed fabric drape models.
To verify the topology of different reconstructed fabric drape models, the lines between two vertices which own the same index in two arbitrary reconstructed 3D fabric drape models were drawn. As shown in Figure 15, the lines between two vertices which own the same index in the four mesh pairs were almost parallel. There are few intersecting lines in the four mesh pairs. The result shows that the vertices which own the same index in different reconstructed fabric drape models share the same orientation. The results shown in Figures 14 and 15 indicate that the reconstructed models still share the same topology. This result proves that the models reconstructed by Rec3FDNet do not require point cloud denoising and resampling, which provides a feasible method for the scale reconstruction of 3D fabric drape models.
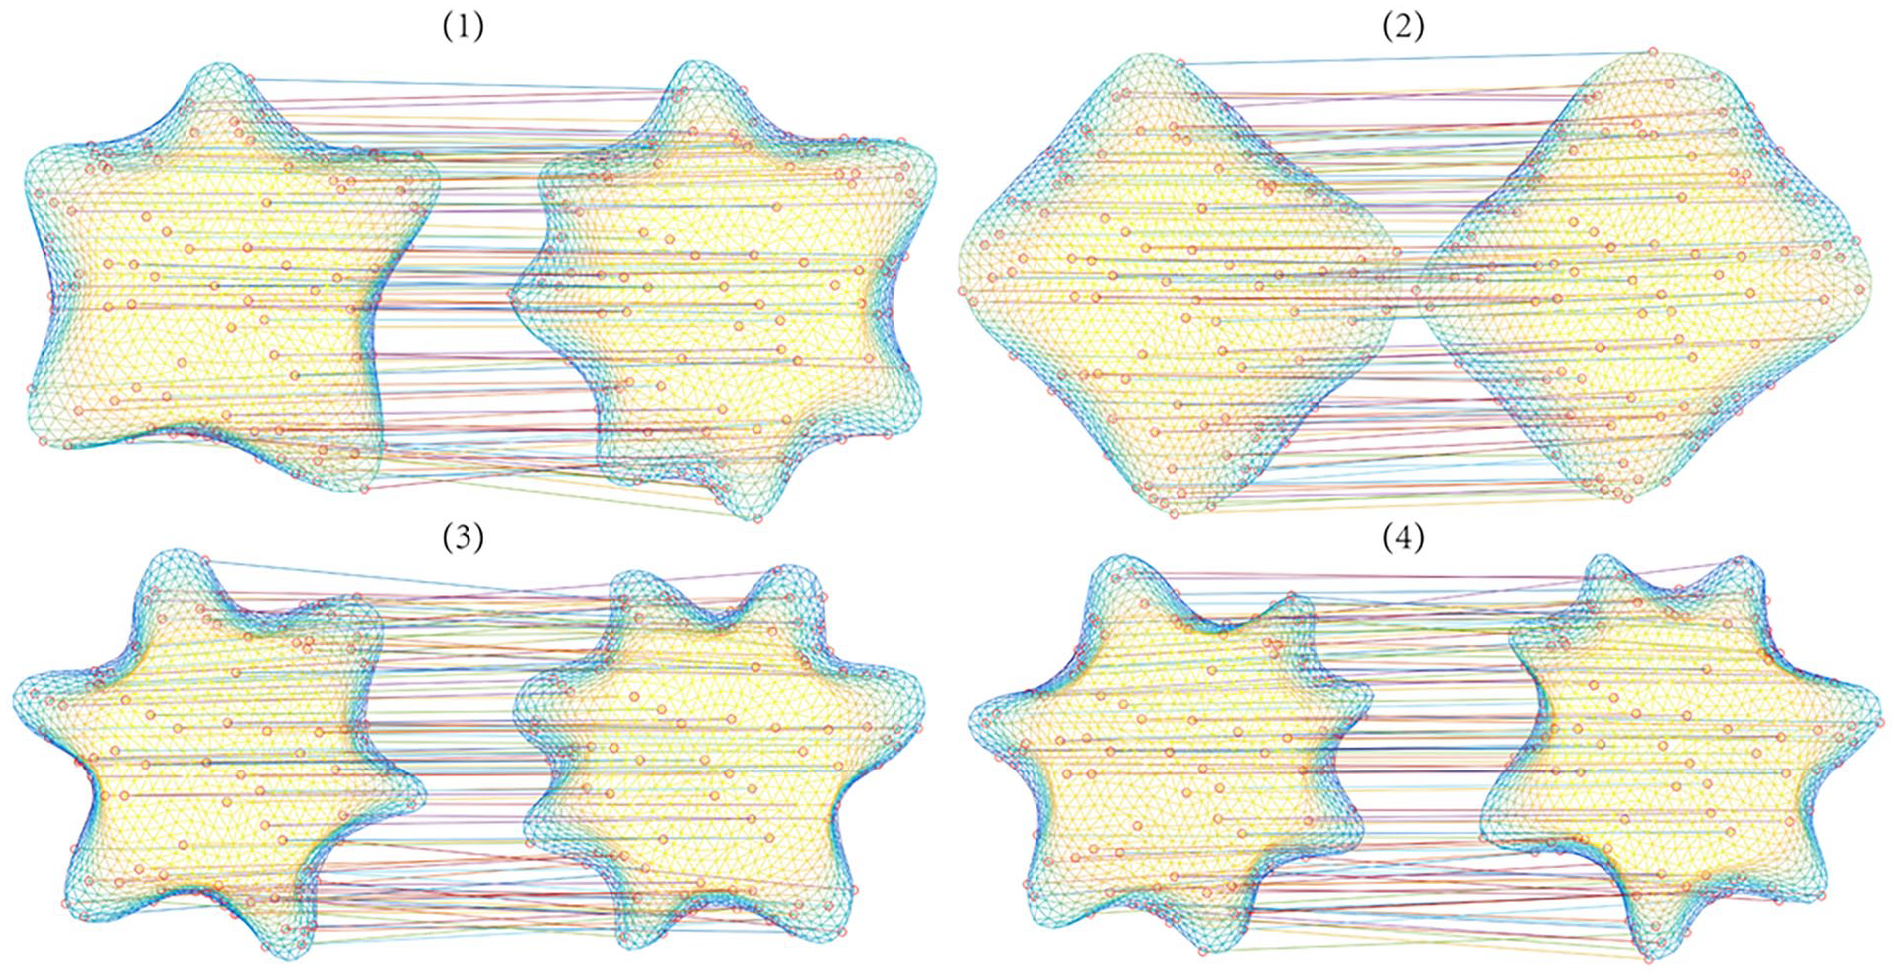
The lines between two vertices which own the same index in two arbitrary reconstructed 3D fabric drape models.
Conclusion
Aiming at the problem that the acquisition of 3D fabric drape model requires complicated instruments and post-processing, this study proposed the reconstructing a 3D fabric drape model with a consistent topology. Firstly, Ddrape, a dataset of 3D fabric drape model with consistent topology, was prepared. Secondly, Rec3FDNet, a deep learning network capable of reconstructing a topologically consistent fabric drape model, was constructed. Finally, while training Rec3FDNet with Ddrape, the loss function and initial mesh of Rec3FDNet, as well as the normalization of 3D fabric drape models in Ddrape were explored. Several conclusions were drawn as follows: (1) When training Rec3FDNet, both initial mesh 1 and initial mesh 2 are able to deform into desired 3D fabric drape model rightly. Initial mesh 3 contains more vertices, which means that it is difficulty to train Rec3FDNet under current conditions. (2) In terms of the loss function, MSE performs Chebyshev distance in computational complexity and time consumed because of the resampled 3D fabric drape model of Ddrape. (3) The normalization of 3D fabric drape models when training Rec3FDNet can improve the convergence speed of Rec3FDNet and reduce the training time. But the normalization of 3D fabric drape models does not significantly improve the reconstruction accuracy of the 3D fabric drape model. In this study, the graph convolution deep learning technique is applied to the 3D reconstruction of draped fabric, which not only eliminates the equipment required for 3D scanning and the post-processing steps after point cloud acquisition, but also results in higher reconstruction accuracy of the 3D model of draped fabric. The method proposed in this study can also be used for upgrading the traditional fabric drape meter.
Footnotes
Declaration of conflicting interests
The author(s) declared no potential conflicts of interest with respect to the research, authorship, and/or publication of this article.
Funding
The author(s) disclosed receipt of the following financial support for the research, authorship, and/or publication of this article: This work was supported by the Key Laboratory of Silk Culture Heritage and Products Design Digital Technology, Ministry of Culture and Tourism, China. Zhejiang Sci-Tech University Scientific Research Fund Project under Grant No. 23072223-Y.