
Abstract
To fill the binary image of draped fabric into a comparable grayscale image with detailed shade information, the three-dimensional point cloud of draped fabric was obtained with a self-built three-dimensional scanning device. The three-dimensional point cloud of drape fabric is encapsulated into a triangular mesh, and the binary and grayscale images of draped fabric were rendered in virtual environments separately. A pix2pix convolutional neural network with the binary image of draped fabric as input and the grayscale image of draped fabric as output was constructed and trained. The relationship between the binary image and the grayscale image was established. The results show that the trained pix2pix neural network can fill unknown binary top view images of draped fabric to grayscale images. The average pixel cosine similarity between filling results and ground truth could reach 0.97.
Introduction
Fabric drape performance is a special expression of fabric style in vision. The research of fabric drape is not only beneficial to the design of fabric but also provides a significant reference for fabric inquiry. Most of the research on fabric drape performance so far has focused on the characterization of drape capability, 1 the relationship between static drape performance and dynamic draping,2,3 the relationship between drape performance and mechanical properties,4,5 the relationship between drape performance and structural parameters, predicting drape coefficient,6,7 predicting drape morphology,8–12 new methods to capture three-dimensional (3D) model of draped fabric13–16 and so on. However, there are rare reports about the comprehensive comparative analysis of fabric drape performance. One important aspect which is rarely studied is fabric inquiry based on fabric drape performance. For example, how to find one or more fabric(s), which have the same drape performance with a given fabric sample, from a fabric sample library? Matching with the existing fabric drape indicators is a feasible method, but the disadvantage of this method is that these indicators can only characterize several single aspects of fabric drape performance. That is, the drape coefficient characterizes fabric drape-ability. The uniformity rate of the fabric drape angle characterizes the unevenness degree of fabric drape. However, the drape result of the same fabric under the same experimental conditions is discrete.17,18 Therefore, there will be an obvious error in matching fabric with the existing fabric drape indicators. Is there any fabric drape indicator that is stable of the same fabric under the same experimental condition and different testing times? Considering the theory that structure determines performance, the hierarchical structure between fibers and fibers during fabric draping is dynamically stable. Therefore, the mechanical properties, such as bending stiffness and shear stiffness, are also stable. It can be inferred that the distribution of local deformation determined by mechanical properties under the same condition and different testing times will also be stable. This inference provides theoretical support for analyzing fabric drape performance based on the local deformation of fabric drape. Prior to this, our research team effectively matched the 3D model of draped fabric based on deep learning, and the grayscale images are rendered with 3D drape models and achieved a credible effect. The matched fabrics have similar comprehensive drape performance and fabric style. However, the grayscale images applied in our previous work were rendered in a specified virtual environment. The most important fact is that the first step of our previous work is to scanning the 3D point cloud of draped fabric. Therefore, we attempted to replace the grayscale images that are rendered with 3D models with other types of fabric drape images. Existing fabric drape images are either binary images acquired by conventional fabric drape tester or color images with large differences in color texture. Binary images contain very little detail information, and obvious color and texture can dilute other features of fabric drape image. This will make the comparability between different drape images weaker. To this end, we propose to fill the binary images of draped fabric into grayscale images which have a uniform grayscale. Such grayscale images are not only comparable but also capable of reflecting the local deformation details of draped fabric. This study will support the fabric inquiry based on comprehensive drape performance.
Material and methods
The pipeline of filling the binary top view image of draped fabric into a grayscale image based on pix2pix convolutional neural network is shown in Figure 1. First, a 3D scanning device is constructed. Then, the 3D point cloud of draped fabric is captured with the scanning device. Once obtaining the 3D point cloud of fabric drape, the grayscale top view image and the binary top view image of draped fabric were rendered separately in two specified virtual environments. Finally, a pix2pix convolutional neural network is constructed to bridge the binary images and grayscale top view images of draped fabric.

The pipeline of filling the binary top view image of draped fabric.
Preparing fabric samples
Fifty-one fabrics collected from the market were washed and ironed to remove wrinkles on the fabric surface. The fabric samples were cut into circular samples with a radius of 120 mm, marking the center of the fabric sample. The circular fabric samples were conditioned for 48 h at a constant temperature and humidity laboratory (temperature: 23oC ± 2oC, humidity: 65% ± 2%).
Building scanning device and scanning fabrics
The 3D scanning device for fabric drape is constructed with four depth cameras by referring to the method of Wu. 19 The structure of the scanning device is shown in Figure 2(b).
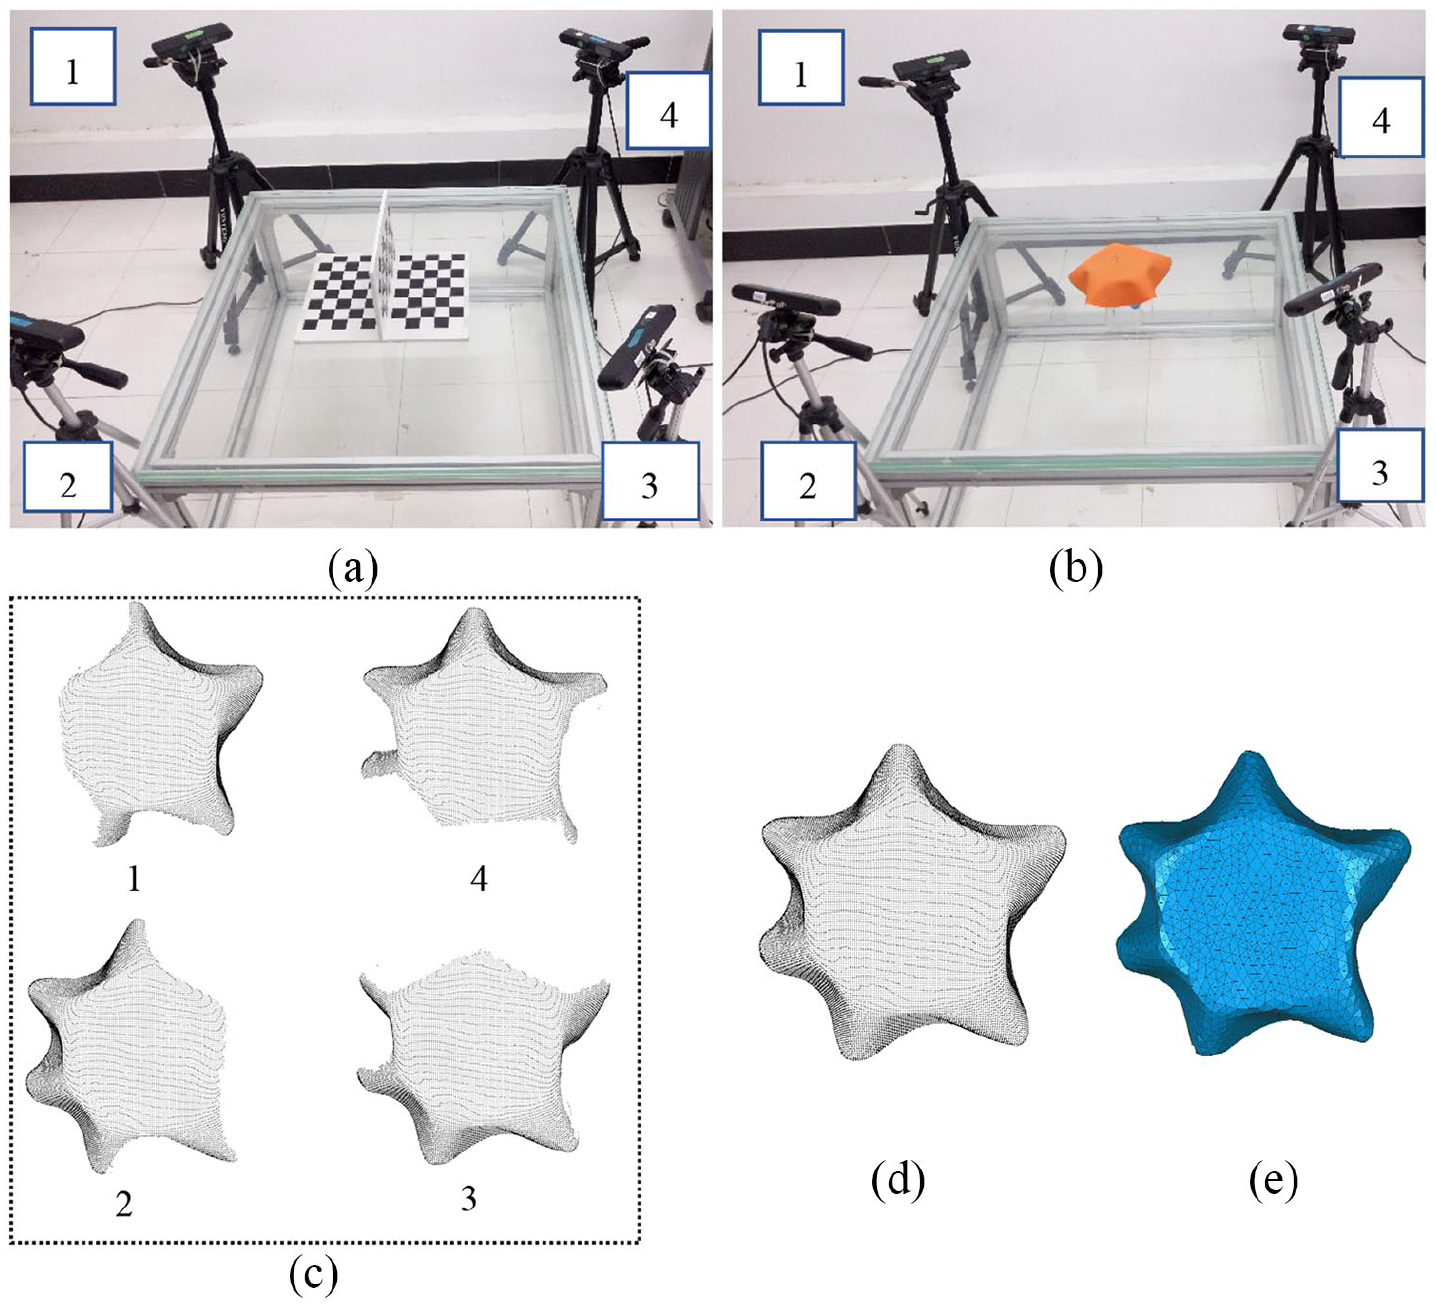
The pipeline of scanning fabric drape: (a) calibration, (b) scanning, (c) four patches, (d) completed 3D point cloud, and (e) 3D triangle mesh.
The fabrics were centered on a supporting disk with a radius of 60 mm surrounding by four red green blue (RGB)-depth cameras, as shown in Figure 2(b). The angle between two adjacent cameras is 90°. To reach an accurate scanning result, a T-shaped checkerboard as shown in Figure 2(a) was used to calibrate the extrinsic parameters of the four cameras based on the algorithm proposed by Zhang 20 and Wu. 19 Figure 2(c) demonstrates four point-cloud patches of draped fabric captured by each camera. They were fused to generate a complete point cloud, as shown in Figure 2(d). The corresponding triangulated mesh was generated after surface reconstruction, as shown in Figure 2(e). Fifty-one fabrics were draped 100 times separately. Therefore, 5100 3D point clouds were captured.
Rendering the grayscale and binary images of draped fabric
The 3D point cloud model obtained with the 3D scanning device was randomly rotated two times to increase the sample number. The rotation axis is vertically located on the supporting plane of fabric samples. The 10,200 new samples with random rotation were mixed with the original 5100 3D models. The grayscale image (Figure 3(b)) was rendered in a virtual environment. As for the rendering parameters, the color of the triangle face is set to white. The strength of ambient light is 0.3. The strength of the diffuse light is 0.6. The strength of specular light is 0. The camera is right on top of the fabric drape model. Several grayscale images rendered in this virtual environment are shown in Figure 3(b). With data augmenting, 15,300 samples were randomly split into a training set, a validating set, and a testing set. The binary images of all images in the training set, validating set, and the testing set were extracted (as shown in Figure 3(a)). The binary images were used as input images, and the grayscale images were used as the output images. The number of binary images and the corresponding grayscale images of the training sample is 12,240 separately. The number of validating binary image and the corresponding grayscale image is 1530 separately. The number of the binary images and the corresponding grayscale images in the testing set is 1530. Six binary images in the training set are shown in Figure 3(a). Six grayscale images corresponding to Figure 3(a) in the training set are shown in Figure 3(b).
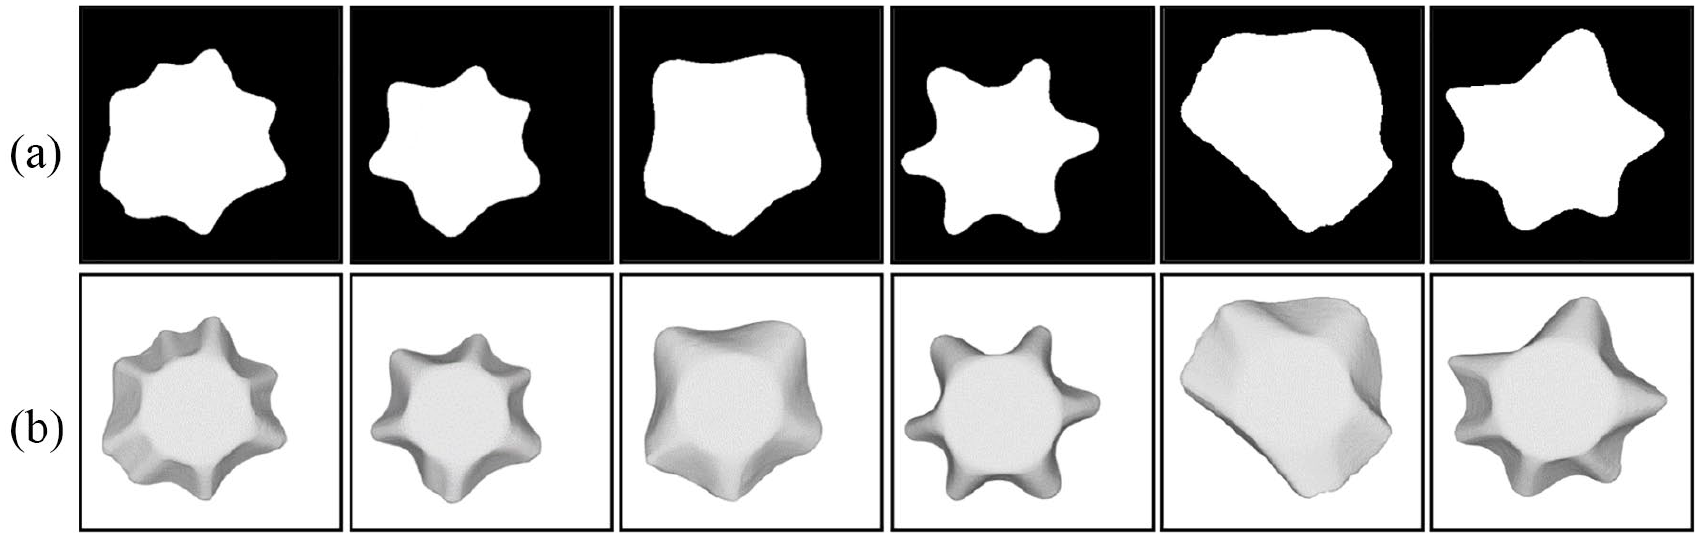
Training samples: (a) the binary images of draped fabrics and (b) the grayscale images of draped fabrics.
The structure and loss function of pix2pix convolutional neural network
Pix2pix convolutional neural network is an early proposed image translation network, which is essentially a variant of generating adverse neural network (GAN). Therefore, there are also a generator and a discriminator within a pix2pix convolutional neural network, as shown in Figure 4.

The schematic diagram of pix2pix neural network: (a) discriminator and (b) generator.
For discriminator (Figure 4(a)), the input image is subjected to four convolution layers with kernel size of

where
For the generator (Figure 4(b)), the input image is subjected to eight convolution layers with kernel size of
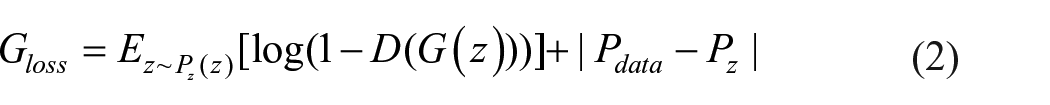
where
The input image of the pix2pix convolutional neural network is a binary image with a size of 286 × 286. The training label of the pix2pix convolutional neural network is a grayscale image with a size of 286 × 286. The optimizer is a gradient descent optimizer with a learning rate of 0.0001. The training period is 50,000. The central processing unit (CPU) of the computer is 2.8 GHz. The graphics processing unit (GPU) is NVIDIA GTX1060 with a memory of 6 GB.
Results and discussion
The loss functions of the generator and discriminator are shown in Figure 5(a) and (b), respectively.

The losses of discriminatory and generator in pix2pix convolutional neural network: (a) discriminator and (b) generator.
As can be seen from Figure 5, both the discriminator and the generator errors converge fast during the initial stages of training. When the training epoch reaches 30,000, the errors of generator and discriminator tend to be stable. Both the generator and the discriminator were optimized. In subsequent training state, the generator loss has certain fluctuations. The discriminator’s fluctuation relative to the generator is small. Two kinds of losses achieve a dynamic equilibrium state.
The binary images of testing samples, real grayscale images, and corresponding filling results are shown in Figure 6. Figure 6(a) shows the real grayscale images of four testing samples. Figure 6(b) shows the binary images of four testing samples. Figure 6(c) shows the filling results of the images in Figure 6(b). It is observed that the image filling results have a high degree of similarity to real grayscale images. When the ability of a fabric to drape is weak, as shown in the first three columns of Figure 6, the detailed features of filling results are almost identical to real grayscale images. For a sample with a strong drape-ability (as shown in the fourth column of Figure 6), the translation result is relatively larger than the real grayscale image. The reason for this problem may be that there are relatively few fabric samples with excellent drape performance in the training samples, and the training samples fail to reach an ideal equilibrium state.

The binary image, grayscale image, and filling results of testing samples: (a) the true grayscale images, (b) the binary images and (c) the filling results.
It is observed that there are obvious differences between the filling results and the real images in the global brightness. The results may show that the total loss of the generator in pix2pix convolutional neural network was composed of two parts, namely, mean square error (MSE) between filling images and real images, and the discriminator loss. When the weight of MSE loss in the generator is equal or smaller than the weight of discriminator loss, the brightness of filling images may be different from the real images.
As for the objective evaluation for the filling results, the pixel cosine similarity between real grayscale images and filling results was applied to objectively evaluate the accuracy and stability of the image filling method. This is because the purpose of this study is to fill the binary top view image of draped fabric with a pix2pix convolutional neural network. The essence of the image filling proposed in this study is to predict the local pixel trend of binary images. With filling images, different images own similar grayscale range. The shadow information of the single image was improved. The comparability between different images was increased. Therefore, the pixel cosine similarity between real grayscale images and filling results is reasonable in evaluating the filling results. The results show that the average pixel cosine similarity between filling results and real grayscale images is 0.97 and the variance is 0.011 for the 1530 testing samples. The results show that the image filling model has good precision and stability.
Conclusion
In this study, the 3D point cloud of draped fabric was obtained via a self-built scanning device. Then, the binary top view image and grayscale top view image of fabric drape were rendered in a virtual environment separately. Then, a pix2pix convolutional neural network was constructed and trained to draw the connection between the binary images and grayscale images of draped fabric. Two conclusions were obtained. (1) The image filling model proposed in this article can fill the binary image of draped fabric into a grayscale image. The pixel cosine similarity between filling results and real grayscale images reaches 0.97. (2) The filled single grayscale images contain more shadow information than the corresponding binary image. With a uniform grayscale range, different filled grayscale images contain stronger comparability than binary or color images of draped fabric. This study will support the fabric inquiry based on comprehensive drape performance.
Footnotes
Declaration of conflicting interests
The author(s) declared no potential conflicts of interest with respect to the research, authorship, and/or publication of this article.
Funding
The authors disclosed receipt of the following financial support for the research, authorship, and/or publication of this article: This work was supported by the National Natural Science Foundation of China (Grant No. 61572124) and the Special Excellent Ph.D. International Visit Program by Donghua University (DHU).