
Abstract
This paper introduces an unsupervised method for detecting regions with a high density of nanomaterials on coated fabric using Variational Autoencoder, a generative model capable of learning dominant features of the input data and generating similar outputs. The model was applied to images of cotton fabric coated with commercial single-walled carbon nanotubes (SW-CNT) to learn their features. Morphological and electrical properties of the coated samples were initially investigated to identify high-density particle regions. Subsequently, an experiment evaluated the performance of these samples in a specific smart textile application, establishing ground truth for defect localization in each fabric image. Image post-processing techniques were then employed to accurately detect defective regions in test images. The proposed method achieved a recognition rate of 93.2% and the highest Intersection over Union (IoU) of 0.923. This study demonstrates a promising approach for defect identification in coated fabrics, advancing smart textile technology.
Introduction
Detecting defects in fabric coated with nanomaterials holds significant importance across various domains due to their applications in functionality, sensing, responsive textiles, and healthcare/wearable technology. Previous research1–4 has elucidated that fabric coated with nanomaterials, such as single-walled carbon nanotubes (SW-CNT), exhibits enhanced conductivity, enabling multifunctionality, allowing the creation of smart textiles capable of sensing and monitoring environmental changes or physiological signals.5–10 Moreover, the utilization of SW-CNT-coated fabrics has been instrumental in the development of responsive and adaptive textiles, as demonstrated in studies by Wang et al. 11 and Iqbal et al., 12 showcasing their potential in dynamic applications where adaptability and responsiveness are crucial.
Nevertheless, despite the significant strides made in leveraging fabric coated with nanomaterials for enhanced conductivity and multifunctionality, there remain persistent challenges in detecting defects within these coated fabrics, especially within densely populated particle areas. These areas, characterized by substantial conductivity discrepancies compared to the fabric’s general surface, directly impact its electrical properties. The identification of these critical regions is indispensable as they directly influence the accuracy of data collection in sensing and monitoring applications, depicted in Figure 1. This importance amplifies notably in domains like healthcare and wearable technology, where precise localization of such regions on conductive fabrics is imperative.13–16 This precision is vital, especially in applications involving the monitoring of vital signs and the functionality of therapeutic garments.

Some applications of smart garments in sensing and healthcare technology.
In addressing the intricacies of fabric defect identification, diverse methods are employed through image processing, aiming to distinguish defective and defect-free areas or the boundaries of defective regions. In a recent study, Lin et al. 17 incorporated the gray-level co-occurrence matrix with redundant contourlet transform to extract texture features from segmented sub-images. These features were then employed to train a convolutional neural network for fabric defect detection. However, this method involved manual feature extraction, leading to time-consuming procedures and challenges in accurately pinpointing and extracting defects. In response to these challenges, attention has shifted toward deep learning methods, specifically generative models. In a study by Rui and Qiang, 18 an enhanced GAN (Generative Adversarial Network) combining both GAN and AE (Autoencoder), was proposed to reconstruct fabric images and locate defective areas based on differences between the original and reconstructed images. While this approach achieved a high recognition rate, it still presented some drawbacks, including the use of the Mean Squared Error (MSE) loss function in the model architecture, leading to the vanishing gradient problem,19–22 and hindering effective learning. Additionally, the manual definition of the threshold in the method proved time-consuming. Furthermore, this method employed defect-free data for model training, whereas for coated fabrics, defective patterns with highly dense particles are inevitable due to the manual nature of the coating process at the lab scale. This underscores the ongoing need for refined approaches to fabric defect detection in nanomaterial-coated fabrics.
Variational Autoencoders (VAEs) emerge as a promising alternative in navigating the intricacies of defect detection within nanomaterial-coated fabrics, such as SW-CNT. Extensively deployed across various studies, VAEs showcase their ability to detect fabric defects, even in real-time scenarios.23–25 By encoding inputs into a latent space and reconstructing high-fidelity outputs and operating on unsupervised learning principles, they prove instrumental in precisely identifying defects within complexly structured, post-coated surfaces. This shift toward VAEs represents an advancement in the pursuit of efficient and accurate defect detection methodologies for coated fabric.
Therefore, in this study, the authors present a deep learning method using a VAE network to identify defects in fabric coated with SW-CNT. Initially collected via scanning without labels, the fabric images underwent resolution adjustment and division into equally sized patches. These patches were fed into the Variational Autoencoder model to derive the distribution of compressed input features via the encoder. Random sampling from this distribution facilitated image reconstruction through the decoder, aiming for defect-free representations of dominant features. To pinpoint defects in the test dataset, additional image processing like intensity threshold-based masking and morphological techniques were applied. The encoding-decoding process is detailed in the Materials and Methods Section. The evaluation of network performance through visualization of defective regions in the query images is presented in the Results Section, followed by a comprehensive discussion and conclusion in subsequent sections.
Materials and methods
Data preparation
In this investigation, the procedure for capturing images of coated fabric in its original state involves a two-step process: initially applying a coating to the fabric and subsequently photographing the coated samples. The selection of cotton fabric as the focal point for this research arises from its seamless integration of electronic components for smart textiles with comfort and wearability, offering a breathable, washable, and biocompatible solution for sustainable and user-friendly wearable technology.26–29 The author utilized white cotton fabric, segmenting a large sheet into 48 samples measuring 70 by 130 mm each. These samples underwent a detailed coating process (depicted in Figure 2) where a coating of SW-CNT was applied. To confer conductivity, the 48 samples were immersed in 150 ml of commercial single-walled carbon nanotube (SW-CNT) liquid, featuring a SW-CNT-weight percentage of 0.1% with its diameter ranging between 1.1 and 1.4 nm (KORBON Co., Ltd, Korea) for precisely 10 min. Subsequently, water extraction occurred using a vertical padder machine, followed by a 10-min exposure to 150°C in a two-way drying machine. Figure 3 illustrates the sample both before and after the coating procedure.

The fabrication process of the SWCNT-cotton samples.

A cotton sample before (a) and after (b) the coating procedure.
For image acquisition in this study, each sample was scanned using a general scanner on one side, resulting in the generation of a 24-bit image per sample, depicted in Figure 3(b). Observing these images reveals that areas with a higher density of particles exhibit a darker color in contrast to the overall piece, indicating lower resistance. The variations in the electrical properties of this fabric can introduce inaccuracies in certain applications involving smart textiles. Consequently, the objective was to identify and extract these specific regions for further analysis.
To improve the contrast of these images and accentuate the darker regions, facilitating the VAE network in learning image features, the authors employed the Contrast Stretching method, which involves expanding the range of intensity values. Specifically, this process stretches the minimum and maximum intensity values present in the images to reach the potential minimum and maximum intensity values. The implementation of this enhancement technique follows equation (1) outlined below.

In which, s is the adjusted pixel intensity value, r is the current pixel intensity value,

The image of a cotton sample before (left) and after (right) applied the contrast stretching method.
Variational autoencoder – An overview
The Variational Autoencoder (VAE) stands as a prominent generative model for its capacity to comprehend the inherent probability distribution within a dataset and produce synthetic samples. Its architecture embodies an encoder-decoder structure: the encoder translates input data x into a latent space z, while the decoder reverses this process, translating the latent code back into reconstructed data. This dual-network system operates akin to an unsupervised autoencoder, creating a computational pipeline that facilitates the model’s functionality.
In our computational process, we employed the probabilistic encoding network
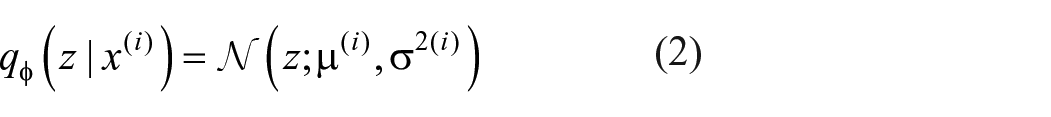
As can be seen from this equation, this normal distribution has two sets of parameters: mean (

In which,
As shown in Figure 5, the

where l represents the l-th noise

The architecture of a variational autoencoder network.
Training process
This section focuses on our Variational Autoencoder (VAE) model, tailored for pinpointing flaws within coated fabric surfaces. Our strategy integrates the VAE with a subsequent post-processing method specifically crafted to extract these regions. In the training phase, unlabeled images are segmented into patches and fed into the model to refine its parameters. During testing, the trained model employs the original image to extract compressed features, reconstructing an image based on these features. By comparing the original and reconstructed images, post-thresholding and morphological processing allow us to detect defects by analyzing the discrepancies between the two.
Encoder
The encoder incorporates a 2D convolutional layer to facilitate the learning of input features, specifically focusing on the probability distribution. The efficacy of the 2D convolutional layer in learning image features lies in its ability to capture hierarchical information, provide translation invariance, and enable efficient parameter sharing. This, in turn, allows for effective feature extraction and the establishment of a hierarchical representation within convolutional neural networks (CNNs).
The encoder network essentially constitutes a 2D CNN, where the input layer acts as a passive recipient of input data. The dimensions of this layer are
The architecture of the proposed VAE network.
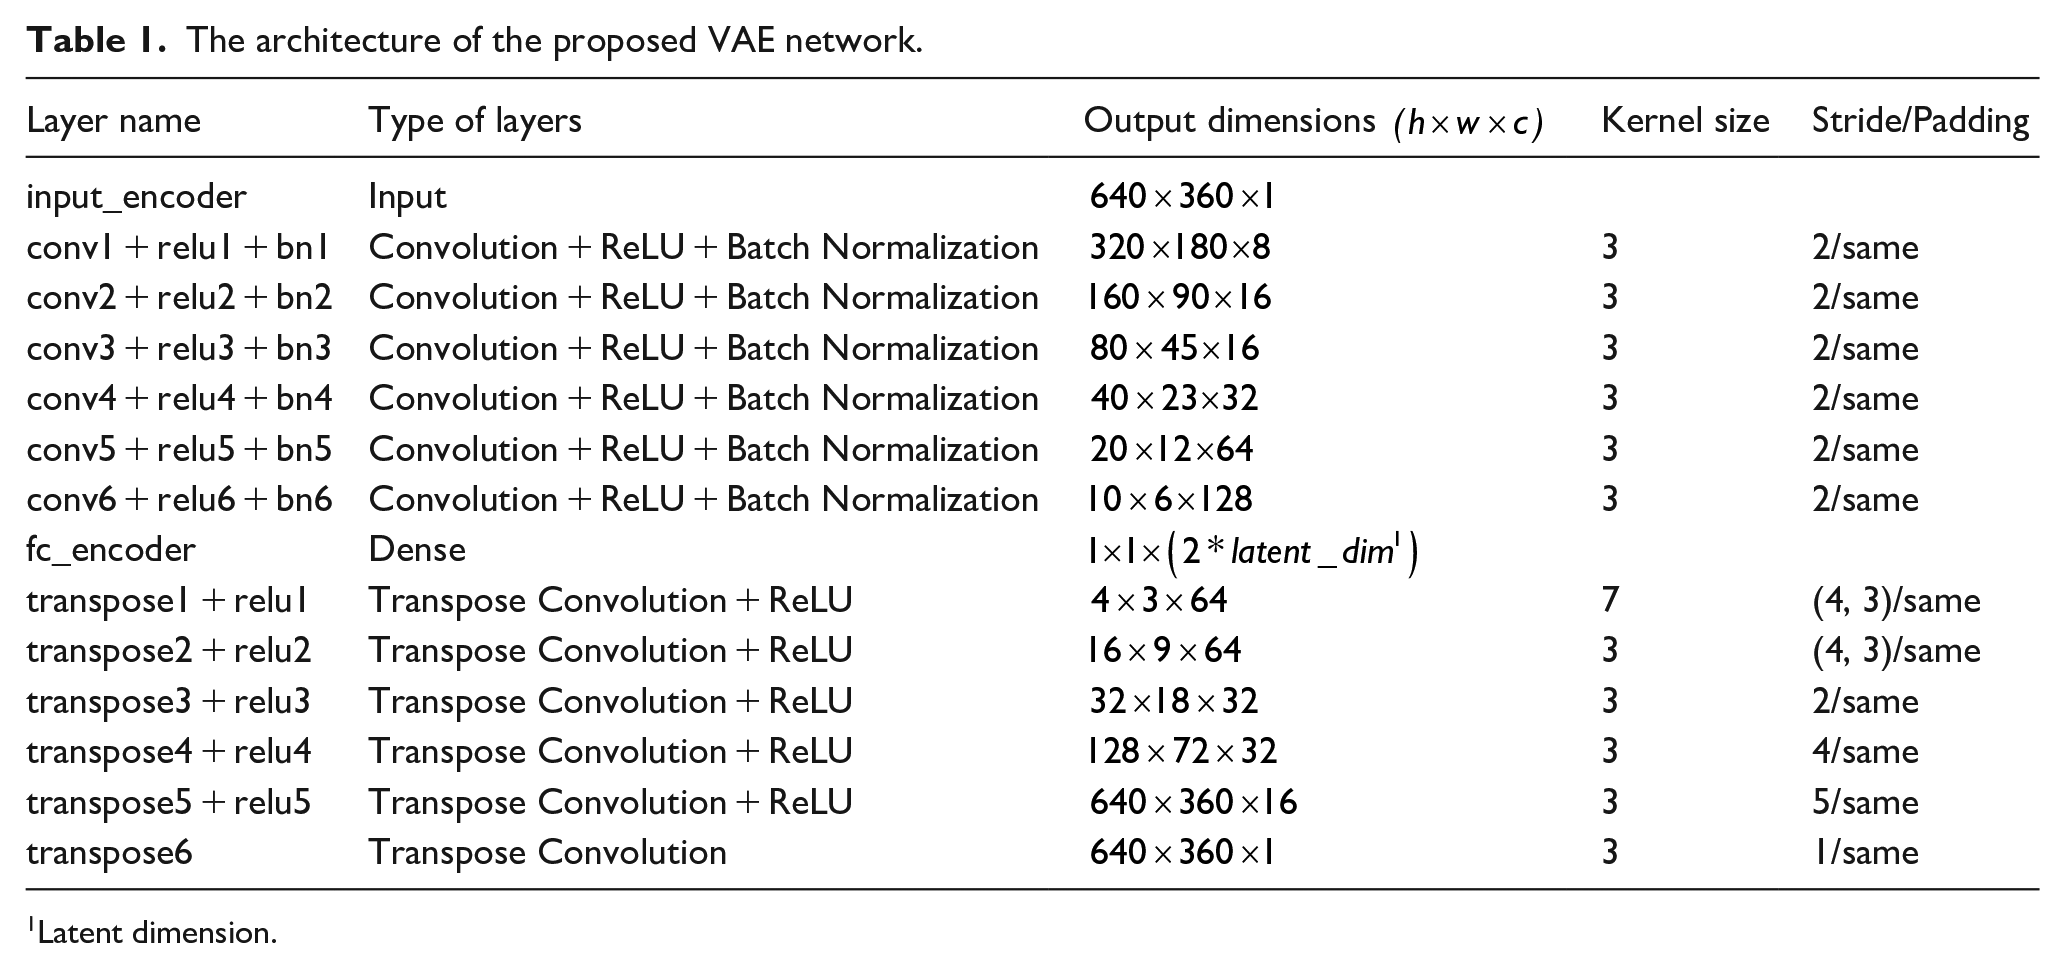
Latent dimension.
Sampling function – Reparameterization trick
The reparameterization process in a Variational Autoencoder (VAE) is crucial for introducing stochasticity into encoding, enabling the generation of diverse samples, and facilitating end-to-end training through gradient descent. Using the mean and logarithm of the square of variance matrices from the encoder, the latent variable is sampled from a unit Gaussian distribution with mean 0 and standard deviation 1. To simplify computation during the reparameterization trick, the output matrices of the encoder consist of the mean and the natural logarithm of the square of the variance, rather than the mean and variance themselves. Hence, the sampled variable undergoes scaling and shifting per equation (4) with some modifications as indicated in equation (5).

In which,
Decoder
In this phase, the decoder reconstructs data from acquired latent space representations, transforming the sampled latent variable z in equation (5) from encoded probabilistic representations into meaningful output samples. This process completes the generative cycle, yielding outputs that capture dominant input features and align with the original data distribution. The decoder model comprises six blocks, each housing a transposed 2D convolution layer and a ReLU activation layer. The transposed convolution, functioning as an up-sampling technique, is illustrated in Table 1 with input and output sizes. Similar to standard convolution layers, the transposed convolution layer is defined by padding and stride, with these parameters theoretically applied to the output for input generation. For the decoder network employed in this study, the padding parameter is set as “same,” determining the size of the generated output feature map (o) based on the input size (i) and the kernel size (k) by the following equation (equation (6)).

Defining the loss function
Suppose that there is a hidden variable z that generates an observation x. The characteristics of z, p(z|x) can be inferred from x using equations (7) and (8).


Because x is observed through z, the distribution p(x) becomes intractable. Hence, another distribution q(z|x), which is tractable, is employed to approximate p(z|x). By setting the parameters of q(z|x) to resemble those of p(z|x), it becomes possible to conduct approximate inference on the intractable distribution. This involves minimizing the KL-divergence between the two distributions, represented as M
This can be done by maximizing equation (9).

Therefore, the loss function for this VAE network consists of two terms and is defined in equation (10).

Overall, the VAE network architecture is summarized in Table 1 and the algorithm for training the VAR is shown in Algorithm 1.
Step 1: Initialize the network parameters
Step 2:
For i = 1 : num_epochs:
For i = j: num_batches:
1. Forward stage:
• Select k random samples from the training set.
• Input k samples into the encoder, get the mean value
• Reparametrize from the latent variable according to equation (5).
• Input the latent variable into the decoder, get the reconstructed data from its input.
2. Backward stage:
• Calculate the loss function according to equation (3).
• Update the network parameters

Where
End j.
End i.
Step 3: Return the encoder
Hyperparameters
As outlined in the Data Preparation section, the training dataset comprises 35 preprocessed images, from which 64 patches were randomly extracted per image, resulting in a total of 2240 patches. The validation set consists of seven preprocessed images, with 16 patches extracted from each image, totaling 112 patches. The entire network architecture was defined using MATLAB software (R2021b, Mathworks Inc., Natick, MA, USA) and fine-tuned during training. The training process utilized an initial learning rate of 1e−5, Adam optimizer, and a batch size of 64, equivalent to the number of patches extracted from each training image, conducted over 7000 iterations. Both the training stage and the inference process of the model, including post-processing, are depicted in Figure 6.
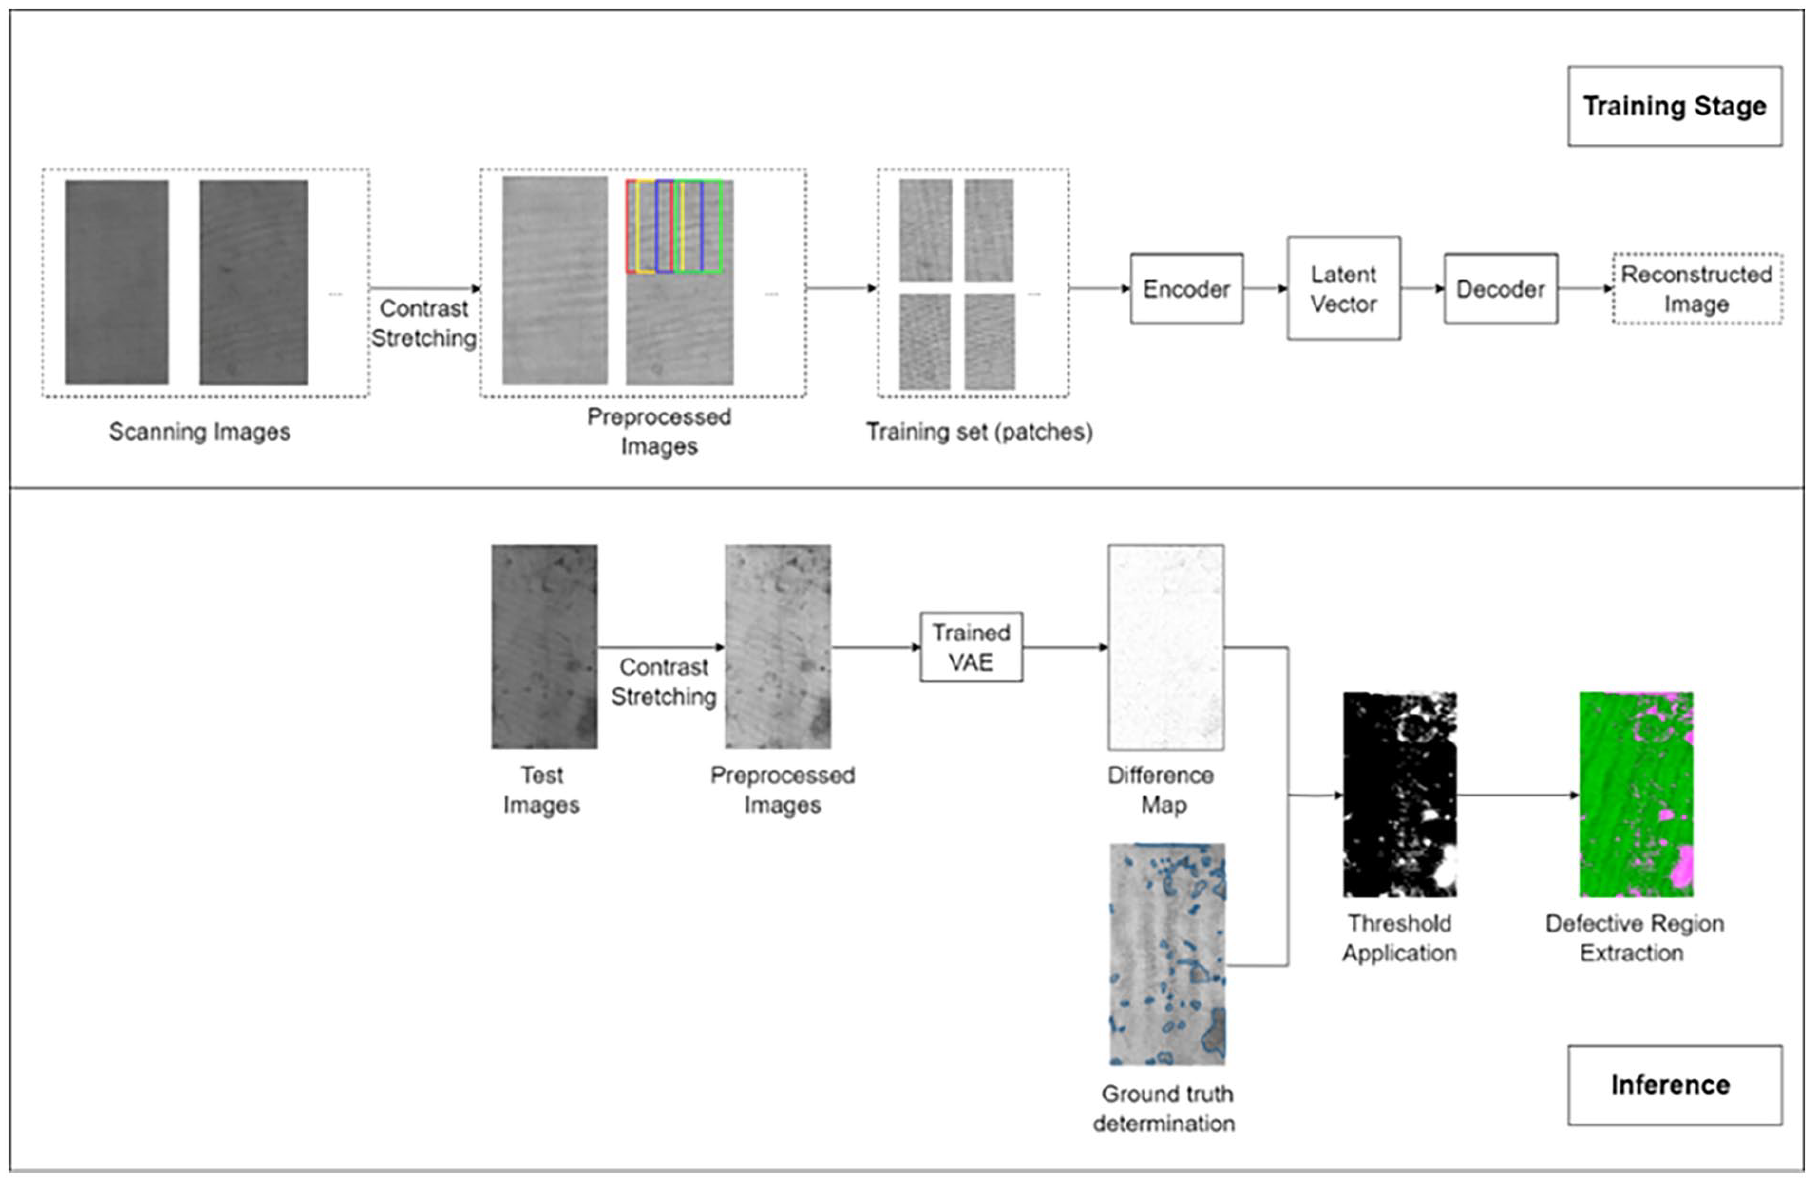
The flow chart of the coated fabric defect detection.
Results and discussion
Morphology and electrical properties of the coated fabric
Morphology evaluation
The morphological characteristics of the cotton sample post-coating with SW-CNT are depicted in Figure 7. Figure 7(a) exhibits a scanning image of one side of the sample following the coating procedure. Notably, darker areas or spots are discernible on the sample’s surface, contrasting with the majority of the fabric’s surface. This variation in color arises from regions with higher nanomaterial density, as evidenced in Figure 7(b)–(e). Specifically, Figure 7(b) and (d) represent scanning electron microscopy (SEM) images of the lighter-colored area, indicative of the overall sample color. Conversely, Figure 7(c) and (e) portray SEM images of the darker-colored regions.

(a) The scanning image of a SW-CNT-coated cotton sample and (b–e) the morphology of two regions in this sample.
Electrical property evaluation
In this section, we assessed the electrical properties of various dark regions within a sample by measuring their sheet resistance. Sheet resistance, a common electrical property of conductive fabric, is typically measured using a 4-probe method. 30 Initially, visual observations were made to identify areas with darker coloration compared to the fabric’s general appearance. These areas are delineated by the red boundaries in Figure 8(a). Subsequently, sheet resistance measurements were conducted on these delineated regions. The acquired results confirm the theory that between regions of the same area, darker regions have lower sheet resistance, establishing a correlation between sheet resistance and the darkness levels of the coated fabric. However, whether a dark region is considered defective depends on the application of the coated fabric. In this research, we focus on utilizing coated fabric for creating textile electrodes, crucial components in wearable technology for health monitoring, fitness tracking, and medical diagnostics. Among the functional and non-functional requirements for textile electrodes, electrical safety, and signal quality are paramount. Specifically, textile electrodes must meet safety standards to mitigate risks such as electrical shock or thermal injury, while also ensuring stable and reliable signal acquisition under various conditions, including moisture, sweat, and motion artifacts. Given the absence of an established standard for the optimal sheet resistance disparity to ensure fabric functionality in this application, we utilized electrical safety and signal quality as criteria to define the darkness level threshold for labeling regions as defective. A preliminary experiment was conducted to determine this threshold using fabric from Figure 8(a). Eight circular samples, each with a diameter of 20 mm, were excised, as depicted in Figure 8(b). Among these, four circles (green circles) were positioned outside the marked areas in Figure 8(a) (or from a sample with consistent color, as observed in other fabric samples), while the remaining four circles (yellow circles) encompassed progressively darker regions marked in Figure 8(a), ranging from the least (circle 1) to the most intense darkness (circle 4) within each circle. Care was taken to ensure that the area of the dark regions within each yellow circle was less than 10% of the whole circle area. This precaution was necessary because if the areas of high particle density are too large compared to the entire area of the electrode, the electrodes may not provide an effective muscle/nerve activation and even cause skin irritation or pain. 31 Each pair of green and yellow circles served as electrodes. These four pairs of circular samples were then designated to replace a pair of adhesive electrodes during electromyographic signal acquisition, following the methodology outlined in Chun et al. 15 This experimental setup aimed to evaluate the performance of textile electrodes in direct contact with the skin and their impact on signal acquisition. Post-experimentation analysis indicated that electrode pair (1) met the operational requirements for this application. Based on the experimental findings, it was concluded that the regions identified as dark in Figure 8(a) exhibited a significant sheet resistance difference compared to the entire fabric, exceeding 45%, thus qualifying them as defective regions, as shown in Figure 8(c). This determination underscores the importance of identifying and characterizing such regions to ensure the efficacy and reliability of smart textile applications. Assuming that conductive fabric with similar resistance behaves similarly, we applied this threshold to the entire test dataset to establish the ground truth for further evaluation.

(a) Dark regions in a test image were defined by visual observations, (b) cutting position of circular electrodes for EMG signal acquisition experiments and sheet resistance (Ω/square) of dark regions within the electrode area, and (c) ground truth defined after evaluating the experiment’s results.
Evaluation the model with test images
Figure 9 shows some images in the test set. All images were transformed from RGB to grayscale and processed with the Contrast Stretching method. For each sample, the left image (a) indicates the preprocessed image, while the ground truths defined by the method presented in the previous section are illustrated in the right image (b).

(a) Test images and (b) their corresponding ground truth.
To extract the defective regions, we first generated difference maps for each image by adding the test sample to its reconstructed image rather than subtracting them as in some previously proposed methods.18,23,32,33 This adjustment was essential because the reconstructed image encompasses features from the non-defective regions present in the training image. Notably, the dark regions observed in the training images correspond to defects resulting from the manual coating process. These regions lack specific shapes and occupy arbitrary-size areas within each sample. Consequently, although the training dataset comprises both non-defective and defective samples, the model primarily learns the dominant features of the images, particularly those of the non-defective regions, thanks to the convolution layers. As a result, the reconstructed images predominantly contain these features. Given the grayish color of the coated fabric, subtracting the two images would result in a darker image, making it challenging to locate the defective regions, which are expected to appear blackish. This effect is evident in the histograms of the test image, its reconstructed image, and the sum image of these two in Figure 10. Therefore, by adding the test sample and its reconstructed image, the goal is to increase the brightness of the resulting image. Consequently, the pixel values in the sum images tend to be closer to 1 (after normalization), representing the non-defective area, which appear very bright due to the high pixel values, whereas the defective regions exhibit a darker color. This approach facilitates the definition of a threshold for detecting dark (defective) areas, thereby simplifying the extraction of defective areas.

Histogram of the test image, reconstructed image, and sum image, respectively from left to right for each sample.
Figure 11 illustrates the binarization outcomes obtained from comparing the difference map to the original test sample. Following a sequence of procedures including intensity threshold determination and morphological processing, the defective regions were identified and masked. This binarization map was generated by eliminating all defective regions, as defined by the threshold, that encompass fewer than 70 pixels from the difference map. The connectivity of these pixels was configured as a three-dimensional and 18-connected neighborhood. The thresholds for generating the binarization map on the sum image were established in the HSV (Hue, Saturation, Value) color space. This choice was made over the RGB space due to its ability to separate color information from brightness information, facilitating the manipulation of images with indistinct color variations. Specifically, in this study, the dataset comprises grayish images with variations primarily in brightness rather than color. Thus, utilizing the value component in HSV space enables more efficient thresholding to capture these brightness variations.

Some images in the test set with ground truth (left) and their corresponding binarization map (right).
The results demonstrate the proposed method’s ability to accurately localize defective regions compared to the ground truth, achieving a recognition rate of up to 93.2%. Figure 12 illustrates the close correspondence between the masked regions in the difference map and the actual defective regions.

Some images in the test set with ground truth (left) and their corresponding masked region map (right). The blue-contoured regions have the darkest color, the red ones have dark and light patches, and the yellow ones have the lightest color.
Notably, in regions characterized by high particle density or darker colors, the masked regions exhibit completeness, encompassing the entire true regions delineated by the blue boundaries. However, upon examining the masked region map of the test dataset, it became evident that while the darkness level of defective regions correlates with the density of the masked regions, this relationship is not consistent across all defective regions. Some regions, marked in the figure within the red boundaries, exhibit variations in darkness within a single region. Additionally, these defective regions with both dark and light patches often result in masked regions surpassing the ground truth, indicative of over-segmentation and under-segmentation. Conversely, for lighter-colored regions (areas within the yellow boundaries), the masked regions may not fully cover the entire ground truth. Furthermore, the masked regions fail to capture variations in particle density or differences within the same defective region, primarily evident at the region edges. In some instances, the method struggles to separate adjacent regions with similar darker colors. This limitation underscores the challenges inherent in threshold-based segmentation tasks. The intersection over union (IoU) metric is employed to assess the degree of overlap between the masked regions and manually annotated regions, yielding a result of 0.923 for the blue-contoured regions, 0.795 for the red ones, and 0.563 for the yellow ones. Despite the relatively limited number of training images, the proposed method achieves a high recognition rate and an average IoU of 0.76 for the entire test dataset.
Conclusion
In conclusion, our study introduces an innovative unsupervised deep learning approach tailored for detecting defective regions on cotton fabric coated with SW-CNT, a material vital in smart textile applications. These regions, characterized by high particle density, pose distinct challenges in detection against the fabric’s background. Our proposed methodology combines the power of Variational Autoencoder, a generative model, with image post-processing techniques to precisely extract these defective regions. The results demonstrate the efficacy of the VAE model in learning compressed features from training images, even in the lack of defect-free samples. This methodology offers a promising solution for defect detection in coated fabrics, paving the way for advancements in smart textiles technology. Looking ahead, our future research endeavors will prioritize enhancing the speed and accuracy of image processing techniques for defect extraction. Additionally, we aim to extend the applicability of this deep learning model to encompass other non-conductive materials and nanomaterials, broadening its utility in diverse domains beyond the scope of this study.
Footnotes
Authors’ Note
Kim Jooyong also affiliated to Department of Materials Science and Engineering, Soongsil University, Seoul, Korea
Author contributions
As a corresponding author, Jooyong Kim was responsible for the whole structure construction, while Sehan Chun was responsible for sensor fabrication, experiment design, and data acquisition, Ngoc Tram Nguyen was responsible for experiment design, data processing, deep learning model design, and helping with experiments. The manuscript was drafted by Jooyong Kim and Ngoc Tram Nguyen. Finally, all authors read and approved the final manuscript.
Availability of data and material
Not applicable.
Declaration of conflicting interests
The author(s) declared no potential conflicts of interest with respect to the research, authorship, and/or publication of this article.
Funding
The author(s) disclosed receipt of the following financial support for the research, authorship, and/or publication of this article: This research was partly funded by the Technology Innovation Program (or Industrial Strategic Technology Development Program-Materials/Parts Package Type) (20016038, development of textile-IT converged digital sensor modules for smart wear to monitor bio & activity signal in exercise, and KS standard) funded By the Ministry of Trade, Industry & Energy (MOTIE, Korea) and Korea Institute for Advancement of Technology (KIAT) grant funded by the Korea Government (MOTIE) (P0012770).