
Abstract
The thickness and inner structure of porous fibrous structures - textiles is an important parameter, especially regarding comfort, noise, heat insulation, and permeability. The standard and probably the fastest thickness measuring method is with a thickness gauge, which uses a certain slight pressure, as well as other known methodologies. The paper presents an original methodology for evaluating the thickness of non-pressure-controlled porosity structures using their transversal packing density distribution. It also determines the maximum packing density value of the evaluated structure and the packing density level at which the thickness gauge approximately measures the thickness. The ratio of pressure-controlled and non-pressure-controlled thicknesses is used to define the proportion of the “incompressible” core of the fabric to its “compressible” surface. The packing density is evaluated in transverse virtual cross-sections of the structures using an image analysis tool. The standard soft cross-sections that are used could again cause some deformation of the studied structures, so the cross-sections were performed using Rigaku’s nano3DX computed tomography equipment. The methodology was tested on a set of seven diverse textile structures in terms of material and manufacturing technology. Each test specimen was evaluated for its internal structure through the transverse packing density process, the corresponding mentioned packing density levels were found, the non-pressure controlled thickness was determined, and the core and outlying fibers ratio was defined. The maximum packing density in the fabric core decreased as expected from the woven fabric through the weft and warp knitted fabric to the non-woven fabric. The maximum transverse packing density is independent of the thickness and the material used and, therefore, depends only on the structure. So is the packing density level at which the thickness gauge measures the thickness. This level has been set at 0.028 for knitted fabrics.
Keywords
Introduction
The fabric’s thickness somewhat influences its drape, hand, comfort, and thermal conductivity. 1 Fibrous textile structures contain a certain percentage of air in addition to the fibers and are, therefore, classified as porous structures. The more air a fibrous structure contains, the more compressible it is and the more difficult it is to define the transverse dimensions if a certain pressure is applied during measurement. The most utilized method using a thickness gauge 2 works with an instrument for transverse dimension measurement with a measured area of 20 cm2 under 1000 Pa, Kawabata evaluation system KES, 3 and also a set of the Fabric Assurance by Simple Testing FAST 4 both work with sensor pressure, although on a different principle. However, other options exist for measuring thickness, 5 where the authors obtain the transverse dimension from a real soft cross-section through a fixed fabric.
If we want to define the thickness of the fabric in its initial, relaxed state, that is, without any pressure, so-called non-contact, it is suggested to use some imaging techniques as in the previous source. 5 However, the soft cross-section methodology6,7 was used to prepare the samples, which will most likely modify, say deform, the given cross-section to some extent. The problem of possible deformation of the cross-section due to its fixation is eliminated when using virtual cross-sections using computer tomography (CT),8–10 where the sample is scanned in a relaxed, free state.
The problem of comparing the results of real and virtual CT sections is discussed in Ref. 11 The authors state that there is an 89% success rate of visualization of porous structures due to CT.
Historically, CT has been primarily used in medicine, 12 13 but nowadays, it plays an important role in many other industries, such as aerospace, automotive, electronics, medical devices, plastic components, and metalworking. 14
CT also plays a role in the textile field, from fibers to textiles and their porosity to textile composites. The use of CT to reconstruct the internal structure of fibers and different sections of specific regions of nanocomposite fibers is presented in Ref. 15 In Ref. 16 , the area weight of fabric and nonwoven fabrics is evaluated by standard macro procedure and through CT. The creation of a parametric 3D fabric model from CT images is addressed in Ref. 17 The model is then extended and successfully applied to a 3D-injected textile woven composite. Tracking the porosity of a parachute fabric in 3D (micro CT) under 2D loading is shown in Ref. 18 In Ref. 19 , the porous structures are represented, and their parameters are defined using X-ray tomography. It describes the shape of the pores as cubic, applying structural and heat conduction models due to the complex fibrous structure. Analyzes of porosity apply 2D (SEM) and 3D (CT) techniques to describe pores using fractals.
The percentage of air in discrete structures is called porosity, defined as the fraction of the air volume in a given formation relative to the total volume of that formation.8,20–22 A complementary parameter to porosity is then the packing density of a given formation.7,23–26 Although these are volume definitions, the parameters can be simplified for very thin cross-sections from the ratios of the corresponding areas.7,23–25
The twist-strengthened fibrous length formation - the yarn - uses this planar interpretation of the packing density for the subsequent definition of the so-called effective diameter or transverse dimension. First, the fibers are defined as objects in the yarn cross-section image, then their centers of gravity are calculated, from which the center of gravity of the whole cross-section is obtained. A set of annuli is placed in the center of the cross-section, where the packing density is computed. The dependence of the packing density on a given annulus’s radius is called the radial yarn packing density curve. 7 From this waveform, an approximate value of the so-called effective yarn radius can be deduced, according to Ref. 27 , at a packing density value of 0.15.
This paper presents an original approach to describe the internal structure of the planar fabric through the transverse packing density process from CT sections. The sample scanned by computed tomography is not transversely deformed. Therefore, there is zero influence on the internal structure and thickness of the object under study. Through image processing, a transverse packing density distribution is obtained, from which the thickness of the fabric at the zero packing density limit and the maximum packing density are subtracted. From the thickness measured by the thickness gauge (at a pressure of 1 kPa), the level of packing density at which this thickness was approximately measured is found by iteration. On the progress curve of transversal packing density, the ratio of core and outlying fibers of the fabric is defined by the previous packing density level. The methodology is tested on seven different production technology and material samples. The results confirm the applicability of the developed method and provide additional questions for future research.
Method description
The proposed method can process a set of images of cross-sections by any discrete structure. It is primarily intended for processing CT virtual cross-sections, but it also enables the evaluation of, for example, images with soft cross-sections. This paper aims to analyze the porous structure and its thickness without any external pressure; therefore, CT virtual sections will be processed. The cross-sections must satisfy only one condition: their axis has to be vertical, that is, perpendicular to the x-axis of the image coordinate system. Either sagittal or transverse plane cross-sections can be used to study inner structure and thickness.
Figure 1 schematically shows the principle of the method, based on processing images of a certain number of transverse virtual sections through a given porous structure.
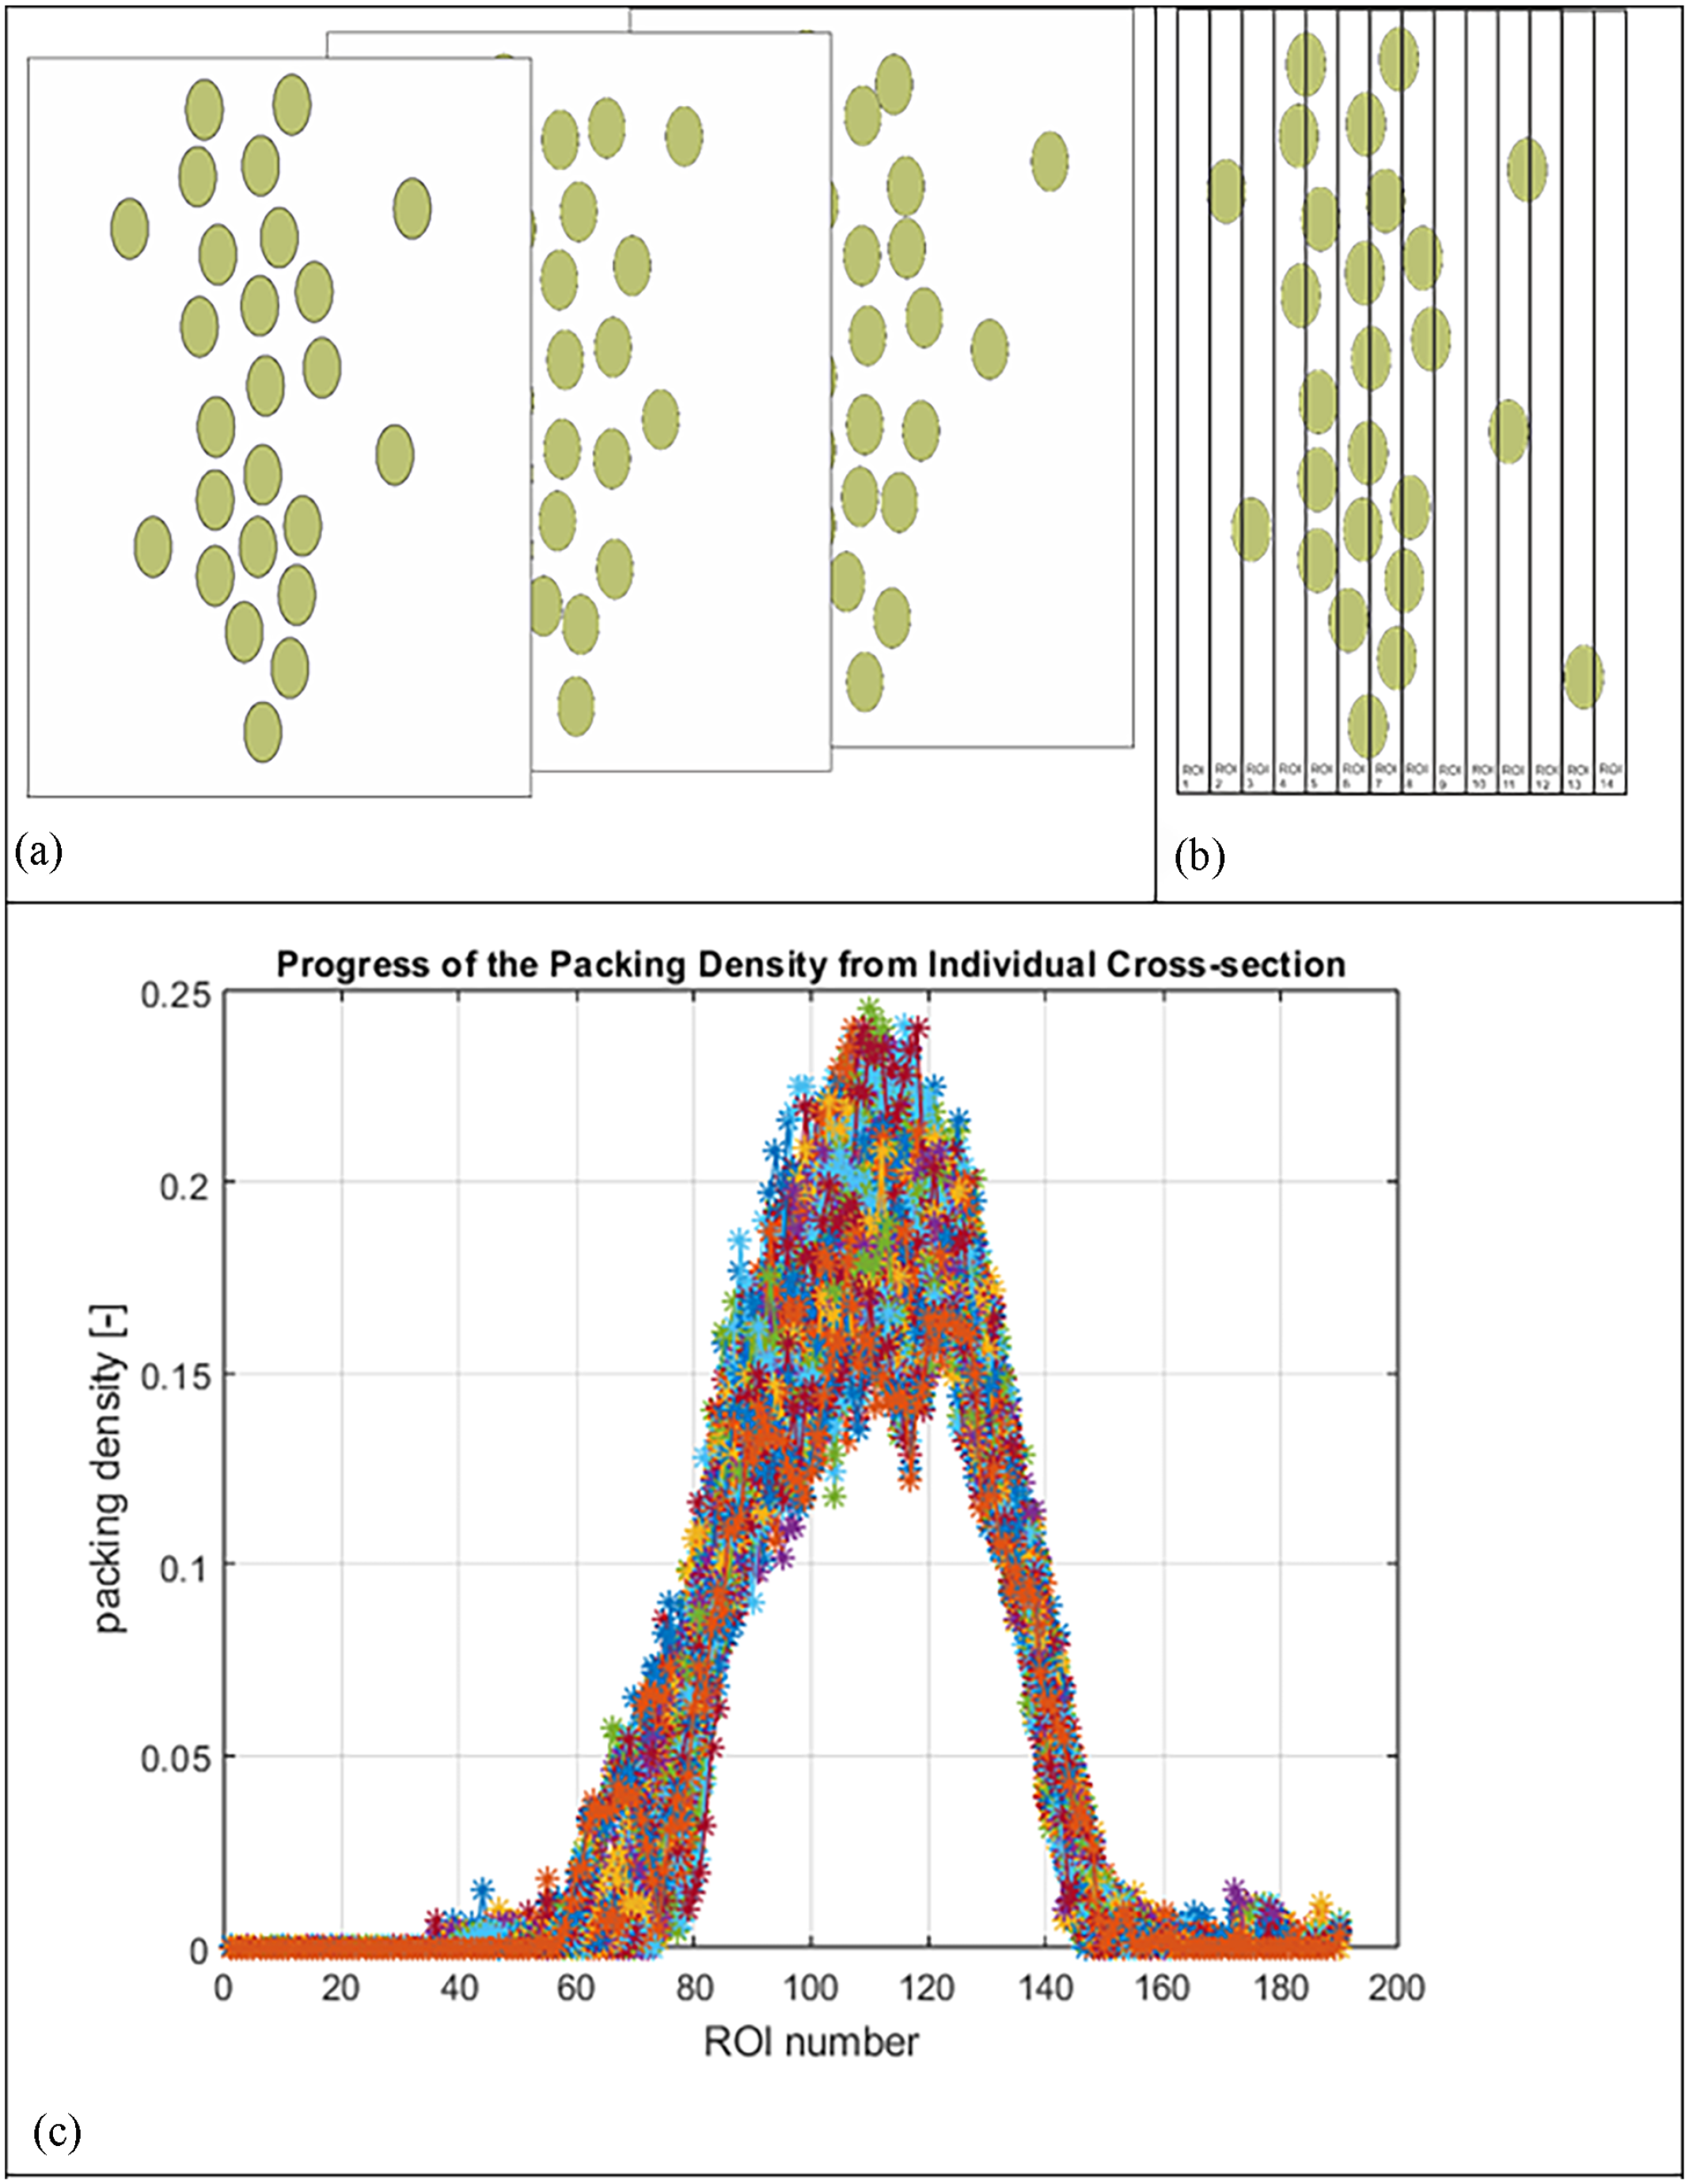
Schematic representation of the processing of a series of cross-sections: (a) a set of cross-sections, (b) application of the ROI mask, (c) transverse packing density distribution for 100 cross-sections.
A mask of ROIs (Figure 1(b)) is attached to each cross-section set (Figure 1(a)). Each ROI in this mask has the same width, and its length is equal to the height of the image. The width of the ROIs in the mask was chosen to be similar to or smaller than the diameter of the particle (fiber cross-section). Since the goal was to determine the packing density of the fabric cross-section, the entire mask’s width had to be equal to or greater than the perpendicular distance of the outermost objects in the image. The packing density of a ROI is defined as the ratio of the cumulative area of the fibers in a given ROI to the area of that ROI. The transverse packing density of each cross-section depends on the ROI packing density and the number of ROIs, see Figure 1(c).
A specially developed script further processed the data, that is, the number of ROIs and the corresponding packing density, for all cross-sections in MatLab.
Figure 2 presents the image processing procedure on a particular virtual CT cross-section.

(a) Image of a flat fabric cross-section with a mask attached - circular ROI, (b) Image of a flat fabric cross-section with an attached mask of 34 ROIs.
Image processing of the cross-sections was performed using Nikon Imaging Software (NIS-Elements) by Laboratory Imaging. 28 First, a sequence of images of the cross-sections of a given fabric was opened. NIS-Elements allows working with a set of images at a Z axis (thickness). The images are stored in a so-called nd-sequence, which acts as a single file with a certain number of images. In the nd-sequence, reviewing individual images and running a sequence of images at different speeds is possible. Still, most importantly, it offers the application of editing and working on all images simultaneously.
This was followed by adding a circular ROI (region of interest) due to excluding dark edges around the circular probe, see Figure 2(a). Then, the image (or the whole sequence of images) was thresholded in the ROI mask. The threshold was chosen based on Otsu’s method, 29 where the fibers were set as objects. The fibers are defined by their contours in the resulting binary image. In the following step, these binary objects are filled.
Figure 2(b) shows a discrete shape cross-section, thresholded individual objects displayed through an overlay image, and a 34 ROIs mask with constant length and width. For clarity, the ROIs here have a larger width than they should have (see explanation above).
Measurements were then made. The NIS-Elements image analysis for each ROI determined the proportion of object area to total ROI area, so the packing density of the fabric cross-section in each ROI was practically calculated. Since we were working with a sequence of images, the same procedure was performed simultaneously for all images.
One hundred randomly selected images of textile CT cross-sections from the whole 3 × 3 mm sample were processed each time.
Figure 3(a) shows the average transverse packing density distribution of the flat fabric. Four essential parameters are marked on the plot: μmax, μlevel, and regions 1 and 2. The parameter μmax is simply the maximum packing density value of the entire transverse packing density distribution. It will be used to calculate μthe level, determine region 2, respectively.

(a) average progress of the transversal packing density, (b) fabric cross-section: 1 – thickness from the packing density progress, and (c) fabric cross-section: 2 – thickness from the thickness gauge.
Area 1 defines the thickness of the fabric at its zero-packing density limit, that is, theoretically 0% of μmax.
The output is not directly the thickness but the value of the difference of the given ROIs. This value must be multiplied by the width of the ROI in micrometers. Schematically, this thickness is shown in Figure 1(b). Assuming zero transverse pressure during CT scanning, we consider this thickness to exist without pressure. The next assumption relates to the standard thickness measurement methodology reported in the introduction using a thickness gauge. The thickness gauge measures the thickness of the fabric at a pressure of 1 kPa by default. 2 We will consider the compressible surface layer of the fabric (outgoing fibers, fiber loops) and the incompressible core 1 at this pressure. The compressible layer has a very low packing density, that is, a high porosity. The large number of pores gives the fibers in this area space to move due to the pressure generated. We assume that these fibers (red objects on Figure 3(b) and (c)) slip into the gaps on the surface of the incompressible region of the fabric (green objects on Figure 3(b) and (c)). Thus, their resulting presence does not significantly change the thickness from the thickness gauge and can also be approximately defined on the transverse packing density curve - region 2 in Figure 3(a). If we have information about the thickness of the fabric from the thickness gauge and the transverse packing density curve, it is possible to determine the so-called μlevel. This packing density value is calculated at a certain percentage level from μmax. The delineated area 2 on the level μlevel in Figure 3(a) corresponds approximately to the thickness measured by the gage. The described four-parameter search procedure is performed on all the sub-curves from the given cross-sections. The indicators of the basic statistics are then calculated. An interesting output of the presented methodology is also the portion of the mentioned incompressible part of the fabric

and the portion of the compressible part of the fabric

Tested fabrics and used conditions for capturing
The method was tested on seven samples of flat fabrics, representing a broad spectrum of production technology and materials used (Table 1).
Overview of the tested fabrics.

The scale of the images in Table 1 corresponds to 5000 μm. These illustrative images were taken with a macroscope Navitar stereomicroscope: magnification of 1–6.5× (with additional optics of 5-416×), Nikon camera, NIS-Elements 5 image analysis.
The textiles were scanned with a nano3DX CT scanner from Rigaku; each sample size was 3 × 3 mm, target material: Cu, accelerating voltage: 40 kV, current: 30 µA, and the image calibration was 2.09 μm/voxel. Figure 4 shows an example of one CT cross-section each time, with the boundaries marked “From Packing Density” – region 1 (Figure 3(a)), “Thickness Gage” – region 2 (Figure 3(a)), and the associated transverse packing density progression with the μlevel.

Examples of virtual CT cross-sections with marked borders (scale indicates length 500 μm), course of transverse packing density with border μlevel (green line).
Results and discussion
Table 2 summarizes the thickness values measured by the thickness gauge and the thickness from the transverse packing density process at 0% of the maximum packing density value, that is, even with outlying fibers. A visual comparison of these two results for each type of test specimen is also possible directly on the CT images (see Figure 4). At the same time, the results are presented graphically in Figure 5.
Summary of measured thicknesses for seven flat fabric samples.

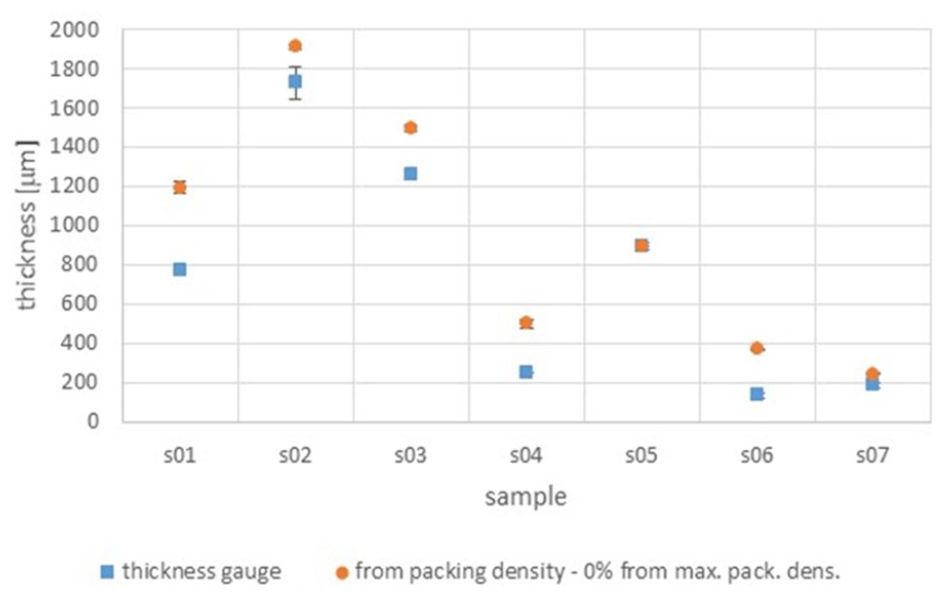
Graphical interpretation of thickness measurement results by thickness gauge and at 0% level of maximum packing density.
Based on the comparison of the thickness measurements with the thickness gage and from the transverse packing density process at 0% of the maximum packing density, it can be concluded that almost all samples (from the weft and warp knitted fabric (s01 - s03) to the woven fabric (s04) to the nonwoven fabric (s06, s07)) showed statistically significant differences. The values from the transverse packing density progression at 0% of maximum packing density were consistently higher than the results from the thickness gage. The thicknesses from the two approaches matched only for the technical coated fabric (s05). This fact can be seen from Table 2 and the graph in Figure 5, as well as from the sample CT images with marked thickness boundaries from both measurements in Figure 4. The results demonstrate a certain compressibility of the fabric by the 1 kPa pressure used in the thickness gage measurements and, thus, the presence of a compressible and incompressible part of the given test samples. The following analysis of the transverse packing density progression of the seven test samples deals with the issue of these two parts of the fabric in more detail.
From the transverse packing density process, the maximum packing density value of μmax was found (see Figure 3(a)). The values of the fabric thickness at 0% level from μmax are presented in Table 2 and the graph in Figure 5. Next, the percentage level from the maximum packing density of μmax was found by iteration, at which the thickness from the thickness gage is approximately located. The value is always listed next to the sample label in Table 3. The corresponding packing density level μlevel was then calculated, see Figure 3(a). The iteration started at 0% of μmax (Figure 3(a) – region 1), and its value was gradually increased with a 0.5% step until the thickness value from the transverse packing density progression reached that from the thickness gage. One hundred randomly selected CT cross-sections from the whole sample were used for the given calculation. Finally, for each observed sample, the level of the incompressible part of the fabric (core) – equation (1) and its compressible part (outlying fibers) level – equation (2) were calculated. All the outputs are listed in Table 3.
Summary of parameters from transversal packing density progress for seven flat fabric samples.

The maximum transverse packing density μmax of fabric is always located in its core, as seen from the transverse packing density curves in Figure 4. From the results in Table 3 and the graph in Figure 6, it is clear that the nonwoven textiles (s06, s07) are the least filled. Then, knitted fabrics (s01, s02, s03) have the higher packing density, and woven fabrics (s04, s05) have the highest. The given fact corresponds to the structure of the samples. The packing density of the sample is independent of its thickness (Figure 7 - the correlation coefficient is 0.0424) and material (Figure 6 - the red circled area indicates CO and PA knitted fabric samples).
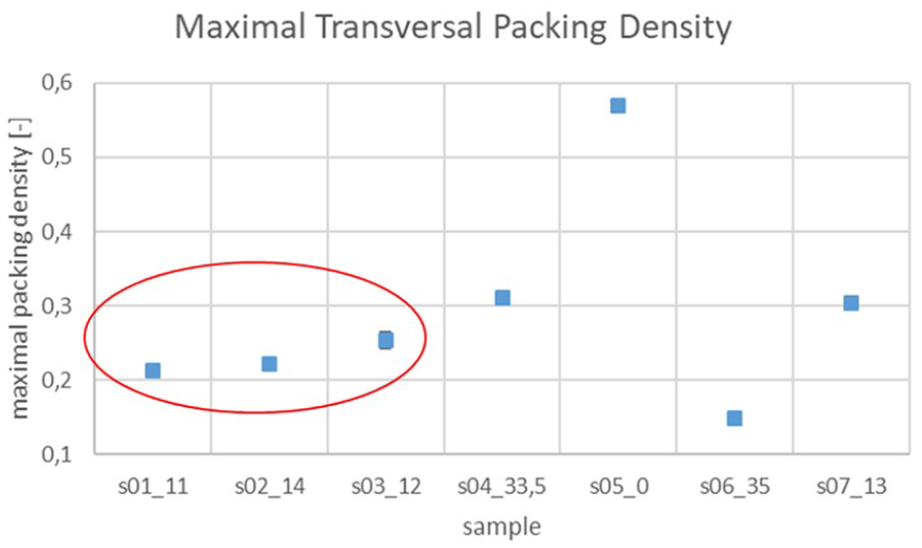
The maximal transversal packing density of seven samples.

Correlation between maximum transverse packing density and thickness.
The percentage level of the maximum packing density at which the thickness from the thickness gauge was located was evaluated from the packing density progression. This was followed by the calculation of the specific packing density for this level μlevel, see more detailed description above and in the results in Table 3. A similar parameter exists for staple yarns. Its value is 0.15 and is used to determine the effective diameter from the radial packing density progression (Introduction). 27 The graph in Figure 8 shows a significant dependence of μlevel on the fabric structure. Thus, it is not possible to determine a uniform μlevel for all types of porous structures. However, it shows that for the tested group of knitted fabrics (s01, s02, s03), the parameter values are not statistically significantly different from each other, Figure 8, red circled area. Therefore, it is possible to design μlevel for knits on which the “incompressible” thickness is read. Thus, the μlevel value calculated by averaging the three existing values is 0.028.

μlevel values for each fabric tested.
Table 3 shows one last piece of information that can be obtained from the transverse packing density process: the representation of the incompressible (core) – equation (1) and compressible part of the fabric (outlying fibers) – equation (2). A graphical representation of the proportions of these regions in the cross-section of the fabric is shown in Figure 9.

Schematic representation of the portion of the compressible and incompressible part of the cross-section of the observed samples.
For fabrics made from staple fibers, the percentage of outlying fibers can practically represent the hairiness of the fabric on the reverse and face side, which undoubtedly affects the hand. The percentage of outlying fibers (compressible area) is higher for staple fiber textiles (s01 – knitted fabric, s04 – woven fabric, and s06 – non-woven fabric). The technical coated fabric – s05 showed zero presence of a compressible layer due to the surface treatment.
Conclusion
The paper presents an original approach to the description of the internal structure of the flat fabric using CT sections and the transverse packing density process evaluated from them. The paper describes the processing procedure of the section images in an image analysis. It defines the tools used, such as ROI for easier thresholding of the section image and ROIs for subsequent calculation of the transverse packing density progression. It establishes assumptions about the behavior of fibers in a compressible fabric layer. 1 With these, it then shows where to determine μlevel, the threshold for subtracting the incompressible thickness from the transverse packing density progression. This thickness corresponds to the thickness measured by a thickness gauge with a pressure of 1 kPa. With the CT images taken without any transverse deformation of the sample, the uncompressed thickness is evaluated from the transverse packing density process. The percentage of core fabric and outlying fibers is determined from the knowledge of the percentage of compressible and incompressible parts of the fabric.
The methodology is tested on seven different textiles. The porous structures are variable in production technology (weft knitted, warp knitted, woven, non-woven) and material (natural, chemical). The proposed approach has been successfully applied to all types of textiles. The shape of the transverse packing density process is influenced by the structure of the studied fabric and the maximum packing density value μmax in the fabric’s core. The results show that the maximum packing density of the samples increases in the series of nonwoven, knitted, and woven fabric and is independent of the thickness of the sample. A smaller value of maximum packing density, that is, greater porosity, is reflected in the more excellent permeability of the fabric, in its lower ability to insulate heat and sound. The shape of the transverse packing density curve could theoretically correspond to the transversal cross-sectional pattern of the comfort properties mentioned above. The value μlevel, that is, the level for reading the thickness of the incompressible part of 1 kPa, again depends only on the structure of the fabric. Three types of knitted fabrics were tested, for which μlevel was set to 0.028.
The last output from the transverse packing density process and the knowledge of μlevel is finding the definition of the portion of the incompressible part of the fabric (core) and the compressible part (outlying fibers). The fraction of the core is related to the ability of the fabric to transmit the force under stress. In this part, the fabric is 1 kPa incompressible, that is, stable in a certain way, and there is a higher packing density than in the compressible part. The greater the core portion and the greater the μmax, the more likely contact points will be between the fibers. In the actual loading, these two factors contribute to greater friction between the fibers, hence a more remarkable ability to transmit the applied force. The most significant potential in this respect hold technical fabrics (s05) and warp knits (s02, s03). However, it is necessary to consider the idea only within the same sample production technology. For now, this is only a speculation, and conclusions require combining the results of the presented methodology with those of the mechanical properties experiment. The percentage of outlying fibers is also an interesting outcome in terms of a possible comparison with the hairiness of flat textiles. So far, the value μlevel has been proposed only for knitted fabrics. For a universal application of the presented methodology, it is necessary to determine this value for other types of porous structures within the framework of their manufacturing technology on which μlevel depends.
The presented methodology certainly has limitations, especially regarding the availability of CT equipment and time consumption.
Footnotes
Data availability
The data that support the findings of this study are available from the corresponding author upon reasonable request.
Declaration of conflicting interests
The author(s) declared no potential conflicts of interest with respect to the research, authorship, and/or publication of this article.
Funding
The author(s) received no financial support for the research, authorship, and/or publication of this article.