
Abstract
Impact experiments of thick fabric carbon/epoxy laminate specimens, with small thickness ratio, are conducted at distinct energy levels and thicknesses to characterise the damage process. These specimens and loading conditions are representative of a new generation of critical structural components in aviation, such as wing spars, landing gear beams and fittings, that are increasingly being made entirely from composites. The tests address the need to better understand the damage process for specimens with a small thickness ratio since existing experimental impact data for large thickness ratio (thin laminates) may not be directly applicable. Two energy levels, two different fabric layups and two impact methods (drop-weight and gas-cannon) were used. Data from high-speed cameras were processed in a novel way, providing the force during impact. C-scans and micrographs were used to characterise damage. The results show that specimens with a thickness ratio of 5 (20 mm thick) experience more bending compared to specimens with a ratio 2.5 (40 mm thick). For gas-cannon impacts, this results in a higher delaminated area. The drop-weight impacts show almost no differences in damage size for the thickness range analysed. The influence of layup on the global impact response is negligible, but locally it can result in significant variations in dent depth. The dent depth scales linearly with the impact energy and the delaminated area linearly with the impact velocity. There is no clear correlation between the compression-after-impact failure mechanisms and the residual strength. Impact damage, at the current energy levels, showed a minimal reduction of residual strength.
Introduction
The use of composite materials in the aviation sector, especially Carbon Fibre Reinforced Polymers (CFRP), has increased significantly over the last decades and it is estimated that the corresponding weight savings have contributed to a 20% reduction of CO2 emissions. 1 The high specific mechanical properties of CFRP materials are the main contributors to the weight savings. However, composite materials in the current generation aircraft, such as the Airbus A350 and Boeing 787, have been limited to thin-walled structures, whereas highly loaded components are still often manufactured with metals, resulting in heavy designs. Consequently, further weight reduction needs to target these components and, correspondingly, thick laminates (e.g. 20–100 mm) are being increasingly applied in aerospace structures subjected to high loads, such as wing root sections, landing gear components and lugs. 2 The challenge for composite materials is that due to their low damage tolerance, and related uncertainties, a large safety factor may be required, which diminishes the theoretical advantages. In particular, risks associated to accidental impact events are critical and require extensive characterisation.
Impact damage tolerance in composite structures is a very active research topic. The research of the past few decades has led to a better understanding of the impact damage mechanisms and effect of relevant parameters such as geometry, layup and material properties as well as energies, velocities and masses used in the tests. Especially the work of Dost et al. 3 shows excellent damage classification, effect of several layups, and the effect on Compression-After-Impact (CAI) strength. While the majority of the research is focussed on thin laminates, it is clear from multiple review articles that the failure mode is highly dependent on the laminate thickness. 4 For example, Cantwell and Morton 5 mentioned that for increasing specimen thickness, low-velocity impact damage transitions from the lower surface to the upper surface due to the stiffer target. At this transition point, the damage threshold energy is at its maximum. Abrate 6 verified this observation and added that the same applies to high-velocity impacts, albeit with a higher damage threshold energy. In addition, Abrate 6 concluded that damage in stiffer targets is initiated by contact stresses and that for intermediate velocities bending induced damage appears. This translates to a lower delaminated area for thicker specimens that have a low thickness ratio (i.e. the ratio between the in-plane dimensions and the thickness).
It is commonly known that a carbon/epoxy material, such as the one considered in this present work, shows brittle fracture behaviour. Agrawal et al. 7 acknowledged that brittle materials have a low energy absorption capability, which indicates a low impact resistance. Improvements are observed when using a fabric architecture instead of an Uni-Directional (UD) composite laminate. Shah et al. 8 mentioned that woven fabrics show an increased impact resistance, as well as, increased CAI damage tolerance. Andrew et al. 4 noticed that UD composite laminates show no effect of impactor mass at constant impact energy. For woven composites, there appears to be no definite conclusion on the effect of the impactor mass. These findings were established for thin laminates and it is not known if they apply to thick laminates.
Alongside the experimental work, many researchers have been working on ways to predict impact damage. For instance, Esrail et al. 9 developed an efficient analytical model that provided relatively accurate predictions for the observed impact damage by Dost et al. 3 Their predicted stresses proved accurate for thick laminates when compared to the infinite plate solution by Love. 10 However, for thick laminates, the local damage creation near the impact location requires better contact models, for instance, as suggested by Talagani 11 and applied in an impact response model by the current authors. 12 Bouvet et al. 13 developed a numerical method which is capable to accurately predict the impact damage. Notably, their approach includes permanent deformation which is a predominant damage mechanism in thick composite laminates. The absence of modelling permanent deformation by plastic behaviour of the epoxy was given as the main reason for the mismatch in force history predictions during the rebound phase by Singh et al. 14 For a numerical damage tolerance valuation, Caputo et al. 15 performed sequential coupled impact and CAI simulations.
Despite the progress achieved in this area, many challenges remain unresolved, particularly for the case of thick composites, where a complete set of experimental data is absent. Pintado et al. 16 impacted approximately 14 mm thick 63 × 63 mm square specimens (thickness ratio a/h ≈ 4.5) with a low-velocity drop-weight and high-velocity gas-cannon. They evaluated three different material systems and determined the residual strengths in inter-laminar shear and compression. Similarity, but less extensive, Marshall and Bouadi 17 studied the differences and similarities between drop-weight impact on thin and thick 304.8 × 304.8 mm square specimens up to 25.4 mm thick (a/h = 12). Breen et al. 18 impacted up to 12 mm (a/h ≈ 24) thick 290 × 350 mm rectangular specimens with a drop-weight and performed tension and CAI tests. Lee and Liu 19 considered both static indentation and impact tests on 25.4 mm thick 100 × 300 mm (a/h ≈ 4) rectangular specimens with a focus on the effect of impact velocity and impact location. In addition to Breen et al., 18 Creemers and Smeets 20 studied specimens with a fabric material. They focused on the static and fatigue behaviour of impacted 20 mm thick 190 × 100 mm (a/h = 5) rectangular specimens, including different types of impactors with a drop-weight and gas-cannon.
Despite the valuable observations and conclusions of the previously mentioned experimental studies, there are still some fundamental issues that require attention in view of further development of thick composite laminate structures. For instance, most studies focus on composites with an UD reinforcement, while fabric reinforcements with toughened resin systems are being more extensively used nowadays for their increased impact damage tolerance. 8 In addition, a complete set of output variables is lacking, such as force and displacement histories during impact and detailed dimensions of the impact damage. Therefore, in the present work, a new testing campaign is carried out with the goal to elucidate the role of the thickness on the failure mechanisms under impact as well as to provide experimental data for the validation of numerical impact damage models applicable to thick composite structures.
The work is organised as follows: The Experimental methodology section provides the details of the experimental methodology used for large-mass low-velocity drop-weight impacts, performed in line with the ASTM D7136 standard, 21 as well as small-mass high-velocity gas-cannon impacts. The impact tests relate to specific events that may occur during operation such as a large-mass, low-velocity impact test representing a tool drop and a small-mass, high-velocity impact representing runway debris. Selecting this test method and apparatus allows direct comparison of results between thick and thin laminates. The Results and discussion section contains the results of impact tests conducted at two energy levels and performed on fabric CFRP 150 × 100 mm specimens with a 20 and 40 mm thickness (i.e. down to a thickness ratio a/h = 2.5) and varying layup. This section also includes a detailed damage inspection that was performed to quantify the resulting impact damage. Results from CAI experiments, which were used to determine the compressive residual strength, are also reported in this section. Finally, the main findings are summarised in the Summary and conclusions section.
Experimental methodology
Thick composite specimens were manufactured for low-velocity drop-weight impacts and high-velocity gas-cannon impacts. After the impact tests, each specimen was inspected with several techniques to quantify the impact damage. The specimens that were only inspected with Non-Destructive Inspection (NDI), were subsequently subjected to CAI experiments. Details of the experimental methodology, including the materials used, are as follows:
Materials and specimen preparation
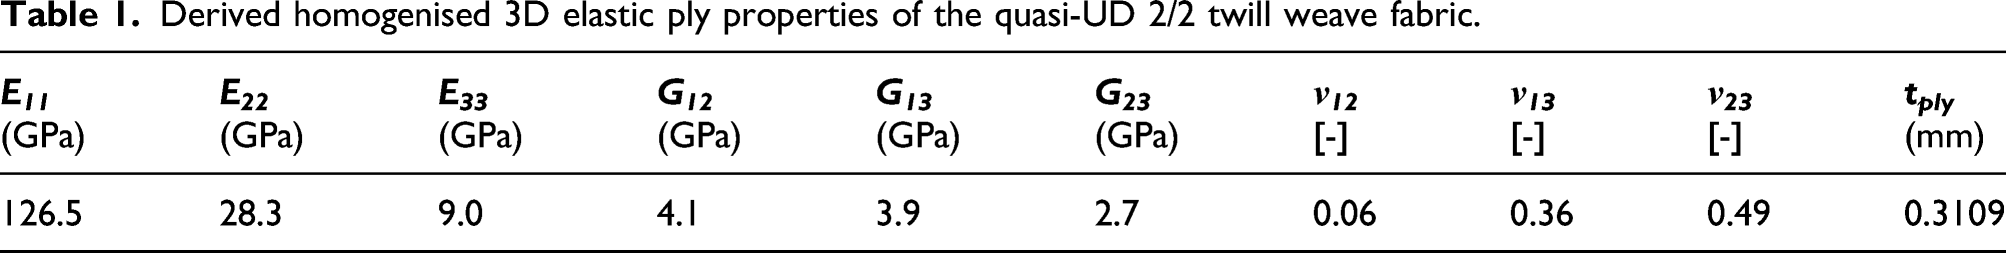
Derived homogenised 3D elastic ply properties of the quasi-UD 2/2 twill weave fabric.
The fabric plies are cut using an automated cutting machine and subsequently preformed into sub-laminates each with 16 plies. Several sub-laminates amount to the full laminate, which is infused and cured with a Resin Transfer Moulding (RTM) process.
The specimens were manufactured out of five plates of approximately 600 × 360 mm. Of these, four plates have a Quasi-Isotropic (QI) [−45/0/45/90] ns layup and one plate an OrthoTropic (OT) [[−45/0/45/902/-45/45/902]3/−45/45/902/0 s layup. The QI layout has an equal distribution of fibres in each direction, whereas the OT layup has 17% of fibres in the 0° direction (i.e. long dimension of the plate), 44% in ±45°, and 39% in ±90°. The bending stiffness D11 of the OT laminate is 20% lower than that of the QI laminate. Due to the moulds used in the RTM process, the resulting plate thicknesses are 19.9 mm (i.e. n = 8 or 64 plies) and 39.4 mm (i.e. n = 16 or 128 plies), with a nominal cured ply thickness of 0.311 and 0.308 mm, respectively. This results in a slight difference in fibre volume fraction and laminate density. These values, including the void content, have been experimentally obtained using ASTM D792 and D3171. For the 19.9 mm plates, the fibre volume fraction is 59.7% and the laminate density is 1555 kg/m3. For the 39.4 mm plates, the fibre volume fraction is 60.3% and the laminate density is 1561 kg/m3. These differences result in a slight variation in ply properties. However, these differences are below the accuracy of the data given in Table 1. The average void content is 0.5%.
Using a diamond saw, 11 rectangular 150×100 mm specimens were obtained from each plate. For the compression tests, a perpendicular tolerance of 0.02° is required on the short edges. Four specimens per test instance could be obtained from the five plates. The specimens for the static compressive strength experiments in the Compression-after-impact tests section (i.e. undamaged specimens) are machined to a dog-bone shape, as illustrated in Figure 1, to ensure a valid failure mechanism as indicated in the ASTM D7136 standard.
21
A white paint is applied to increase the visibility in the case high-speed cameras are used. The dog-bone shape used for static compression tests of undamaged specimens.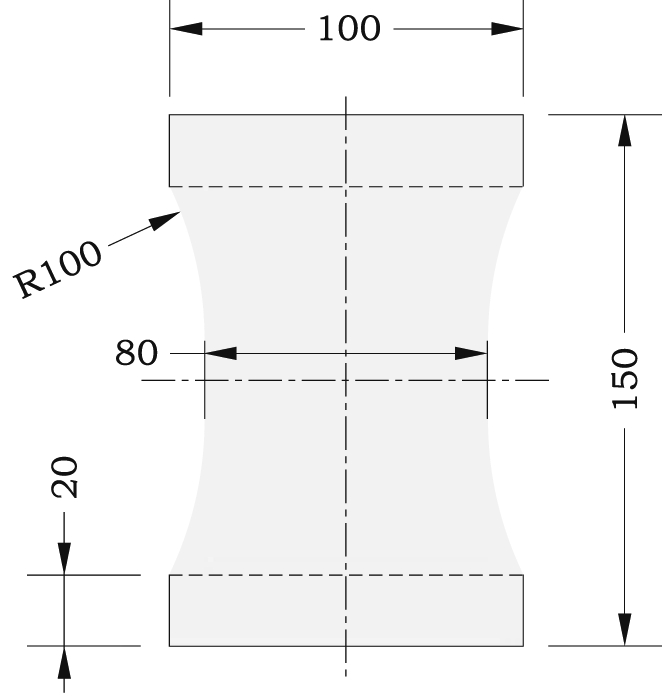
Low-velocity drop-weight impact tests
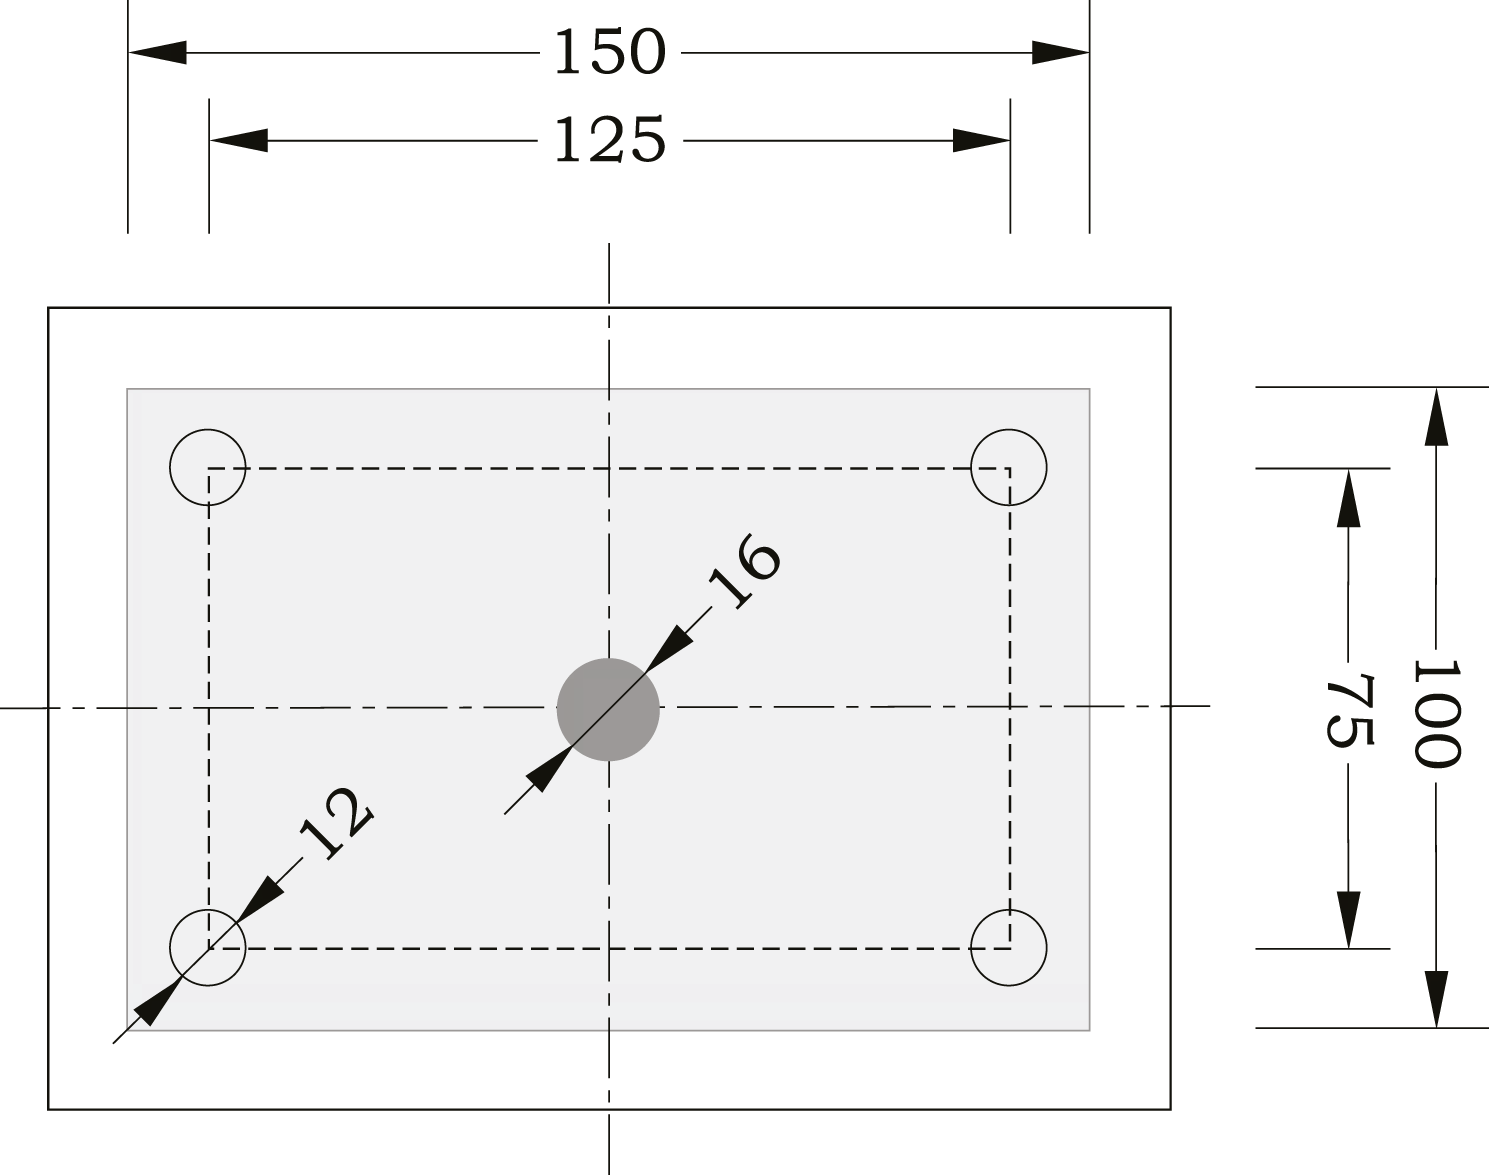
An instrumented drop-weight designed at Royal NLR was used for low-velocity impact tests, as shown in Figure 2. The 2274 g drop-weight has a steel spherical head with a 16 mm diameter and is guided by two steel rails. Using a magnet release the drop-weight is dropped from a height corresponding to the required impact energy, which is validated by measuring the actual drop-weight velocity before and after impact. The target specimen is clamped on a steel frame at the four edges of a 125 × 75 mm opening (Figure 3). In all cases, the rebound distance of the drop-weight was sufficient to manually prevent multiple impacts. A load cell, calibrated up to 80 kN and positioned between the head and the drop-weight, measures the contact force with a 250 kHz sampling frequency. Illustration of the drop-weight setup used for large-mass impacts. Top-view of the support fixture used for the drop-weight and gas-cannon tests.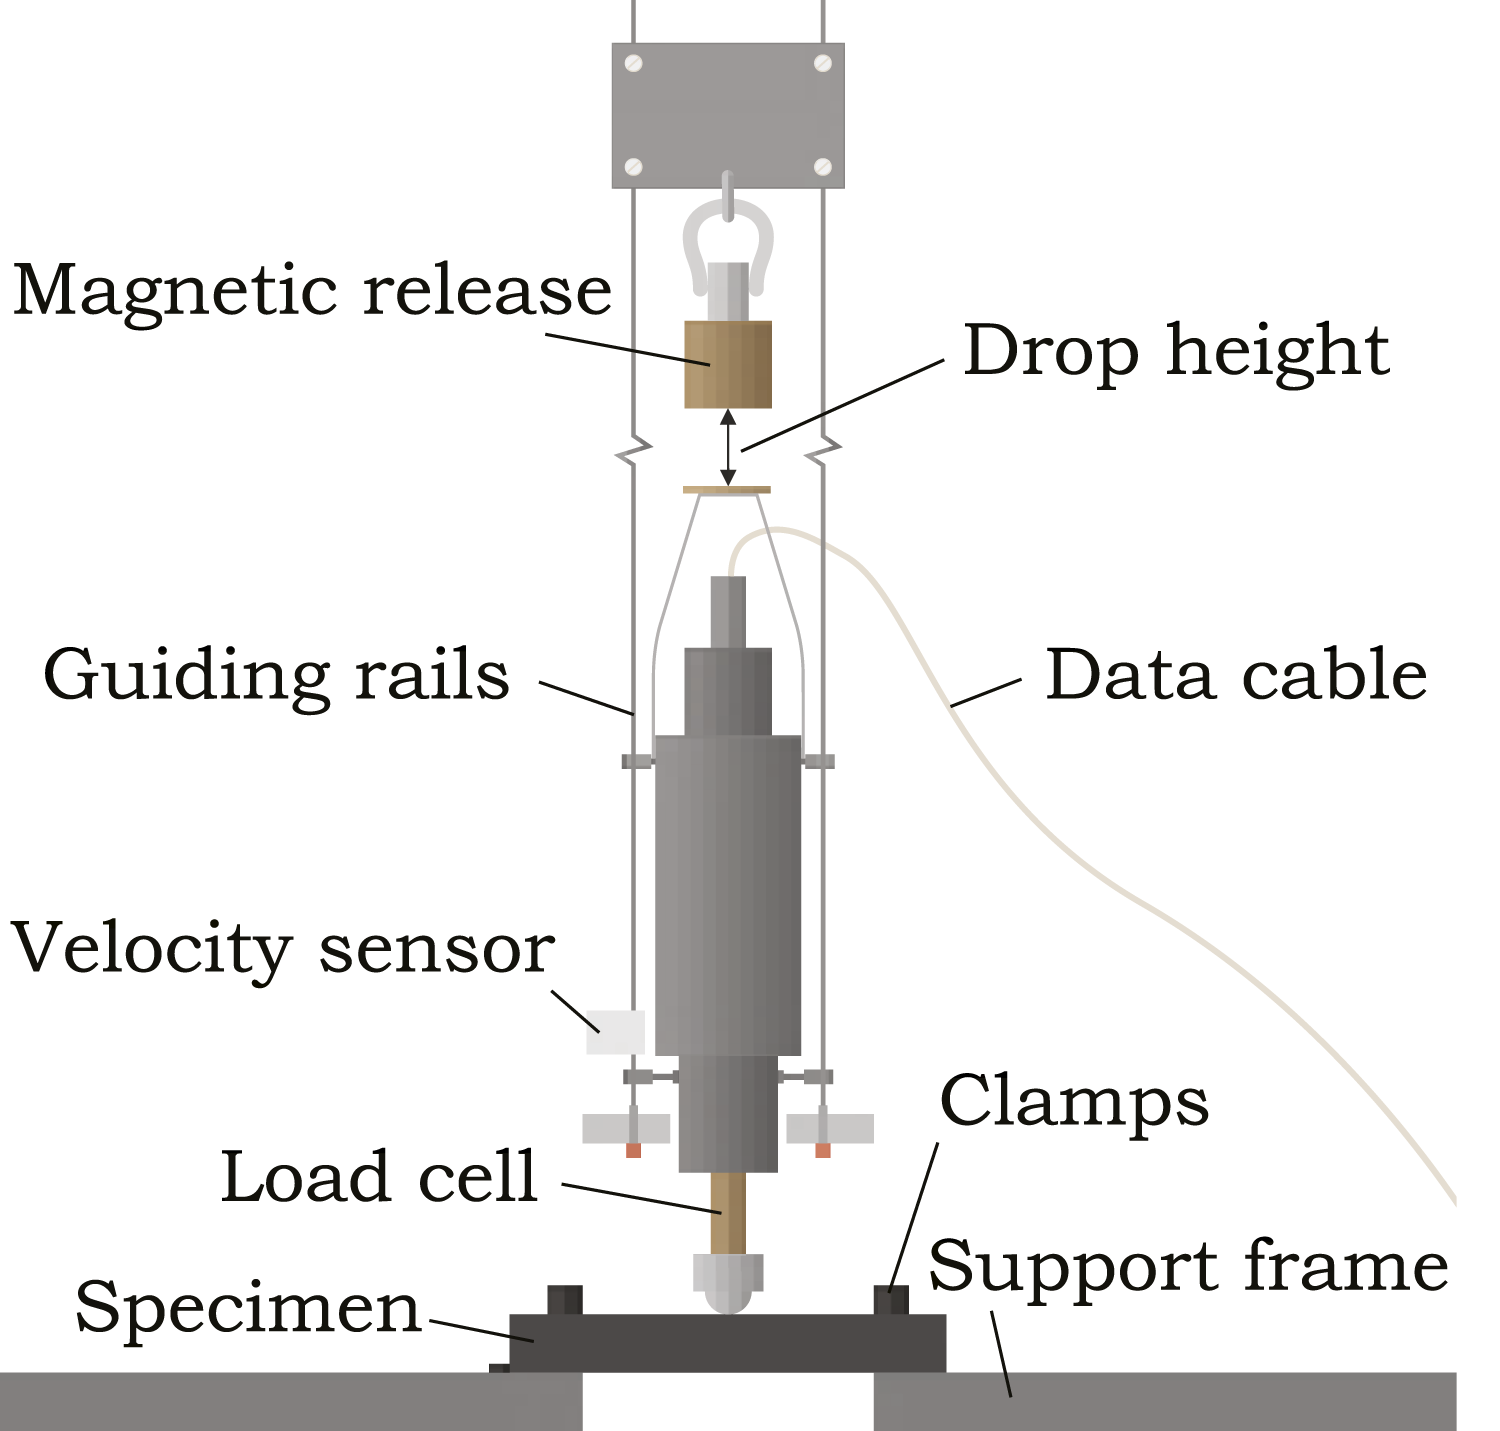
In a few cases, post-processing of the measured contact force was required. Due to the high impact loads (above 60 kN), and associated dynamic vibrations of the connector cable, corrupt data points were reported. These data points were identified as outliers and directly removed. For the purpose of the foregoing explanation, it is worth mentioning that resulting gaps were interpolated and smoothed. In most of the cases, only a few corrupt data points occurred, resulting in small gaps that were interpolated. In the few cases in which many data points were corrupt, the interpolated results were still in line with measurements from specimens with the same test conditions.
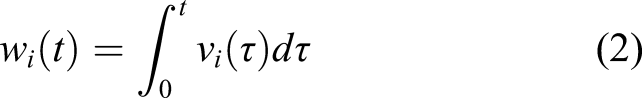
Using the contact force history, F(t), the impactor velocity history v
i
(t) and impactor displacement history w
i
(t) can be determined,
21
that is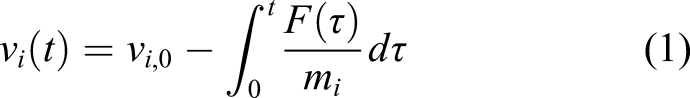
The energy transferred to the specimen, which can be inferred from the change of kinetic energy of the impactor, can be expressed as a percentage of the initial kinetic energy of the impactor, that is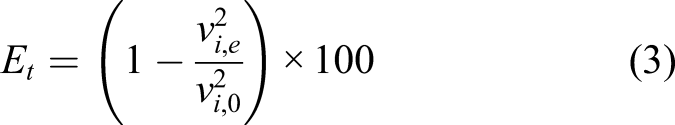
In addition to the outputs that can be calculated directly from the experimental measurements, estimations can be made based on alternative models. For instance, the impactor indentation history, δ(t), and plate deflection history, w
p
(t), can be estimated by assuming a contact law. Talagani
11
proposed a contact law for thick composites that has been implemented in an analytical impact response model in an earlier work.
12
An example of a drop-weight force history, including an approximation of the analytical impact response model, is given in Figure 4. Averaged force history for 55 J drop-weight impact tests on 20 mm thick specimens.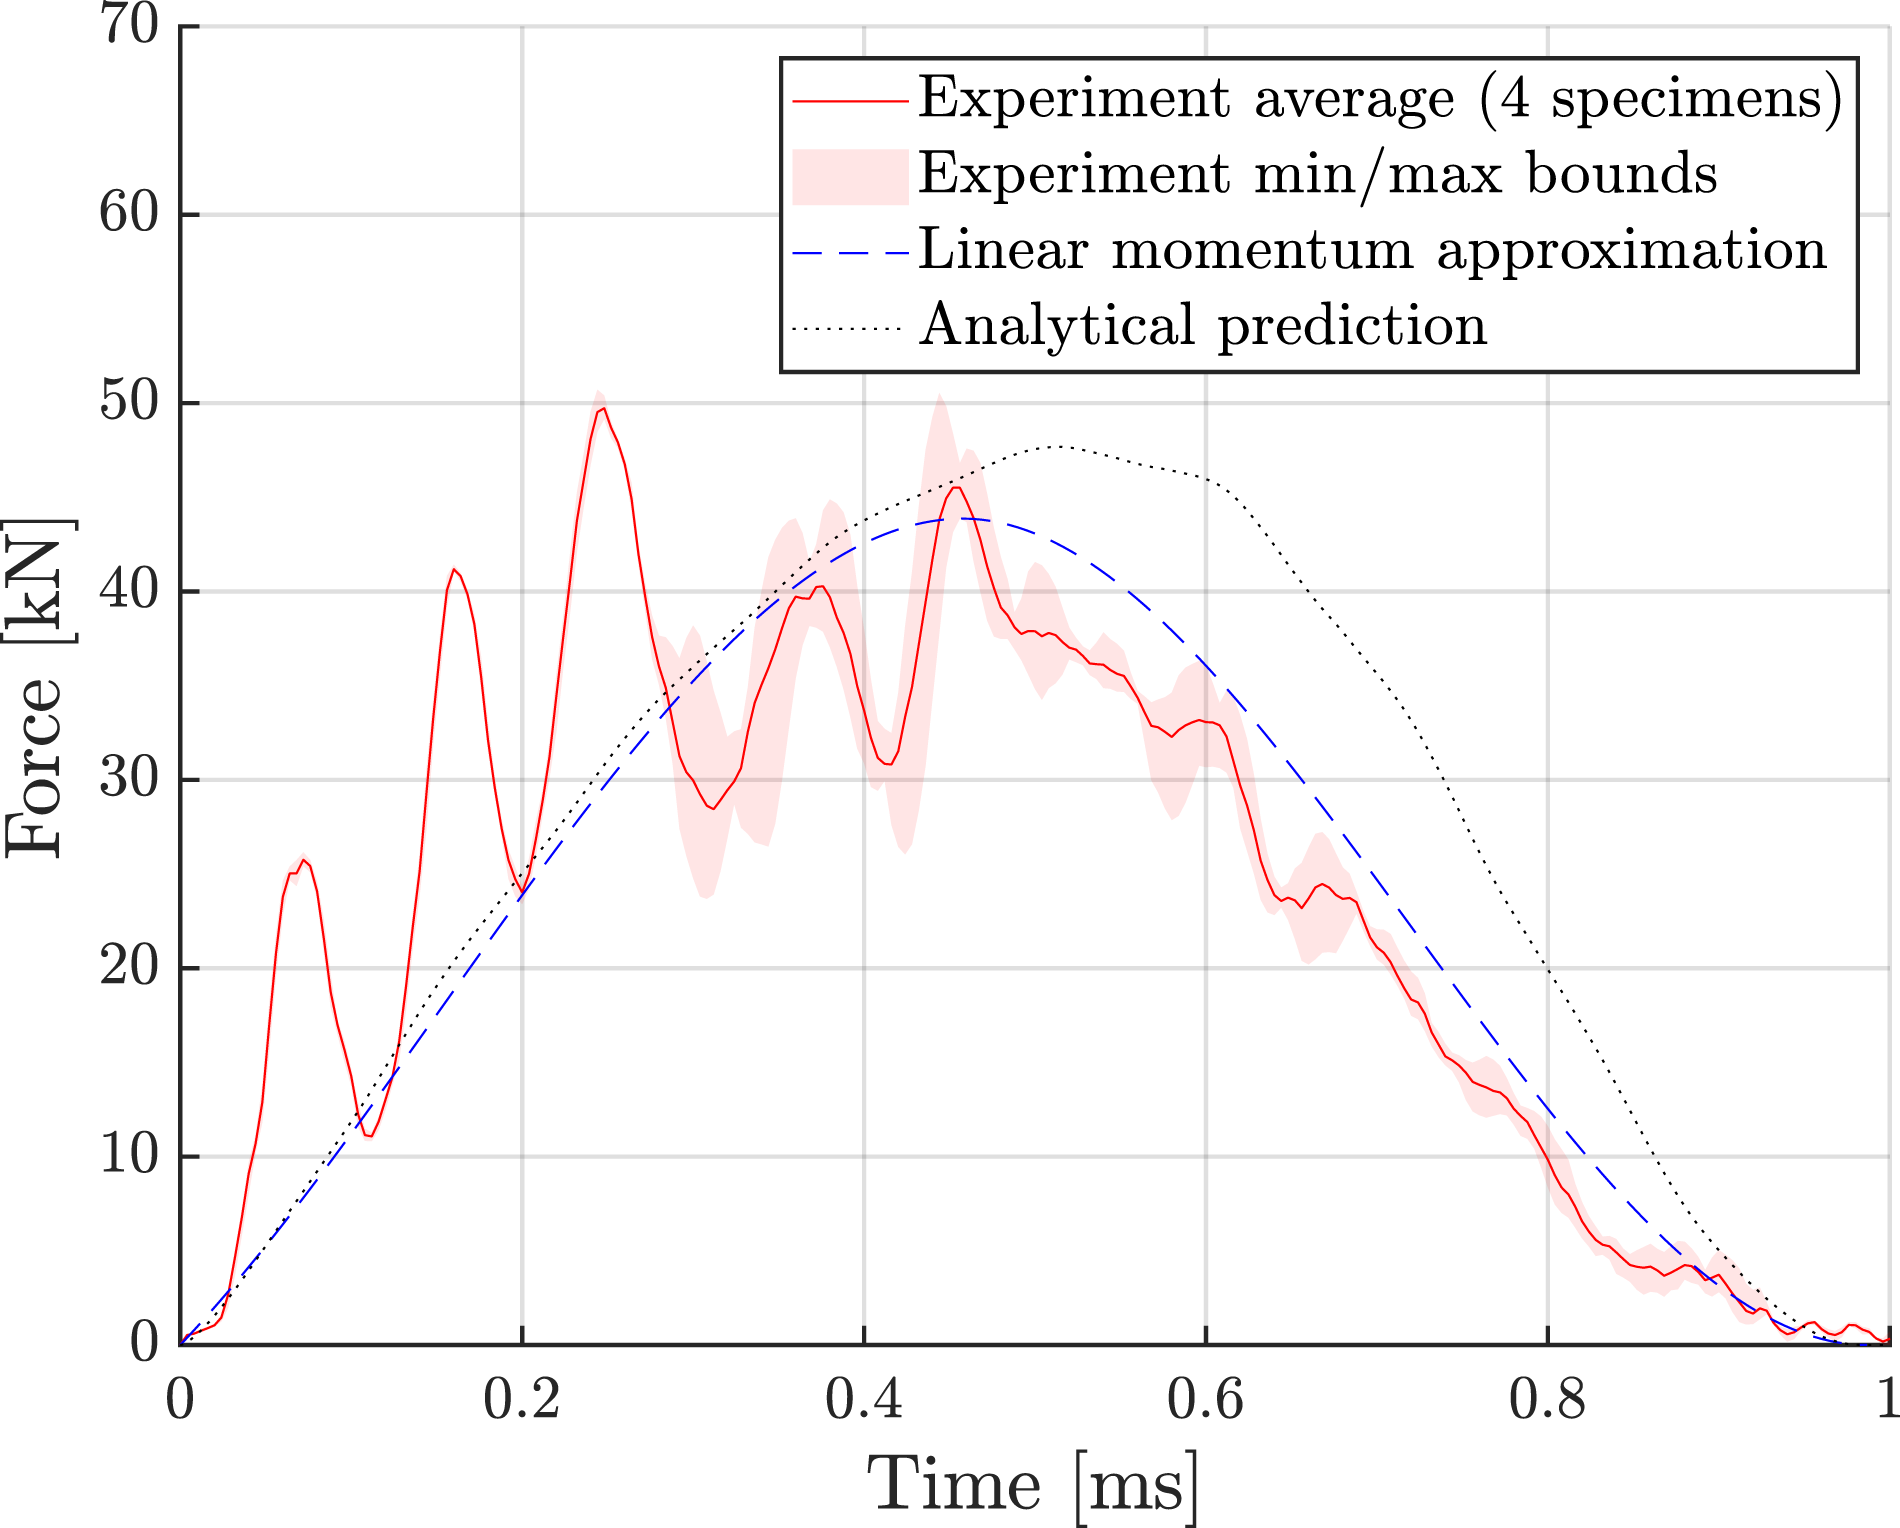
The ASTM D7136 standard recommends an impact energy of 6.7 J/mm meant to represent energy levels in the vicinity of that causing Barely Visible Impact Damage (BVID). This recommendation is originally intended for thin laminates and applying this recommendation to the 20 mm and 40 mm thick specimens results in unrealistic impact energies (i.e. 134–268 J) not expected in service. Moreover, it is expected that BVID occurs at lower energy levels. To corroborate this, several drop-weight impact tests were performed to determine the relation between impact energy and dent depth (e.g. permanent indentation δ0). From the results in Figure 5, a maximum impact energy of 100 J was chosen (i.e. the limit of the gas-cannon) and, in addition, an impact energy at the point where BVID is expected to occur (i.e. 55 J). For the drop-weight impacts, these impact energies correspond to approximately 6.96 and 9.38 m/s for a 2274 g impact mass. Energy level determination including the dent depths of 55 and 100 J drop-weight impact tests on 20 mm thick QI specimens.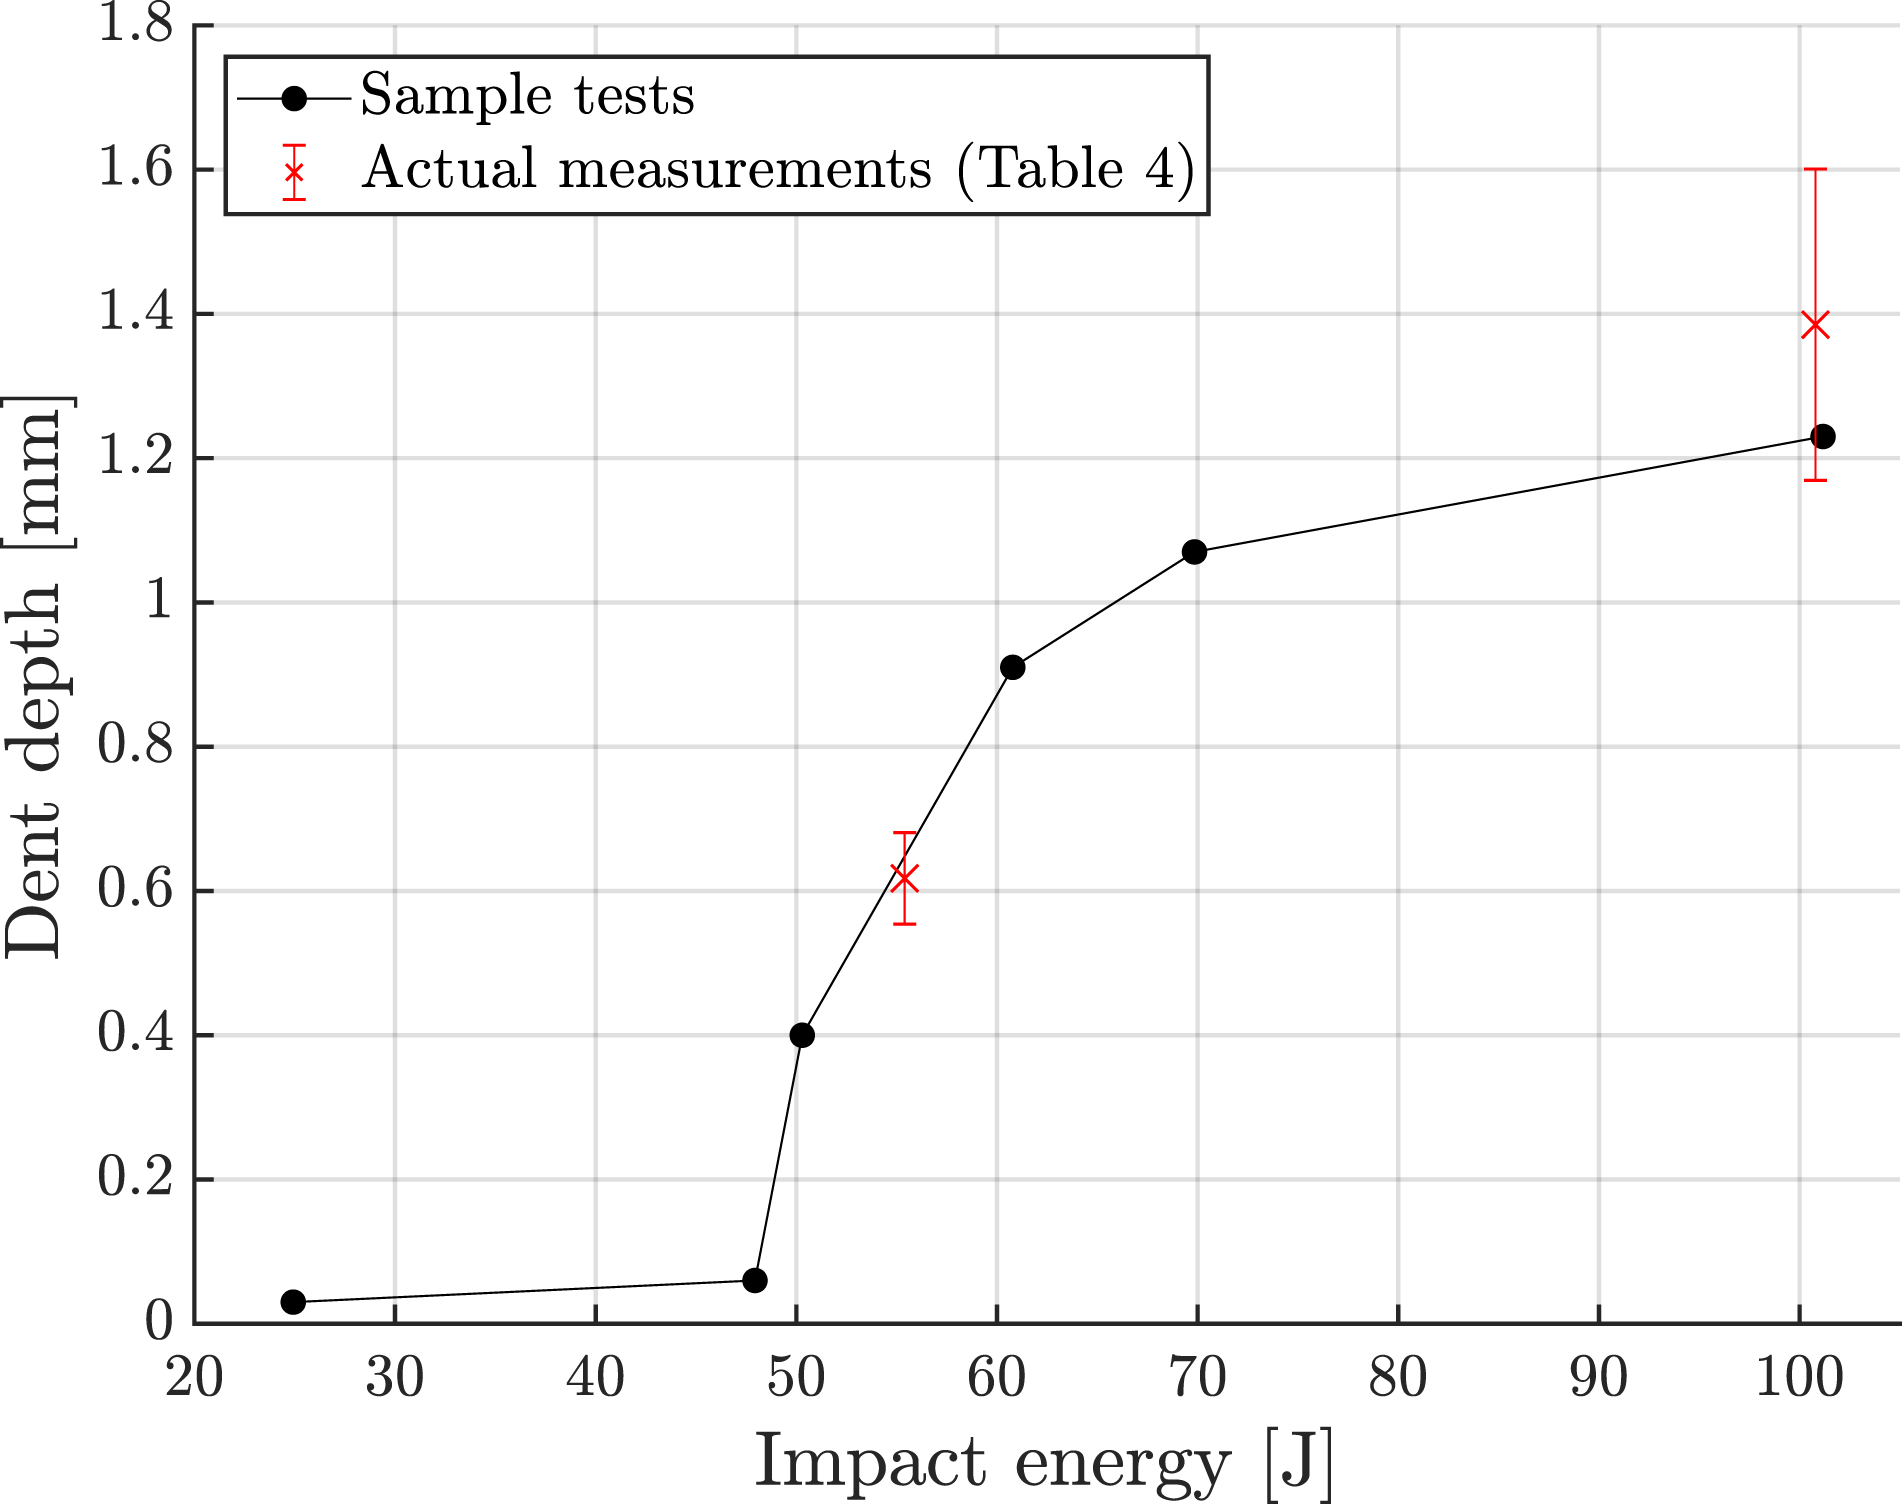
High-velocity gas-cannon impact tests
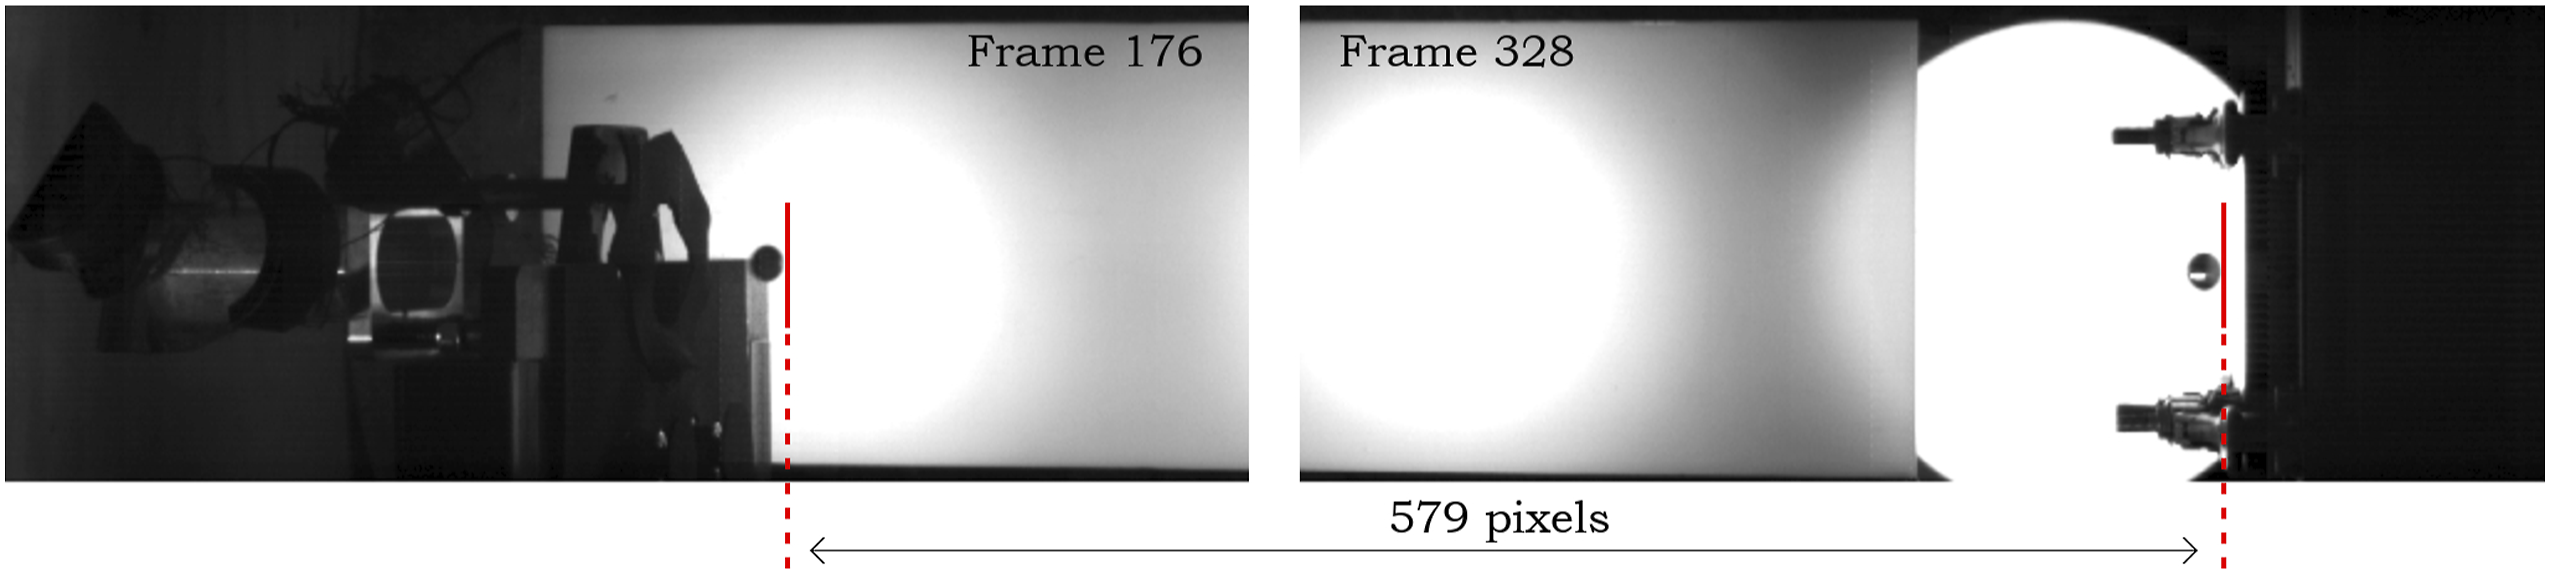
For the high-velocity impact tests, a gas-cannon designed at Royal NLR is used, as shown in Figure 6. This gas-cannon was originally designed for hail impact and modified for a 16 mm steel ball with a mass of 16.72 g, which resulted in a maximum impact energy of 100 J previously indicated. The 55 and 100 J impact energies translate to an impact velocity of 81.11 and 109.37 m/s. To match the diameter of the gas-cannon barrel, the steel ball is positioned in a 3D printed sabot that consists of two halves. By puncture of a plastic membrane, the pressurised gas is released and the sabot, including steel ball, travels through a 1 m long barrel. At the end of this barrel, it enters an approximately 2 × 2× 2 m chamber, illustrated in the high-speed images in Figure 7, on the left side. Immediately the sabot is split in half and blocked by a divider, and the steel ball crosses the chamber alone before impacting the specimen. The support fixture used for the drop-weight impact experiments is mounted vertically to feature identical boundary conditions. Two high-speed cameras and required lighting equipment are situated in the chamber and one wall is made of protective glass to observe the experiment. Illustration of the gas-cannon test setup used for small-mass impacts. Illustration of the impact velocity determination of a gas-cannon impact on specimen 20-QI-SM-55-1. The impactor is detected at frames 176 and 328, which results in a elapsed time of 7.6 ms over a distance of 579 pixels. Knowing that 1 pixel equals 1.035 mm the resulting impact velocity is 78.87 m/s.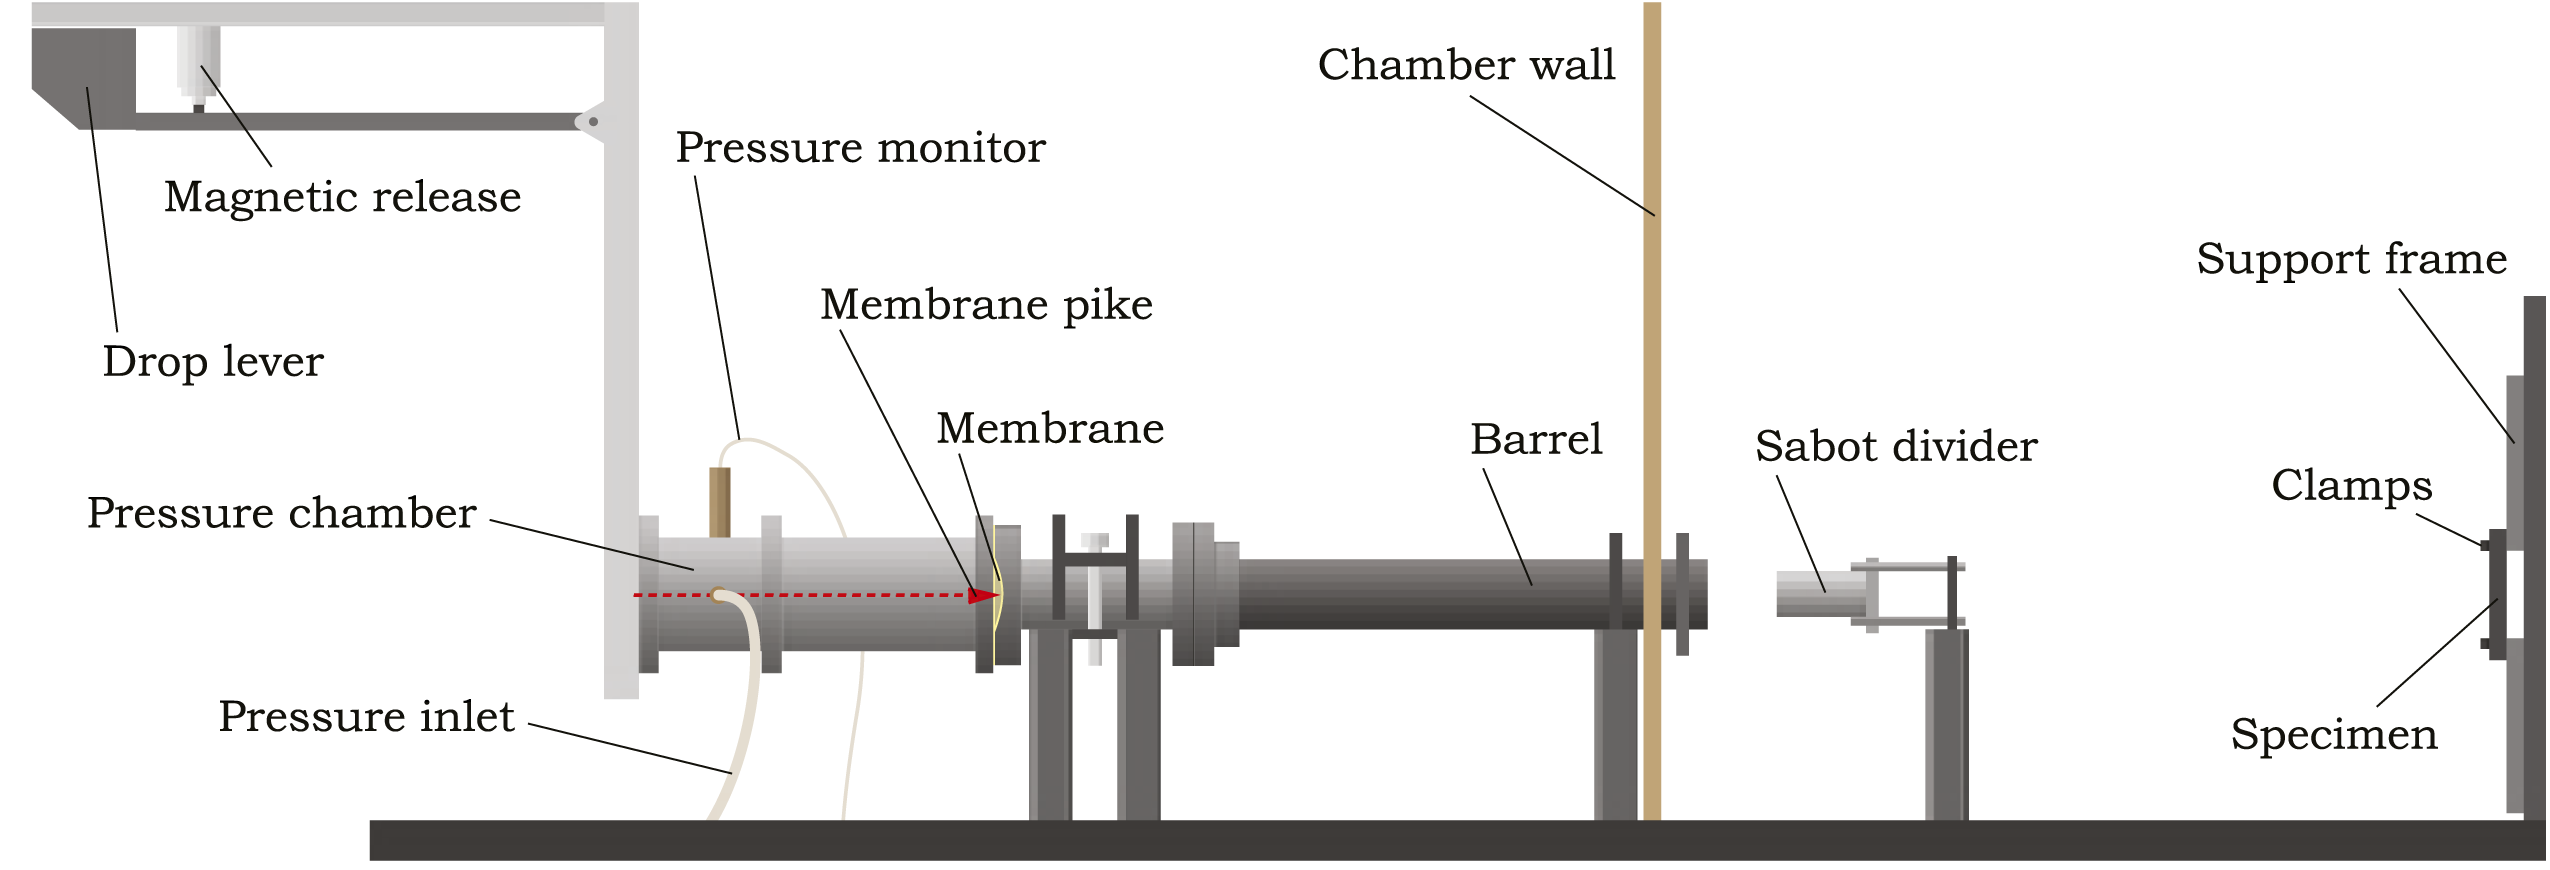
To ensure consistent pressurisation, and thus, consistent impact velocities, the following procedure is applied: a timer is started at the instant the pressure is increased and after exactly 40 s the membrane is punctured, which is taken as exact within the tolerance of the timer. Due to plastic deformation of the membrane, this time frame is required to converge to the intended pressure. A pressure valve ensures the intended pressure is reached. This pressure requires calibration because it directly influences the impactor velocity. After calibration a pressure of 4.5 and 8.2 bar was found for the aimed 55 and 100 J impacts, respectively. This approach resulted in, respectively, consistent impacts of 54.03 J (σ = 0.96 J, CV = 1.78%) and 97.61 J (σ = 1.39 J, CV = 1.42%). In parallel to the impact velocity calibration, the gas-cannon was aimed to ensure impact at the centre of the specimen.
A particularly challenging aspect of gas-cannon impact tests is obtaining relevant outputs, such as impactor displacement and contact force. Instrumentation of the impactor is not possible, in contrast to the drop-weight experiments. Therefore, a novel approach is used by utilising two high-speed cameras. One high-speed camera at 20,000 fps captures an overview of the impactor, see Figure 7. From these images the impactor velocity can be determined accurately to within the length and time scales of pixels and frames. First, the dimensions of one pixel in the plane of motion are determined by measuring the distance between two known points. This dimension is verified by measuring the impactor radius. A script detects the impactor at two positions, after it leaves the sabot and before it hits the specimen. The impactor velocity, vi,0, is calculated from the distance covered and elapsed time. It is assumed that over the covered distance the velocity is constant.
The second high-speed camera is aimed at the impact location and records at 150,000 fps (i.e. 15 frames in a 0.1 ms impact). Despite the low resolution of 192 × 184 pixels it is possible to track the impactor during impact with the required accuracy. A Tracking the impactor during a gas-cannon impact on specimen 20-QI-SM-55-1.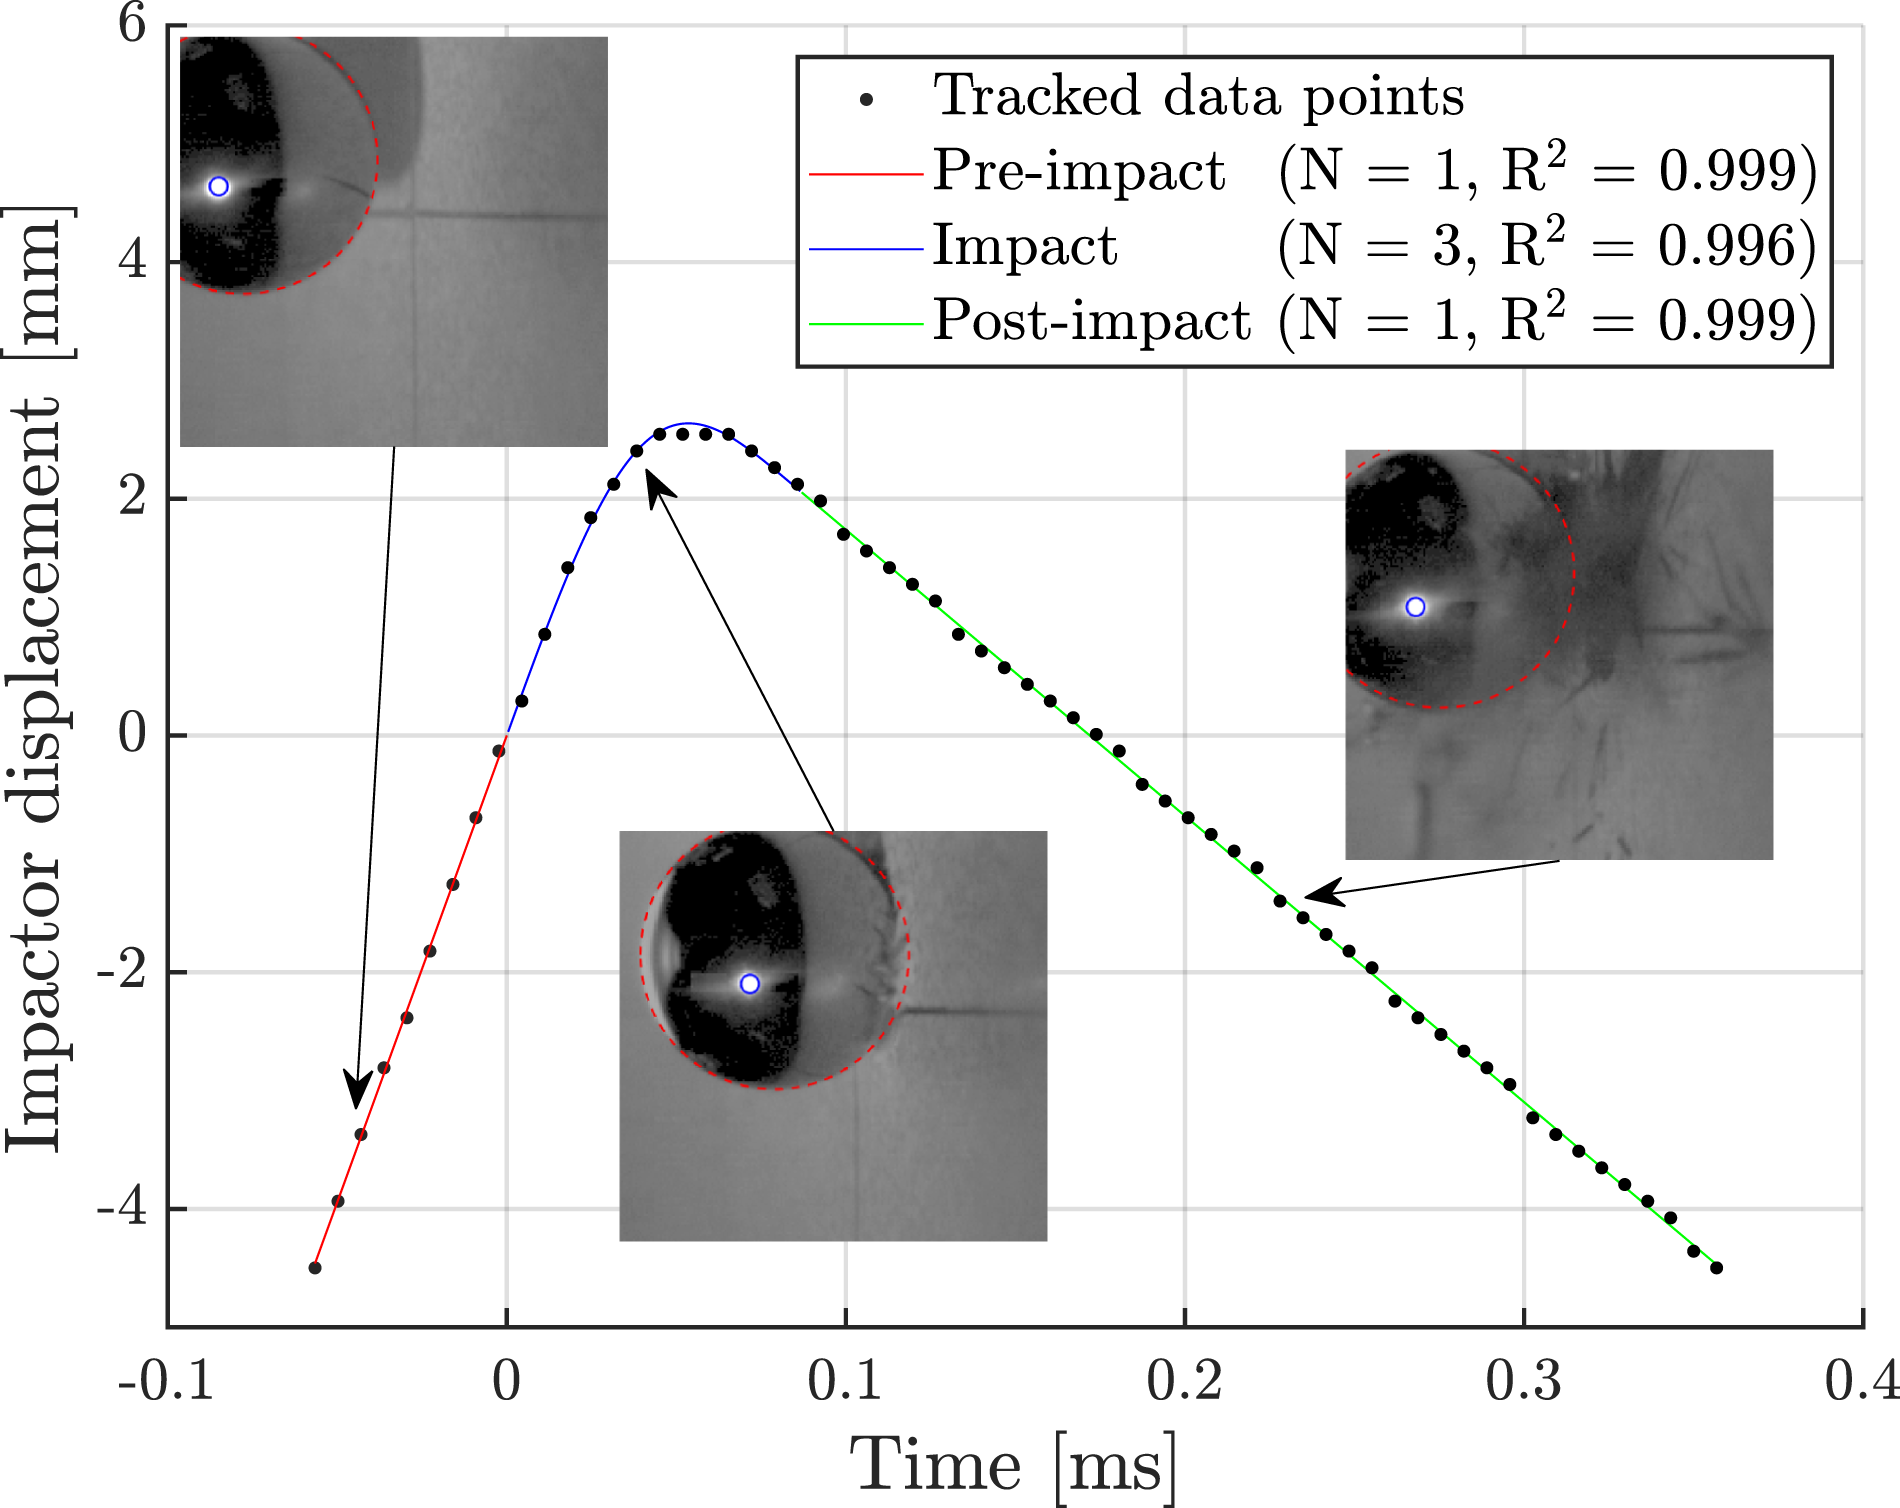
From Figure 8, it can be concluded that the impactor displacement can be tracked very accurately. The values of the tracked data points in terms of pixels are translated to length measured in mm by using the fact that the slope of the pre-impact region should be equal to the initial velocity measured from Figure 7. In addition, three regions are defined: pre-impact (red), impact (blue) and post-impact (green). During impact the tracked data points can be fitted using a cubic polynomial. Similar to the pre-impact region, the post-impact region can be fitted using a linear expression of which the slope represents the exit velocity.
Using the data from the two high-speed cameras, the impactor initial and exit velocity can be estimated accurately. Attempts were made to obtain the impactor velocity and acceleration (i.e. contact force) by differentiation of the fitted displacement. However, the resolution of the data is not high enough and the exact definition of the start and end point showed a high sensitivity on the derived force response. Instead, an alternative method was used: firstly, the change in linear momentum of the impactor can be computed as Estimated contact force and impactor velocity history of specimen 20-QI-SM-55-1.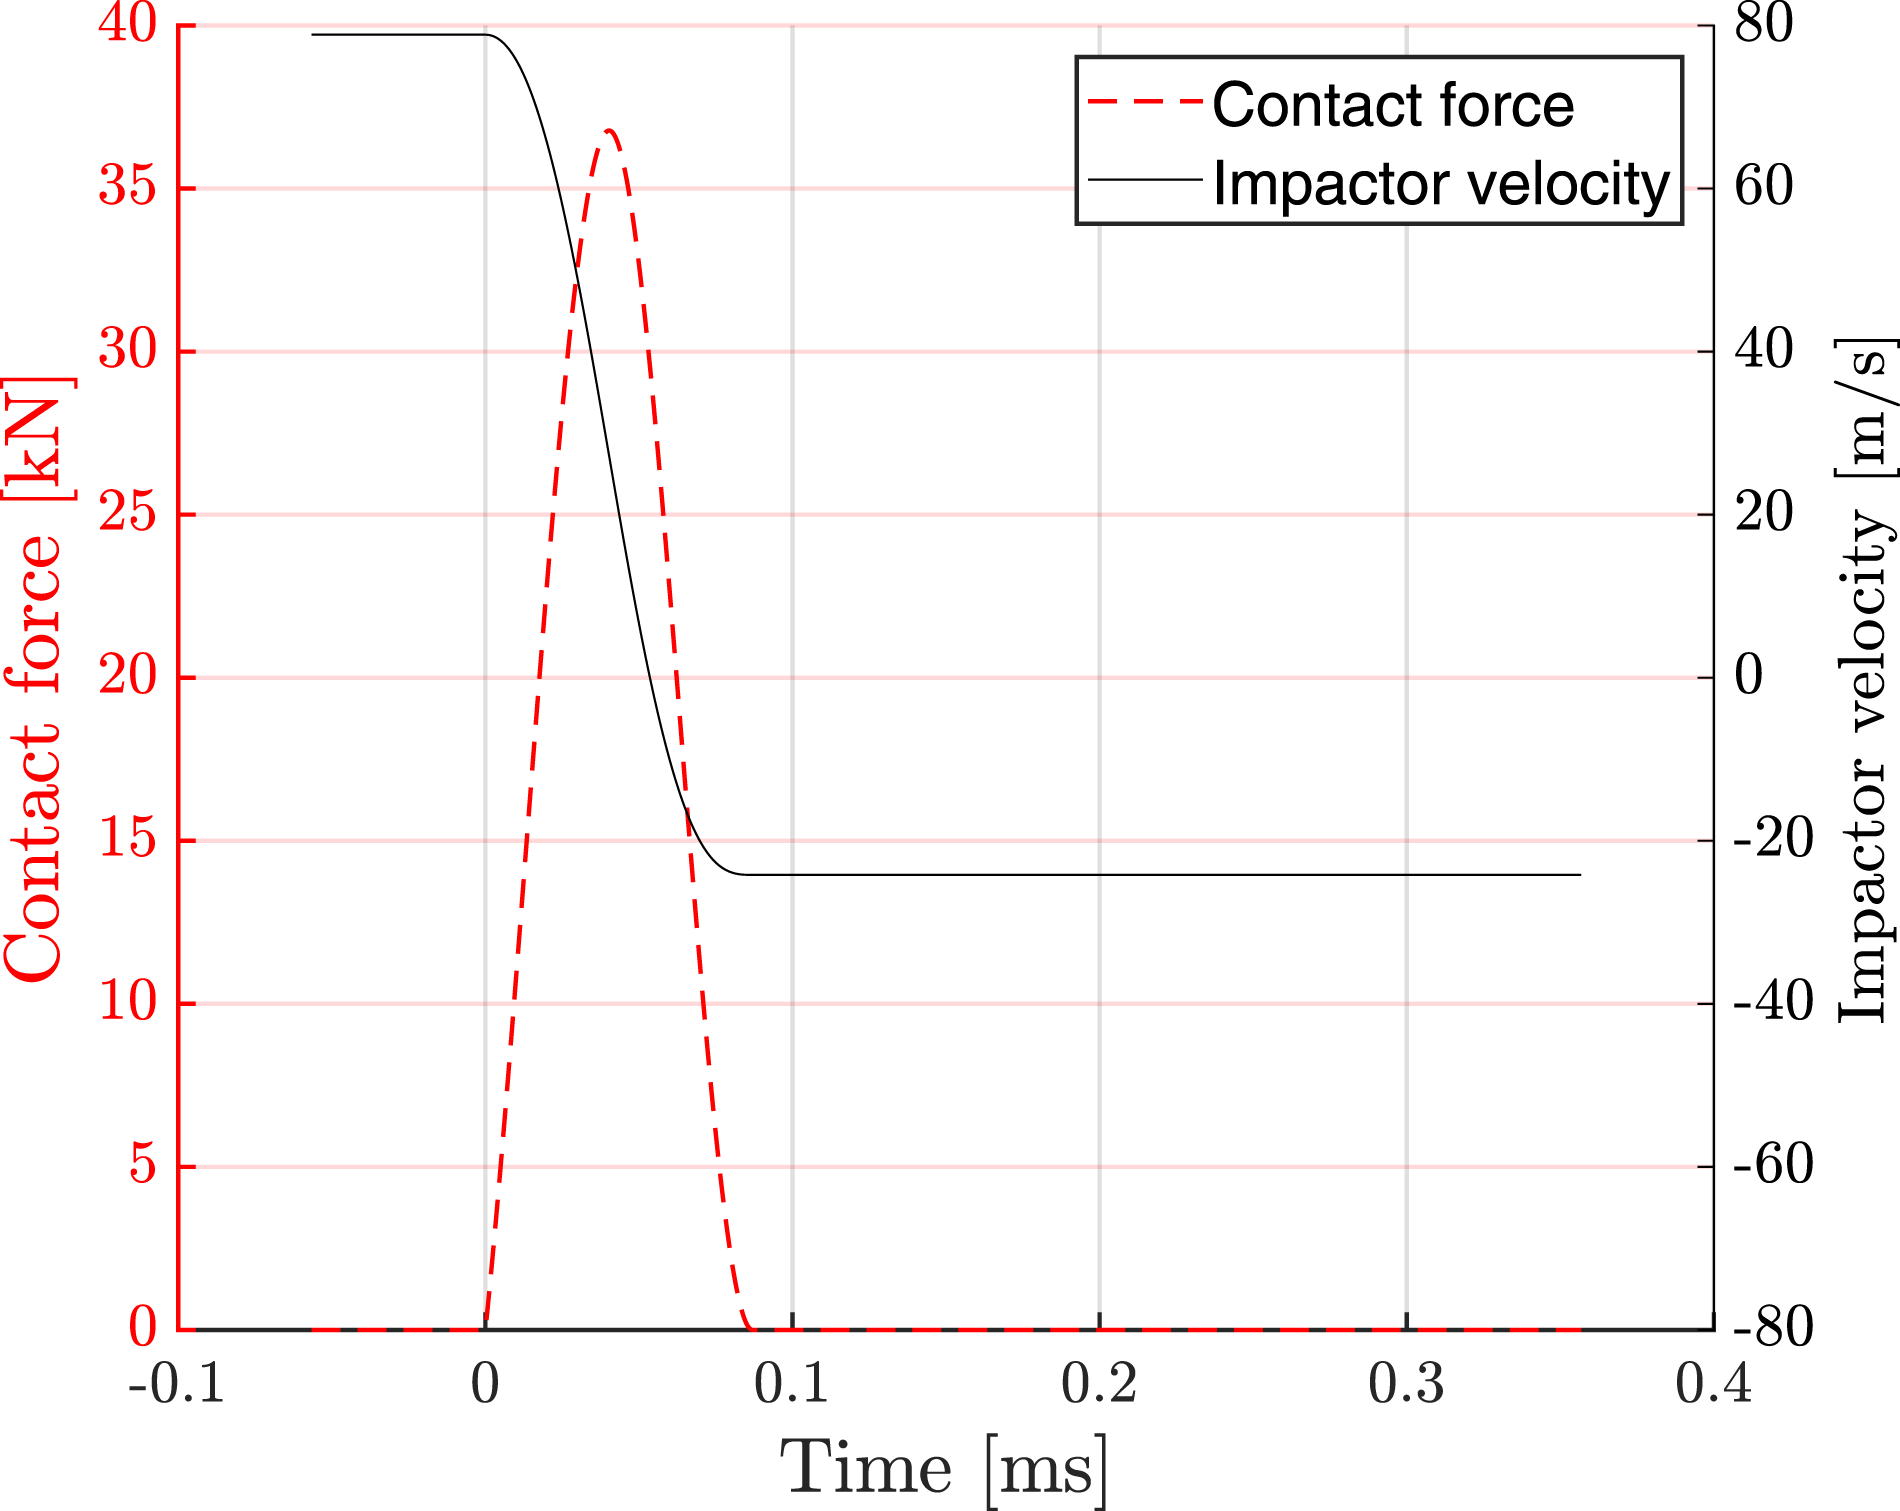
The impactor velocity history is determined by integrating the impactor acceleration, as shown in Figure 9. Further integration of the impactor velocity history provides an alternative method to determine the impactor displacement history for the gas-cannon tests compared to the method used for the drop-weight tests. The start point with zero displacement at 0 ms in Figure 8 can be established by fitting the original tracked data points with the impactor displacement history. The estimated indentation history, estimated plate deflection history and transferred energy for the gas-cannon impact case are obtained using the same procedure as for the drop-weight impact tests presented in the Low-velocity drop-weight impact tests section.
Non-destructive and destructive impact damage inspection
Directly after the impact experiments, dent depth measurements were performed using a dial depth gage with three reference points. Seven days after impact, the dent depth was measured again to determine its relaxation. It was concluded that no relaxation occurred as the differences were within errors of the measurement methodology. The dents above 48 J in Figure 4 were measured three times in total, in intervals of several months, by the same person. The discrete standard deviation of these measurements is 0.04 mm on average. The dent measurements directly after impact and after 7 days show differences within this standard deviation. Despite the use of a toughened resin, an explanation for the absence of relaxation is that the material near the impact location behaves in a brittle way, as shown in Figure 10. Typical dents for 55 J drop-weight impacts and gas-cannon impacts on 20 mm thick specimens with a QI and OT layup.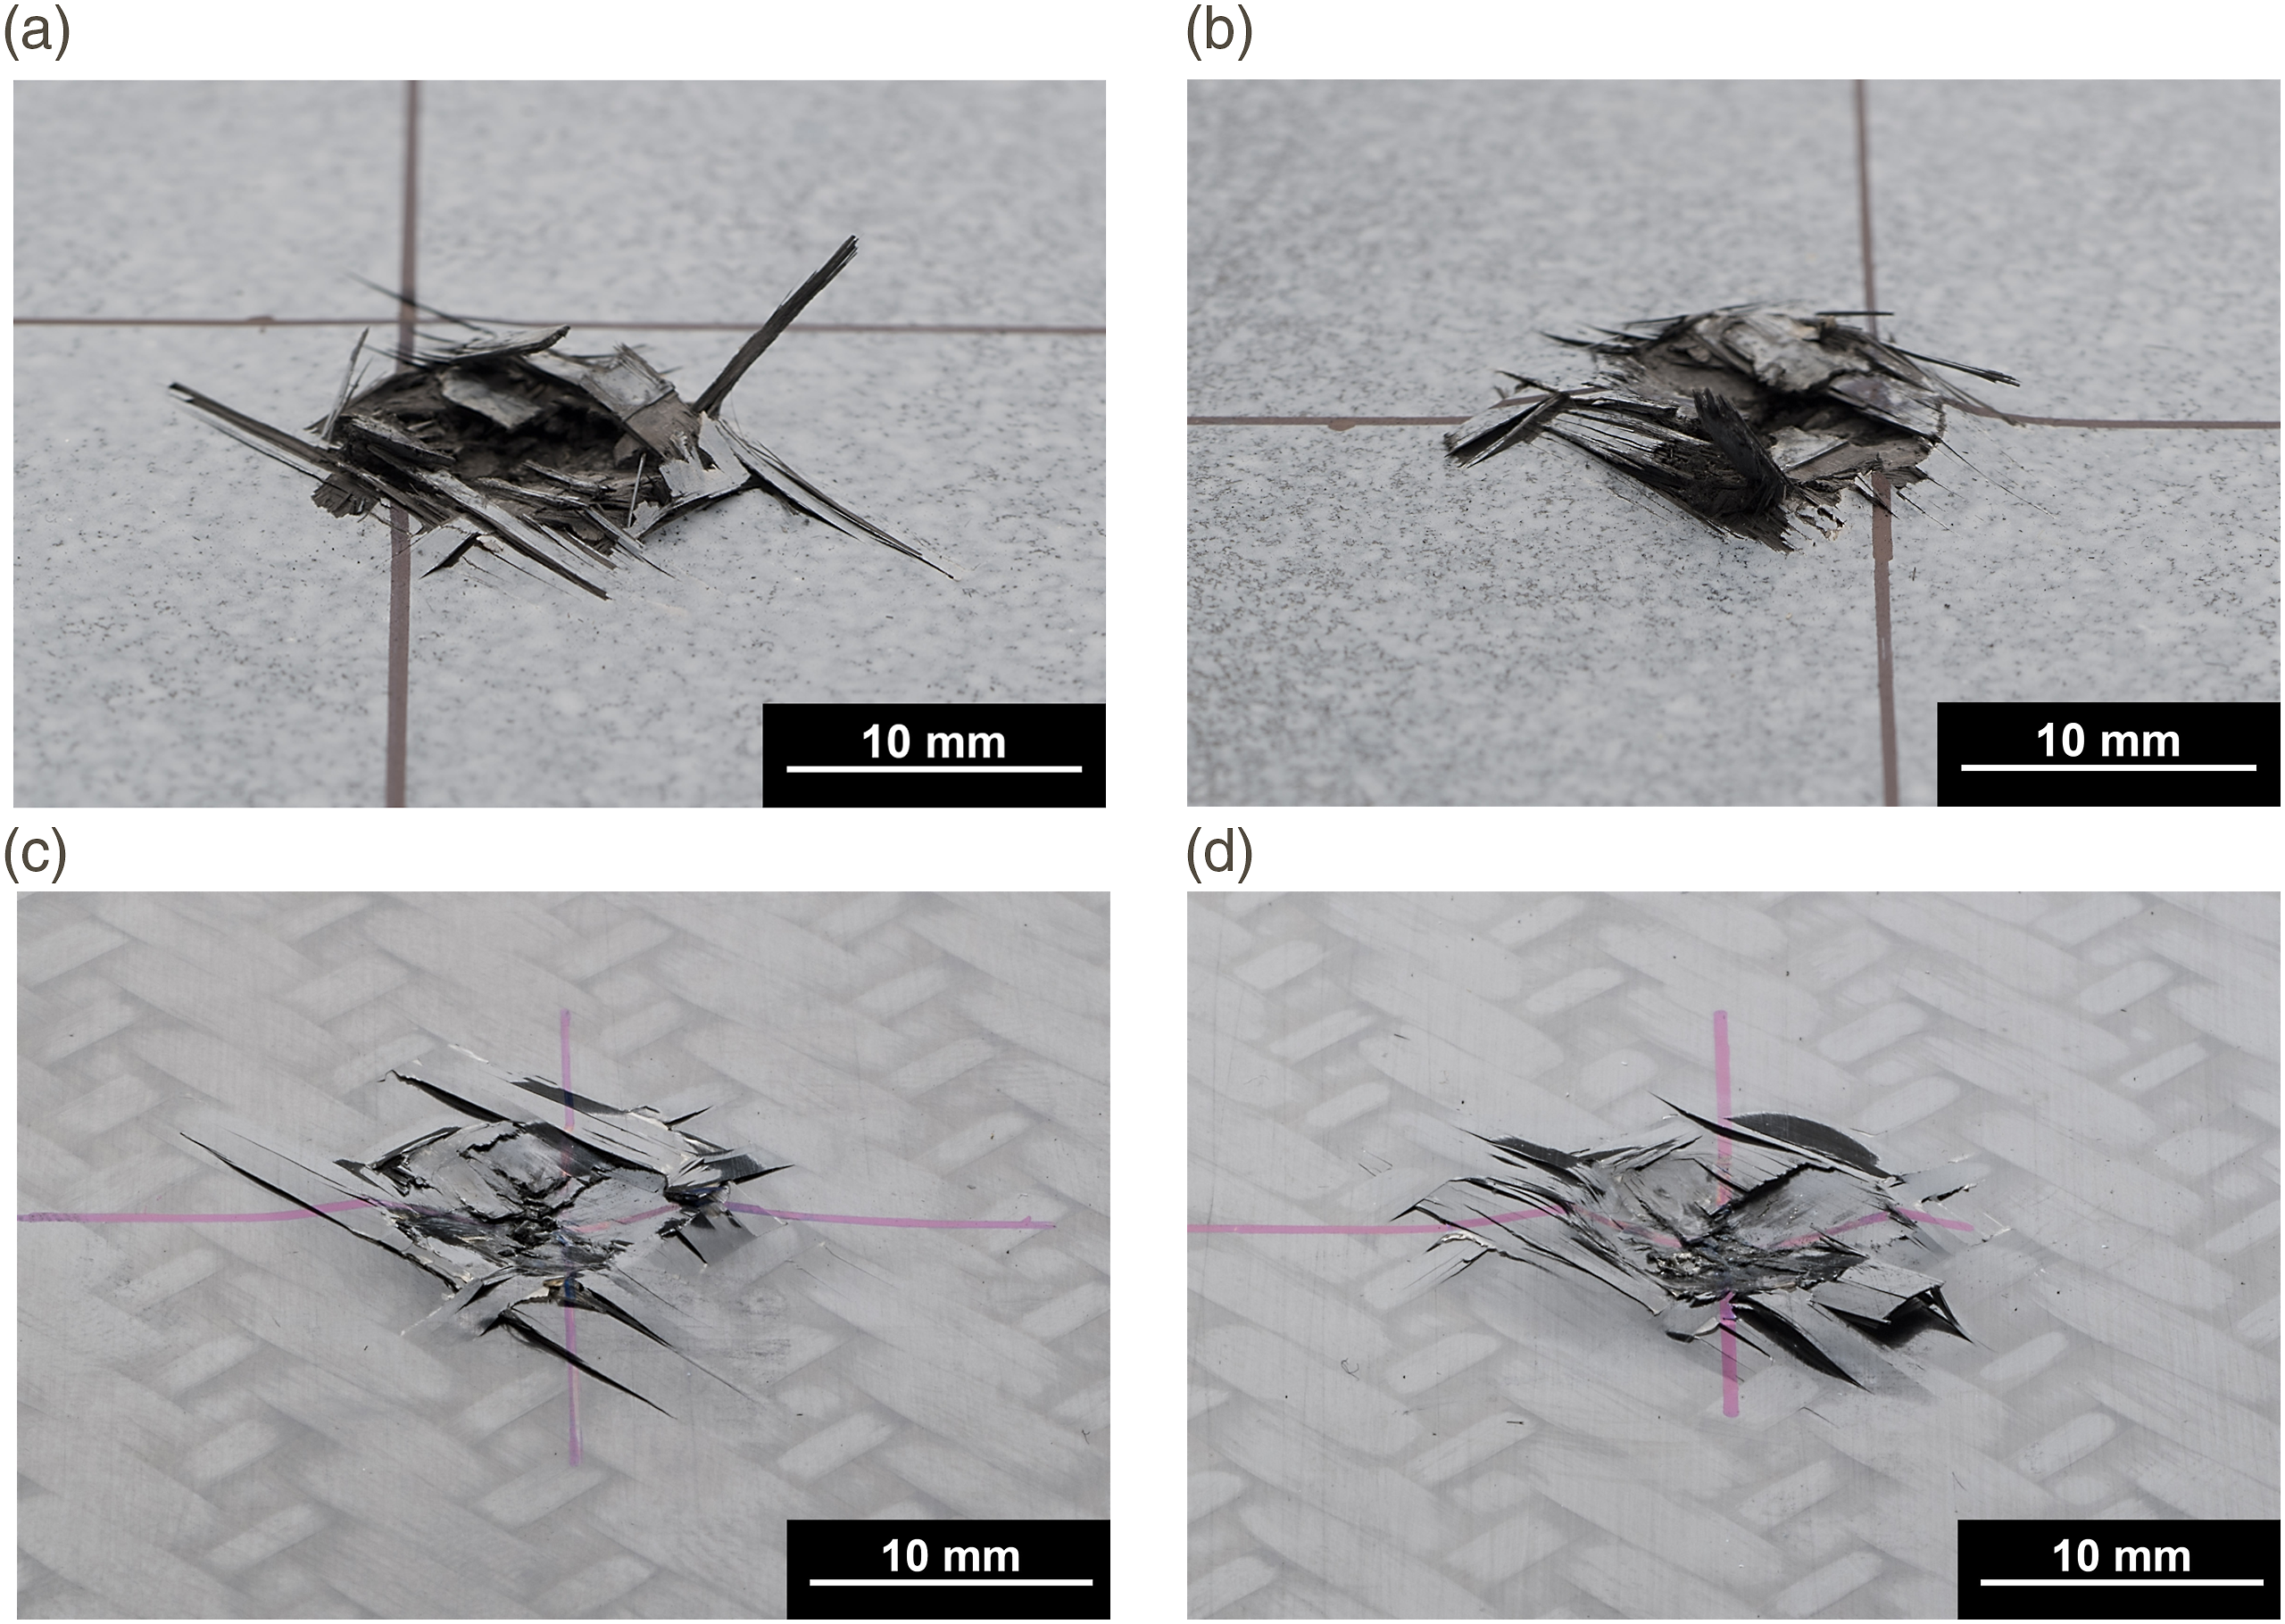
In addition to the dent depth measurements, there are three inspection types performed in order to characterise the damage state: ultrasonic C-scans, X-ray CT-scans of cylindrical cut-outs including the damaged region, and visual inspection of magnified cross-sections. Non-destructive C-scans, including Time of Flight (TOF), were made from the impacted and non-impacted side of the specimens with a 1 mm resolution. The advantage of a C-scan is that it is possible to capture the smallest delaminations because the ultrasonic signal is reflected once it encounters a material discontinuity. Due to this, there is no information below the first delamination. Therefore, an additional scan was made from the non-impacted side to provide additional information.
Of each four specimens, one was selected for destructive inspection and prepared as follows: First, cylindrical cut-outs that contain all the damage with a sufficient margin, as observed in the C-scans, are machined from the specimens. These cylinders are subjected to an X-ray CT-scan with a 26.25 μm resolution. After the CT-scans, the cylinders are halved and prepared for visual inspection with an optical microscope at a 5 × magnification. All cross-sections are made in the yz-plane and thus the layup appears 90° rotated compared to the layup mentioned in the Materials and specimen preparation section.
The quantification of the impact damage results from the following inspection techniques: The dent depth solely relies on the measurements with the dent depth gauge. The delaminated area, width and height are determined using the impact side C-scan results. These measurements are not possible using the visual inspection, due to the lack of information in 3D. As mentioned before, the resolution of the CT-scan was not sufficient. The TOF measurements from the non-impacted side provide the damage depth and allow to identify between which plies delaminations occur.
Compression-after-impact tests
The CAI experiments were performed using a static test bench at Royal NLR, see Figure 11. It was chosen to deviate from the ASTM standard for determining the compressive residual strength as it is focused on testing of thin specimens. The expected failure mode, and lack of a global buckling mode, require a different support fixture, contrary to the recommendations of ASTM standard for thin laminates. Instead of the ASTM standard, the following method was applied: The support fixture is derived from previous CAI experiments performed at NLR,
20
and consists of two anti-brooming devices clamped on the short edges of the specimen. If not used, brooming or splitting of plies might occur at the contact surface with the test bench due to high contact forces. The applied load is measured by the test bench as well as the applied displacement. However, due to the deformation of the test bench itself, the actual displacement is measured using two calibrated Linear Variable Differential Transformers (LVDTs). These are positioned on both sides of the specimen such that an average displacement of the centre point is obtained. Two synchronised high-speed cameras, pointed at the impacted and non-impacted side of the specimen, capture final failure at 20,000 fps. Damage mechanisms that occur before final failure are logged by capturing real-time images from the high-speed cameras. The CAI test setup with a 40 mm thick specimen subjected to a 100 J gas-cannon impact (40-QI-SM-100-1) showing a Middle Top Progress failure mechanism. Note: CAI: compression-after-impact.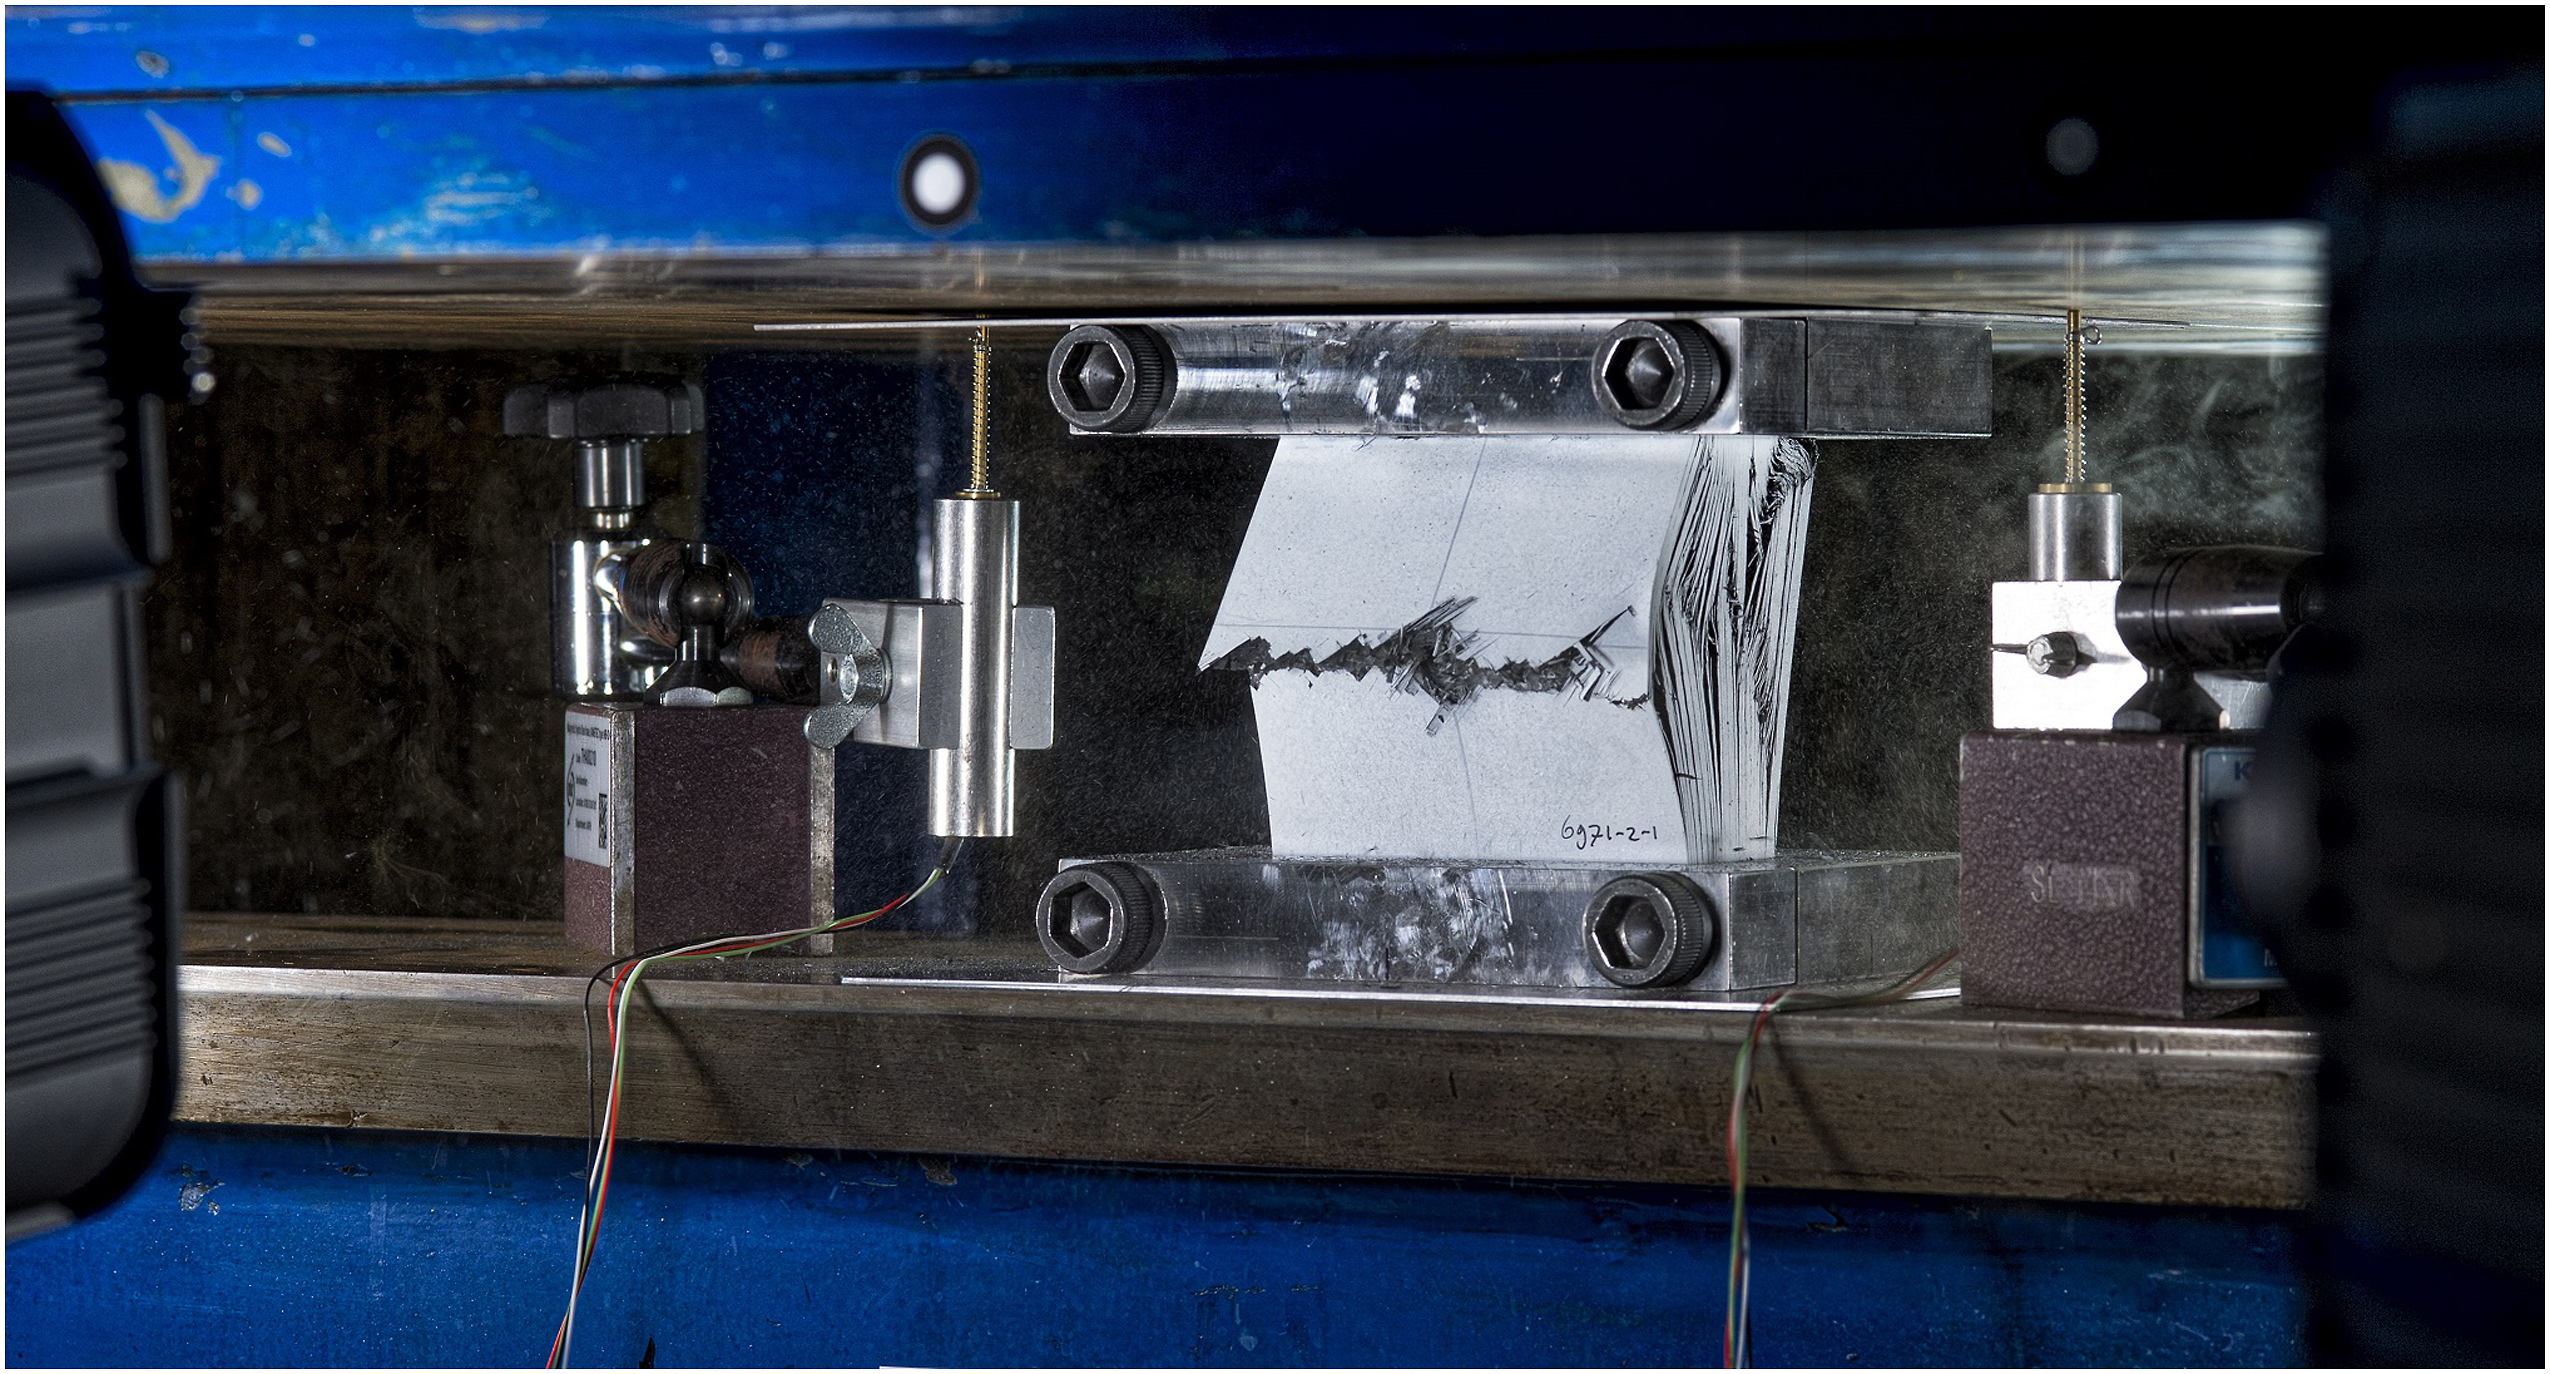
Gaps between the specimen and anti-brooming devices are visually checked and readjusted if necessary. The specimen with anti-brooming devices is placed in the test bench and visually aligned. The displacements of the left and right LVDT are compared to check if bending occurred. First, a pre-load up to 20 kN is applied to confirm alignment. After unloading to approximately 1 kN the applied force and displacement are set to zero. For the actual compression test, a displacement-controlled loading of 0.3 mm/min is applied until final failure (i.e. at least a 30% load drop).
Results and discussion
Impact tests
The different test configurations provide valuable insights on the effect that the thickness, layup and impact energy/mass have on the failure response of thick laminates. One important additional objective of these tests is to provide suitable data for validation of analytical or numerical impact models applicable for thick composite structures, which is currently not readily available in the literature. Two aspects are relevant in the analysis: (i) the resulting impact damage and (ii) the global impact response in terms of force-displacement histories. The impact damage is characterised in terms of the type of cracks and their locations, whereas the impact response can be quantified in terms of the maximum impactor displacement, the peak force, the impact duration and the transferred energy.
This section starts with a description of the observed characteristic impact damage of thick composite laminates. A complete overview of the measured damage can be found in Appendix 1. Figure 12, which is based on the detailed data given in the Appendix, shows the average impact damage in terms of the dent depth and the delaminated area for large-mass (LM) drop-weight impacts and small-mass (SM) gas-cannon impacts. With this data, the effect of four different aspects can be evaluated, namely (i) specimen thickness, (ii) drop-weight versus gas-cannon, (ii) impact energy, and (iv) specimen layup. Average impact damage in terms of (a) delaminated area and (b) dent depth for LM drop-weight impacts and SM gas-cannon impacts. Note that the results annotated with OT contain the specimens with an orthotropic layup. Note: LM: large-mass; SM: small-mass.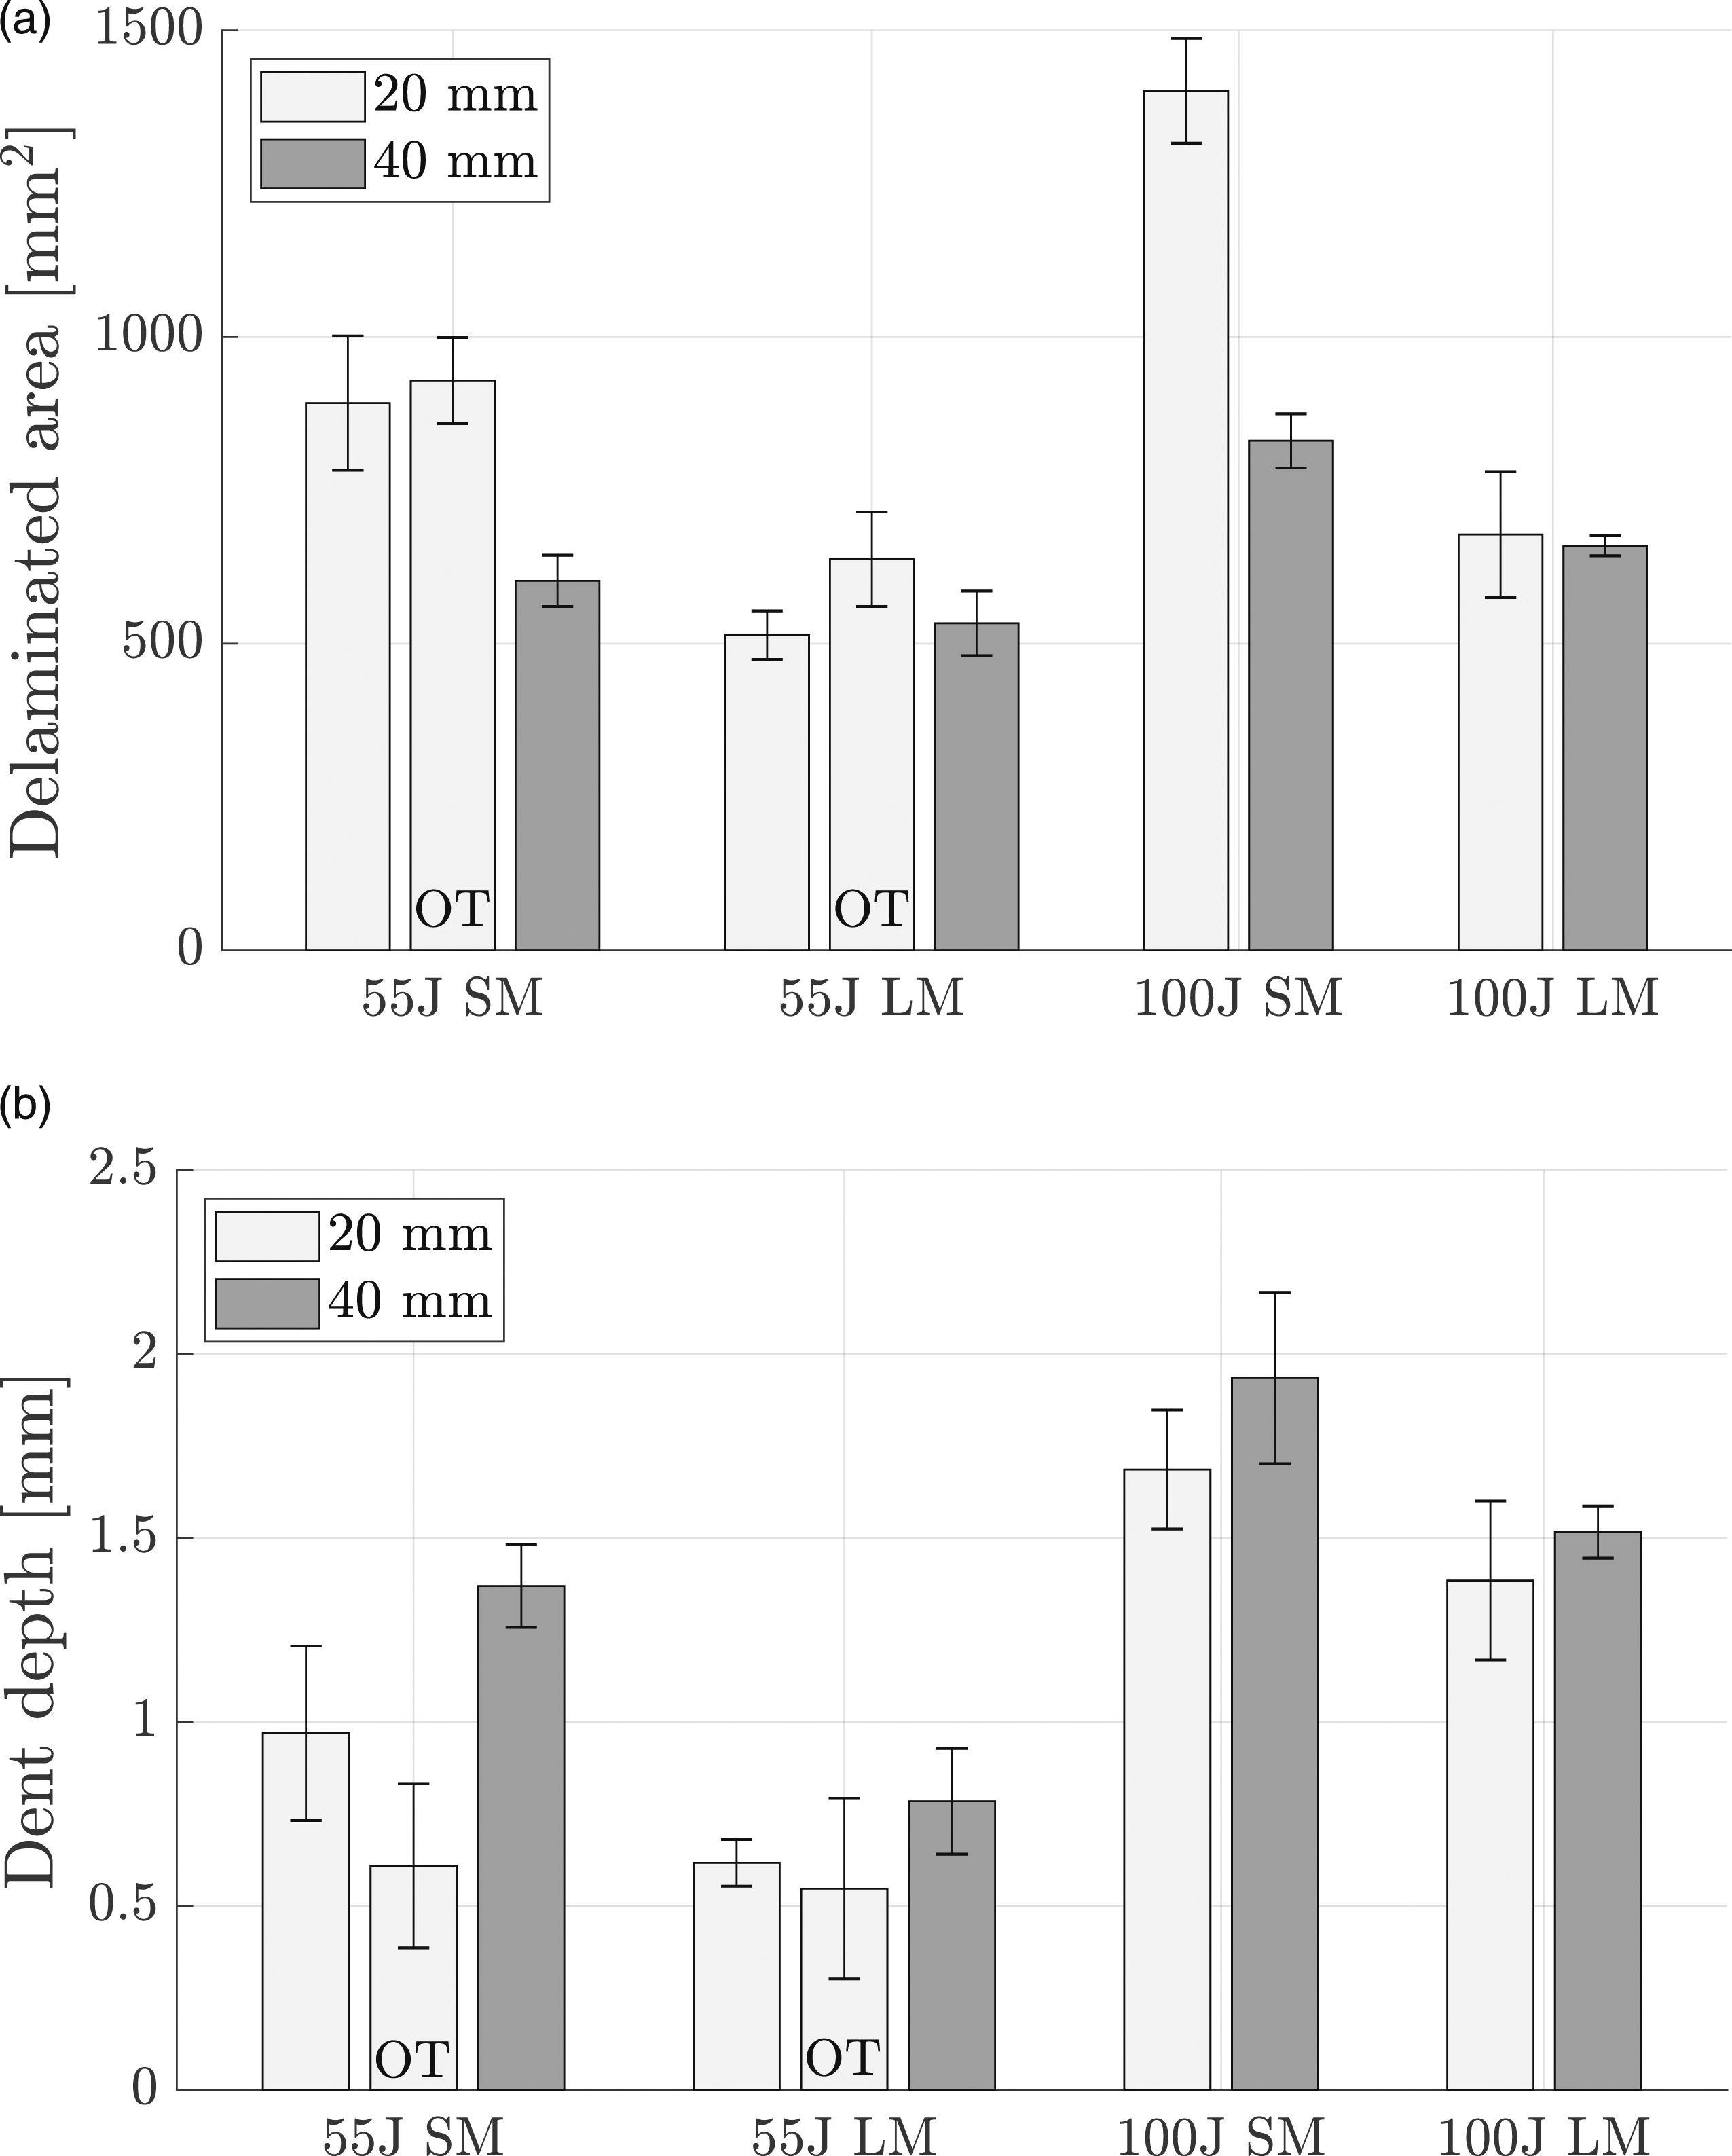
Characteristic impact damage of thick composite laminates
Impact on thin composite laminates has been extensively characterised and generally results in a relatively quasi-static impact response with significant deflections due to bending. As a result, the damage extends typically through the full thickness of the specimen with fibre breakage at the back of the specimen. 3 As most of the energy is dissipated in these mechanisms, a clear dent in thin laminates is usually absent or is relatively small.
In contrast, due to the limited amount of bending experienced by thick composite laminates during impact, the observed damage patterns and impact response shows different characteristics compared to thin composite laminates. In thick composite laminates, a large portion of the energy is dissipated by creating a dent at the impact location, see Figure 10. This dent is formed due to crushing of several plies at the impact location of which some parts are propelled in the air. At the same time, material is pushed outward in the top few layers that experience compression in the longitudinal direction. In this area, kinking and buckling occurs, which is identified by protruding layers around the dent. This phenomenon may be observed in Figure 13, which shows the cross-section of a specimen subjected to 55.3 J impact. Kinking and buckling, which may be seen at the bottom left of Figure 13, is mainly observed for large-mass low-velocity impacts on 20 mm specimens, with a lower impact energy, that result in smaller dents. Cross-section of specimen 20-OT-LM-55-4 with highlighted crack boundaries and a detailed view of two damage mechanisms characteristic of thick composite specimens. On the left, longitudinal compressive loads resulting in fibre kinking and buckling in the top plies and, on the right, interaction between transverse cracks and delaminations.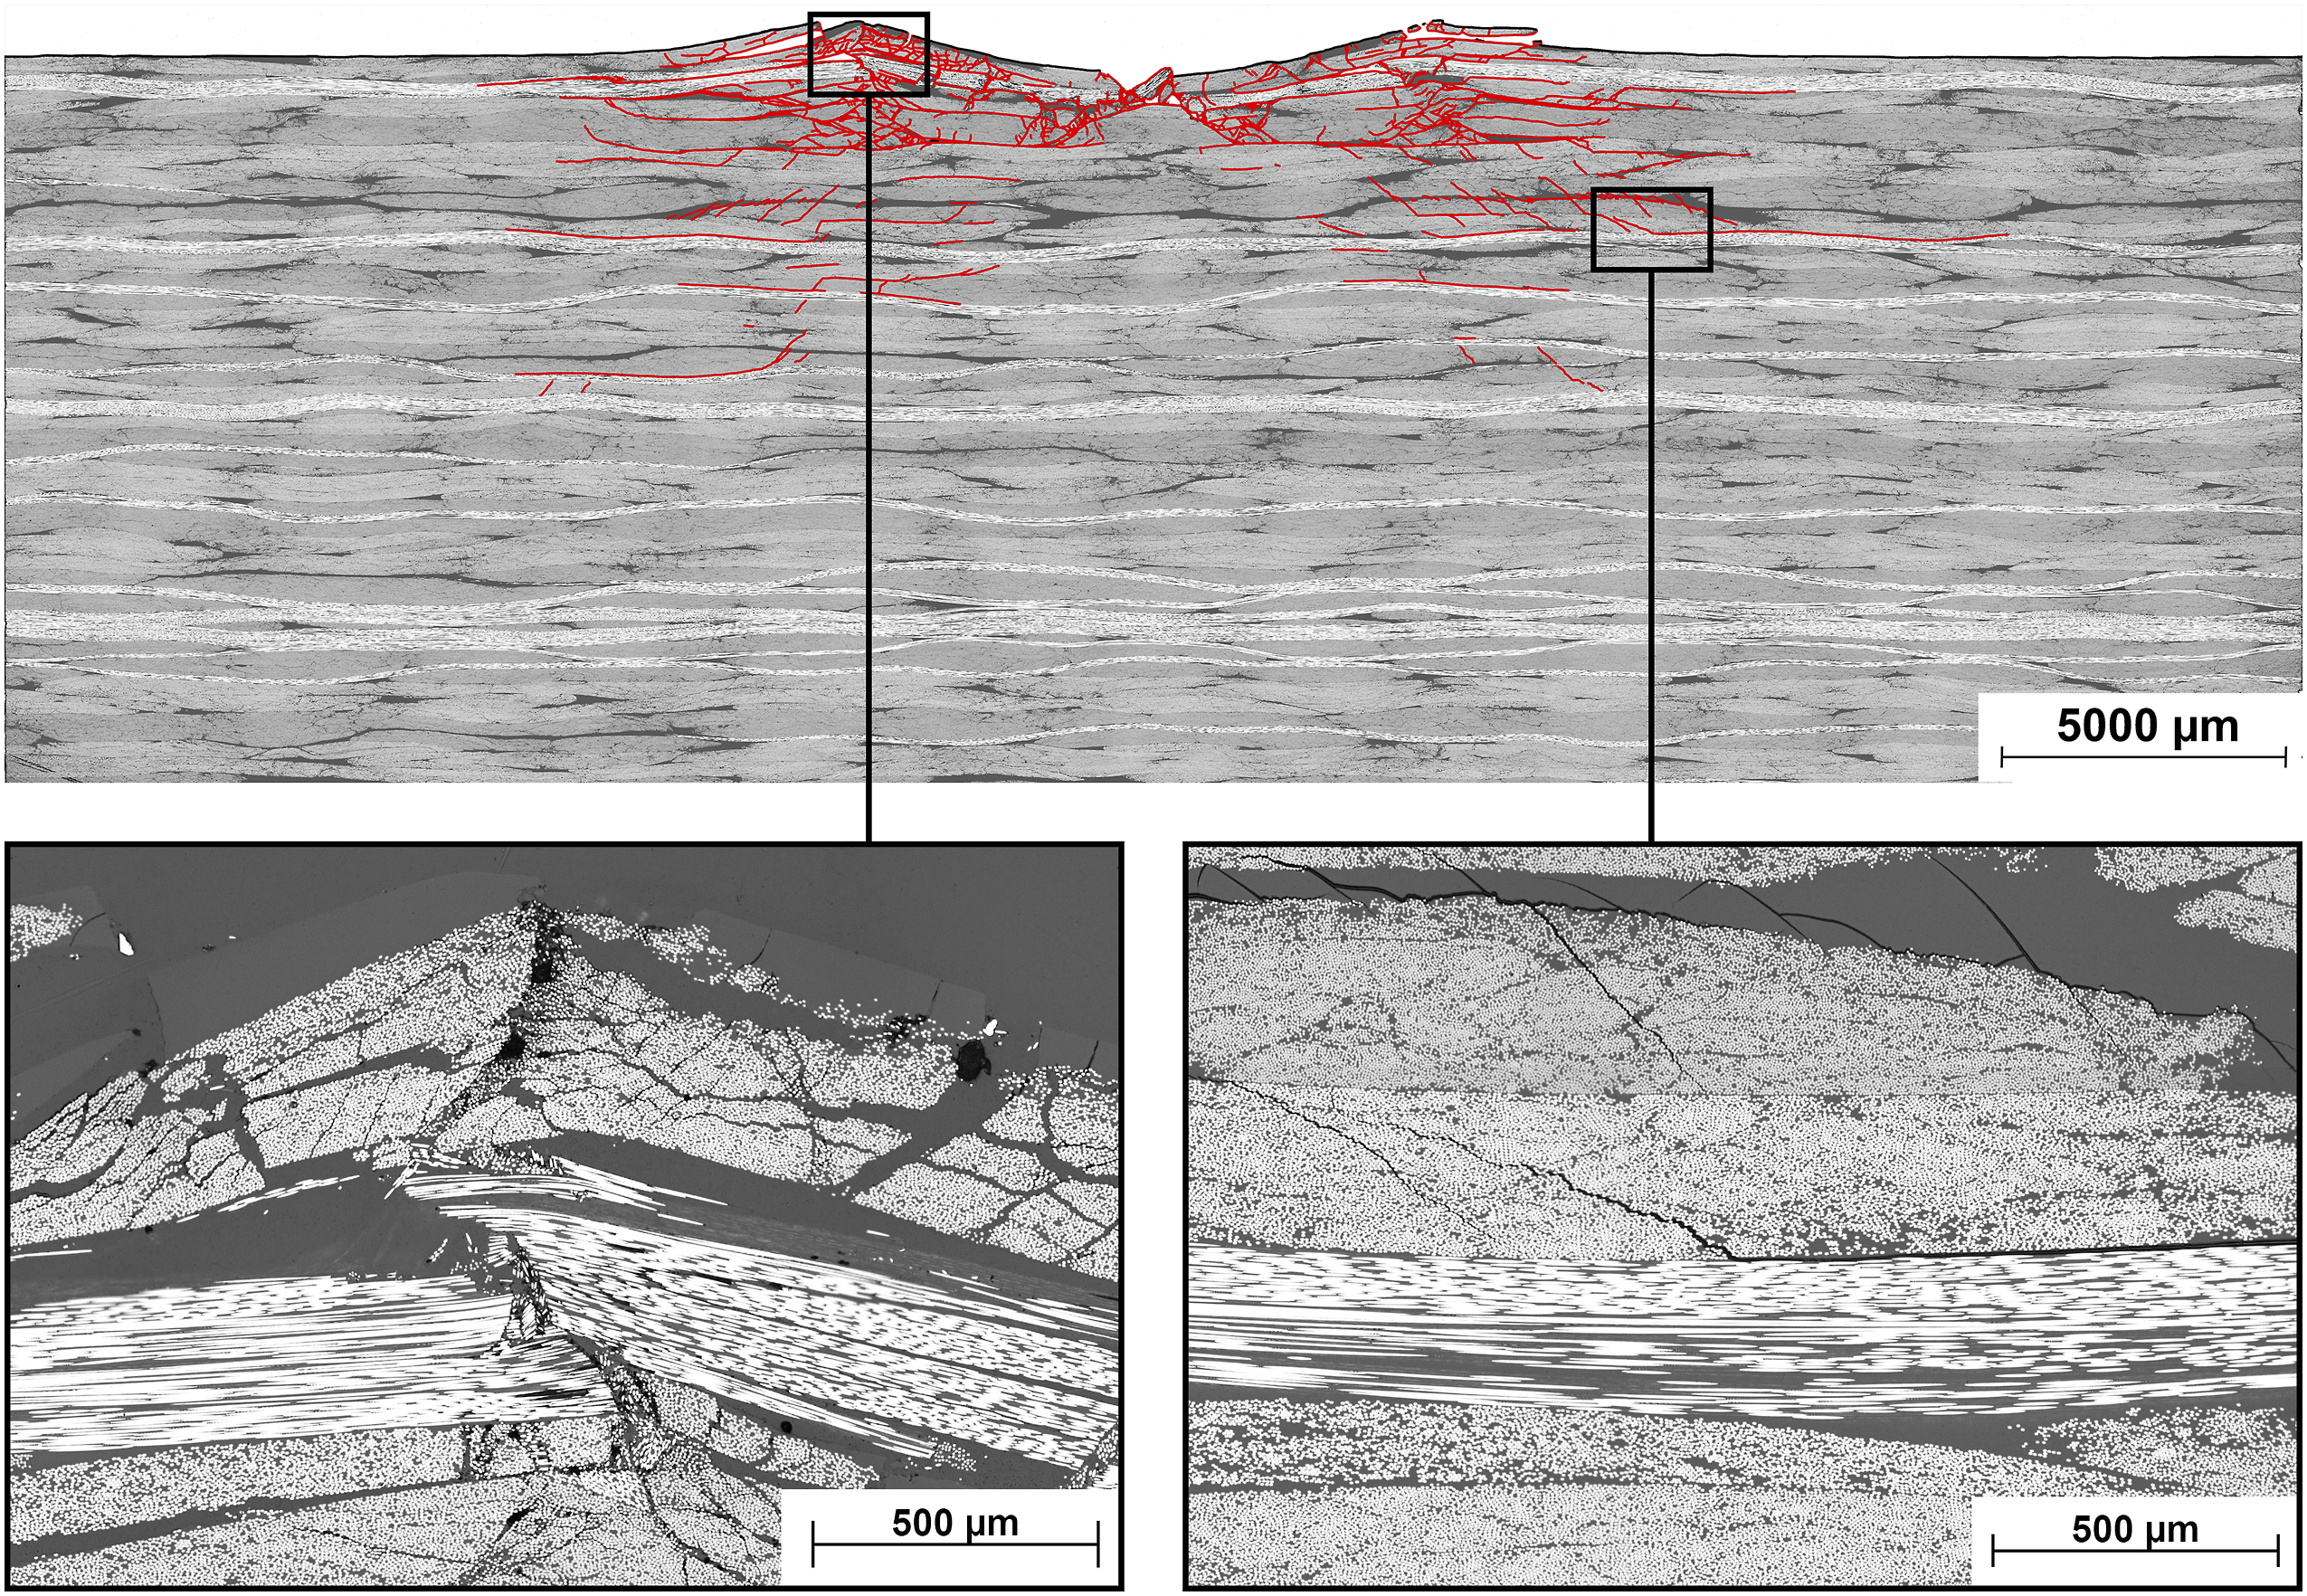
Beside a dent, no damage is typically observed directly underneath the impact location. Due to increasing transverse shear stresses away from the centre of impact, delaminations and transverse cracks appear, resulting in a typical hat-shaped damage pattern as highlighted in red in Figure 13. In the same figure, the detailed interaction between delaminations and transverse cracks is illustrated in the magnified view, which shows the transition from transverse cracking to delamination. In all cross-sections the dominant delaminations extend along the interface between warp yarns. For instance, the delamination in Figure 13 initiates from a transverse crack and propagates along the warp yarn in white. Interestingly, these delaminations only occur above the warp yarns. The bending, although limited, leads to compressive forces in the top half of the specimen. The compression causes slight buckling of the warp yarn, which makes it easier for these interfaces to delaminate. The depth of delaminations is approximately 4–7 mm. In contrast to impact damage in thin composite specimens, the damage does thus not fully extend to the bottom of the specimen and no fibre breakage is observed at the back side. Due to this, beside the dent, all the critical damage for the residual strength is not visible.
The effect of laminate thickness
A thickness effect is observed when comparing impacts on 20 and 40 mm thick specimens in Figure 12. The impactor displacement of the 20 mm specimens is approximately 8–11% higher compared to the thicker specimens. For the drop-weight experiments, the dent depth of 20 mm specimens is 21.52% lower for 55 J impacts and 8.55% lower for 100 J impacts. In the case of gas-cannon impacts, the dent depth of 20 mm specimens is 29.20% lower for 55 J impacts and 12.89% lower for 100 J impacts. Accordingly, it can be assumed that this higher impactor displacement is a result of more bending. This increased bending of the 20 mm specimens on average results in a noticeably higher delaminated area in the case of the gas-cannon impacts (i.e. +48% for a 55 J impact and +69% for a 100 J impact). Surprisingly, no significant difference in delaminated area is observed for the drop-weight impacts (LM specimens in Figure 12(a)).
The effect of impact energy and impact velocity
Effect of impactor energy increase from 55 to 100 J on dent depth and delaminated area.
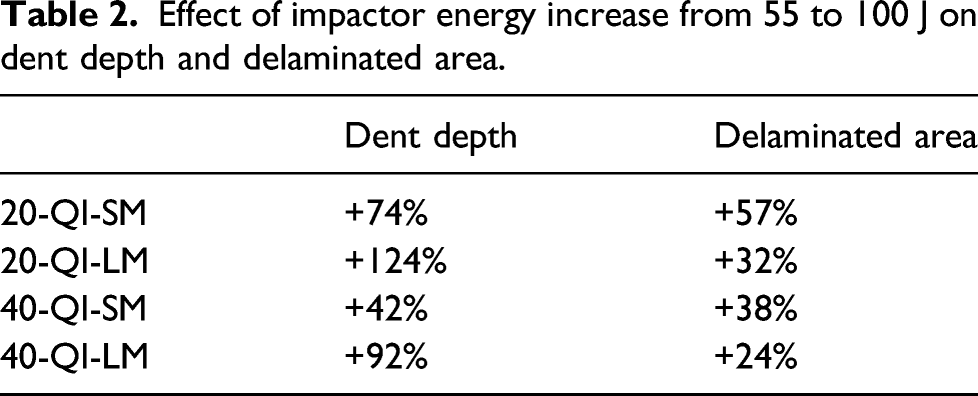
Drop-weight impacts show a larger increase in dent depth compared to gas-cannon impacts, (i.e. 109% vs 58%) and a smaller increase in delaminated area (i.e. 28% vs 47%). In terms of impact response, for the gas-cannon impacts, the peak force and maximum impactor displacement increase equally by approximately 37% and 31% respectively. On the other hand, for drop-weight impacts the increase in peak force is only 9% while the maximum impactor displacement is 55% higher. This is explained by the 109% higher dent depth for 100 J drop-weight impacts. In creating a dent, the contact force is reduced significantly and the impactor penetrates deeper in the specimen.
Effect of impactor mass
The effect of impactor mass can be determined by comparing drop-weight impacts with gas-cannon impacts for the same energy level. In contrast to the effect of impact energy in the previous section, switching to a higher impactor velocity, at the same impact energy, significantly affects the impact damage mechanisms. For instance, the gas-cannon impacts show a 38% deeper dent and 51% larger delaminations compared to drop-weight impacts.
A possible explanation for the activation of distinct damage mechanisms can be found by understanding how the energy is transferred during impact. Neglecting acoustic effects and changes in temperature in the impactor, the energy transferred from the impactor to the specimen can be measured from the change in kinetic energy of the impactor as indicated in equation (3). This energy is transferred to the specimen during impact and converted into elastic bending energy and further dissipated in the specimen through damage and thermal mechanisms.
To get further insight on the damage induced in each type of test, the delaminated area and the dent depth are shown in Figure 14 as functions of the energy transferred from the impactor to the specimen. The results in Figure 14 show a 68–88% transferred energy range for large-mass low-velocity test, while for small-mass high-velocity tests 89–94% of energy is transferred to the specimen. For the drop-weight impacts an overall trend is that for a higher transferred energy the dent depth increases (see Figure 14(b)), while no significant change in delaminated area is observed (see Figure 14(a)). Since drop-weight impacts generally tend to a quasi-static response, the force and displacement histories align, so that most bending energy is returned to the impactor. Therefore, it can be assumed that, neglecting thermal effects, most of the transferred energy is dissipated in damage. On the other hand, for small-mass high-velocity experiments, the force and displacement history are out-of-phase. Not all bending energy is restored in the form of kinetic energy of the impactor, resulting in a high transferred energy. Relation between transferred energy and (a) delaminated area and (b) dent depth for LM drop-weight impacts and SM gas-cannon impacts. Note: LM: large-mass; SM: small-mass.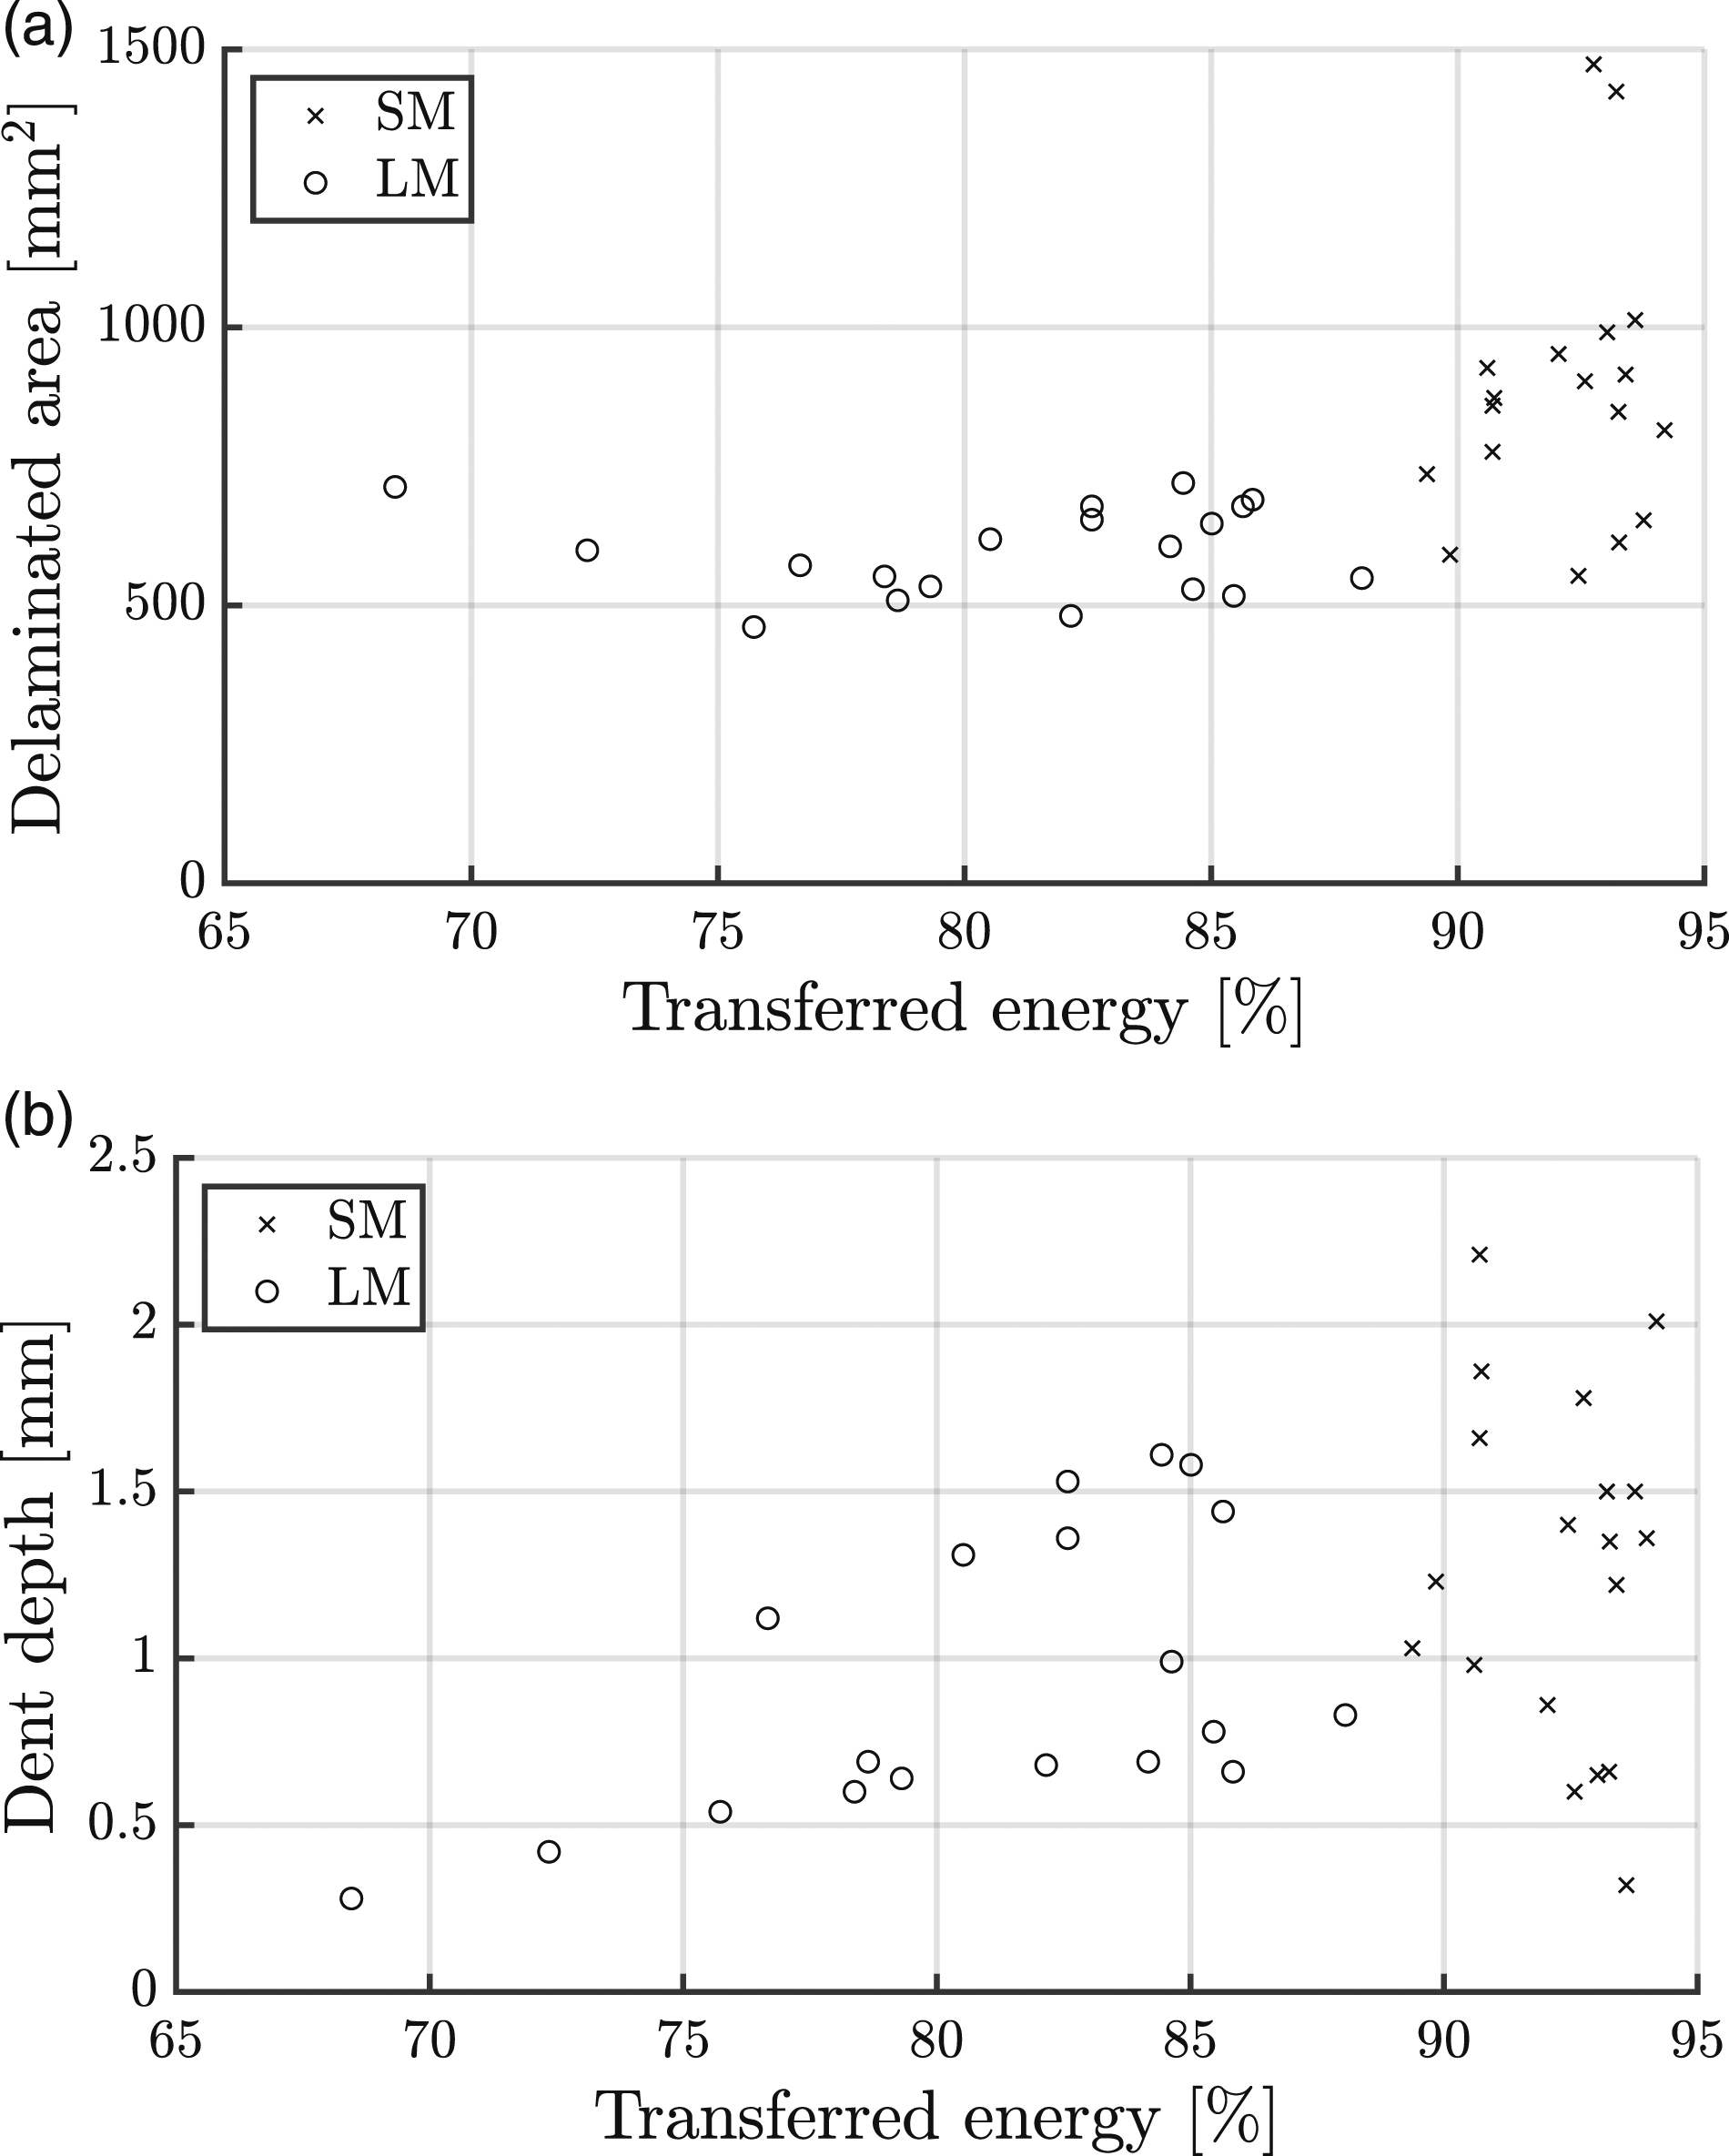
Energy that is not returned to the impactor is partly dissipated in damage creation, and in the case of gas-cannon impacts partly still present in the form of elastic stored energy and kinetic energy. This results in global bending oscillations in the absence of an impactor. This stored energy is partly dissipated by inelastic mechanisms, including propagation of delaminations, resulting in damping of the oscillations. As a result, the delaminated area is on average 51% higher for the gas-cannon impacts compared to the drop-weight impacts. A 25–30% lower estimated maximum plate centre deflection for the 40 mm specimens indicates that these global bending oscillations are significantly larger for the 20 mm specimens. Hence, a 48–69% increase in delaminated area for the 20 mm specimens.
Typical damage information based on cross-sections and C-scans is shown in Figure 15. The considerable higher delaminated area for gas-cannon impacts is shown in Figure 15 for a 100 J impact on a 20 mm thick specimen. Similar to Figure 13, the delamination shown in Figure 15 initiates from a transverse crack and propagates along the warp yarn. In Figure 15(a) all internal damage is hidden behind the dent and therefore not visible in the impact side TOF C-scans. In addition to the lower delaminated area, looking at the cross-sections, the damage extends approximately 1 mm further in the thickness direction. Specimen 20-QI-SM-100-1, shown in Figure 15(b), is treated as an outlier with a delaminated area twice as large as the other three specimens. Due to this, it is excluded from Figure 14(a). Damage comparison between 100 J (a) drop-weight impacts and (b) gas-cannon impacts on 20 mm thick specimens. In the middle, the cross-section of one of the four specimens is shown, 20-QI-LM-100-2 in (a) and 20-QI-SM-100-2 in (b), where the crack boundaries have been highlighted in red. TOF scans are shown for all four specimens, the impact side on top and non-impact side on the bottom. Note: LM: large-mass; SM: small-mass; TOF: time of flight.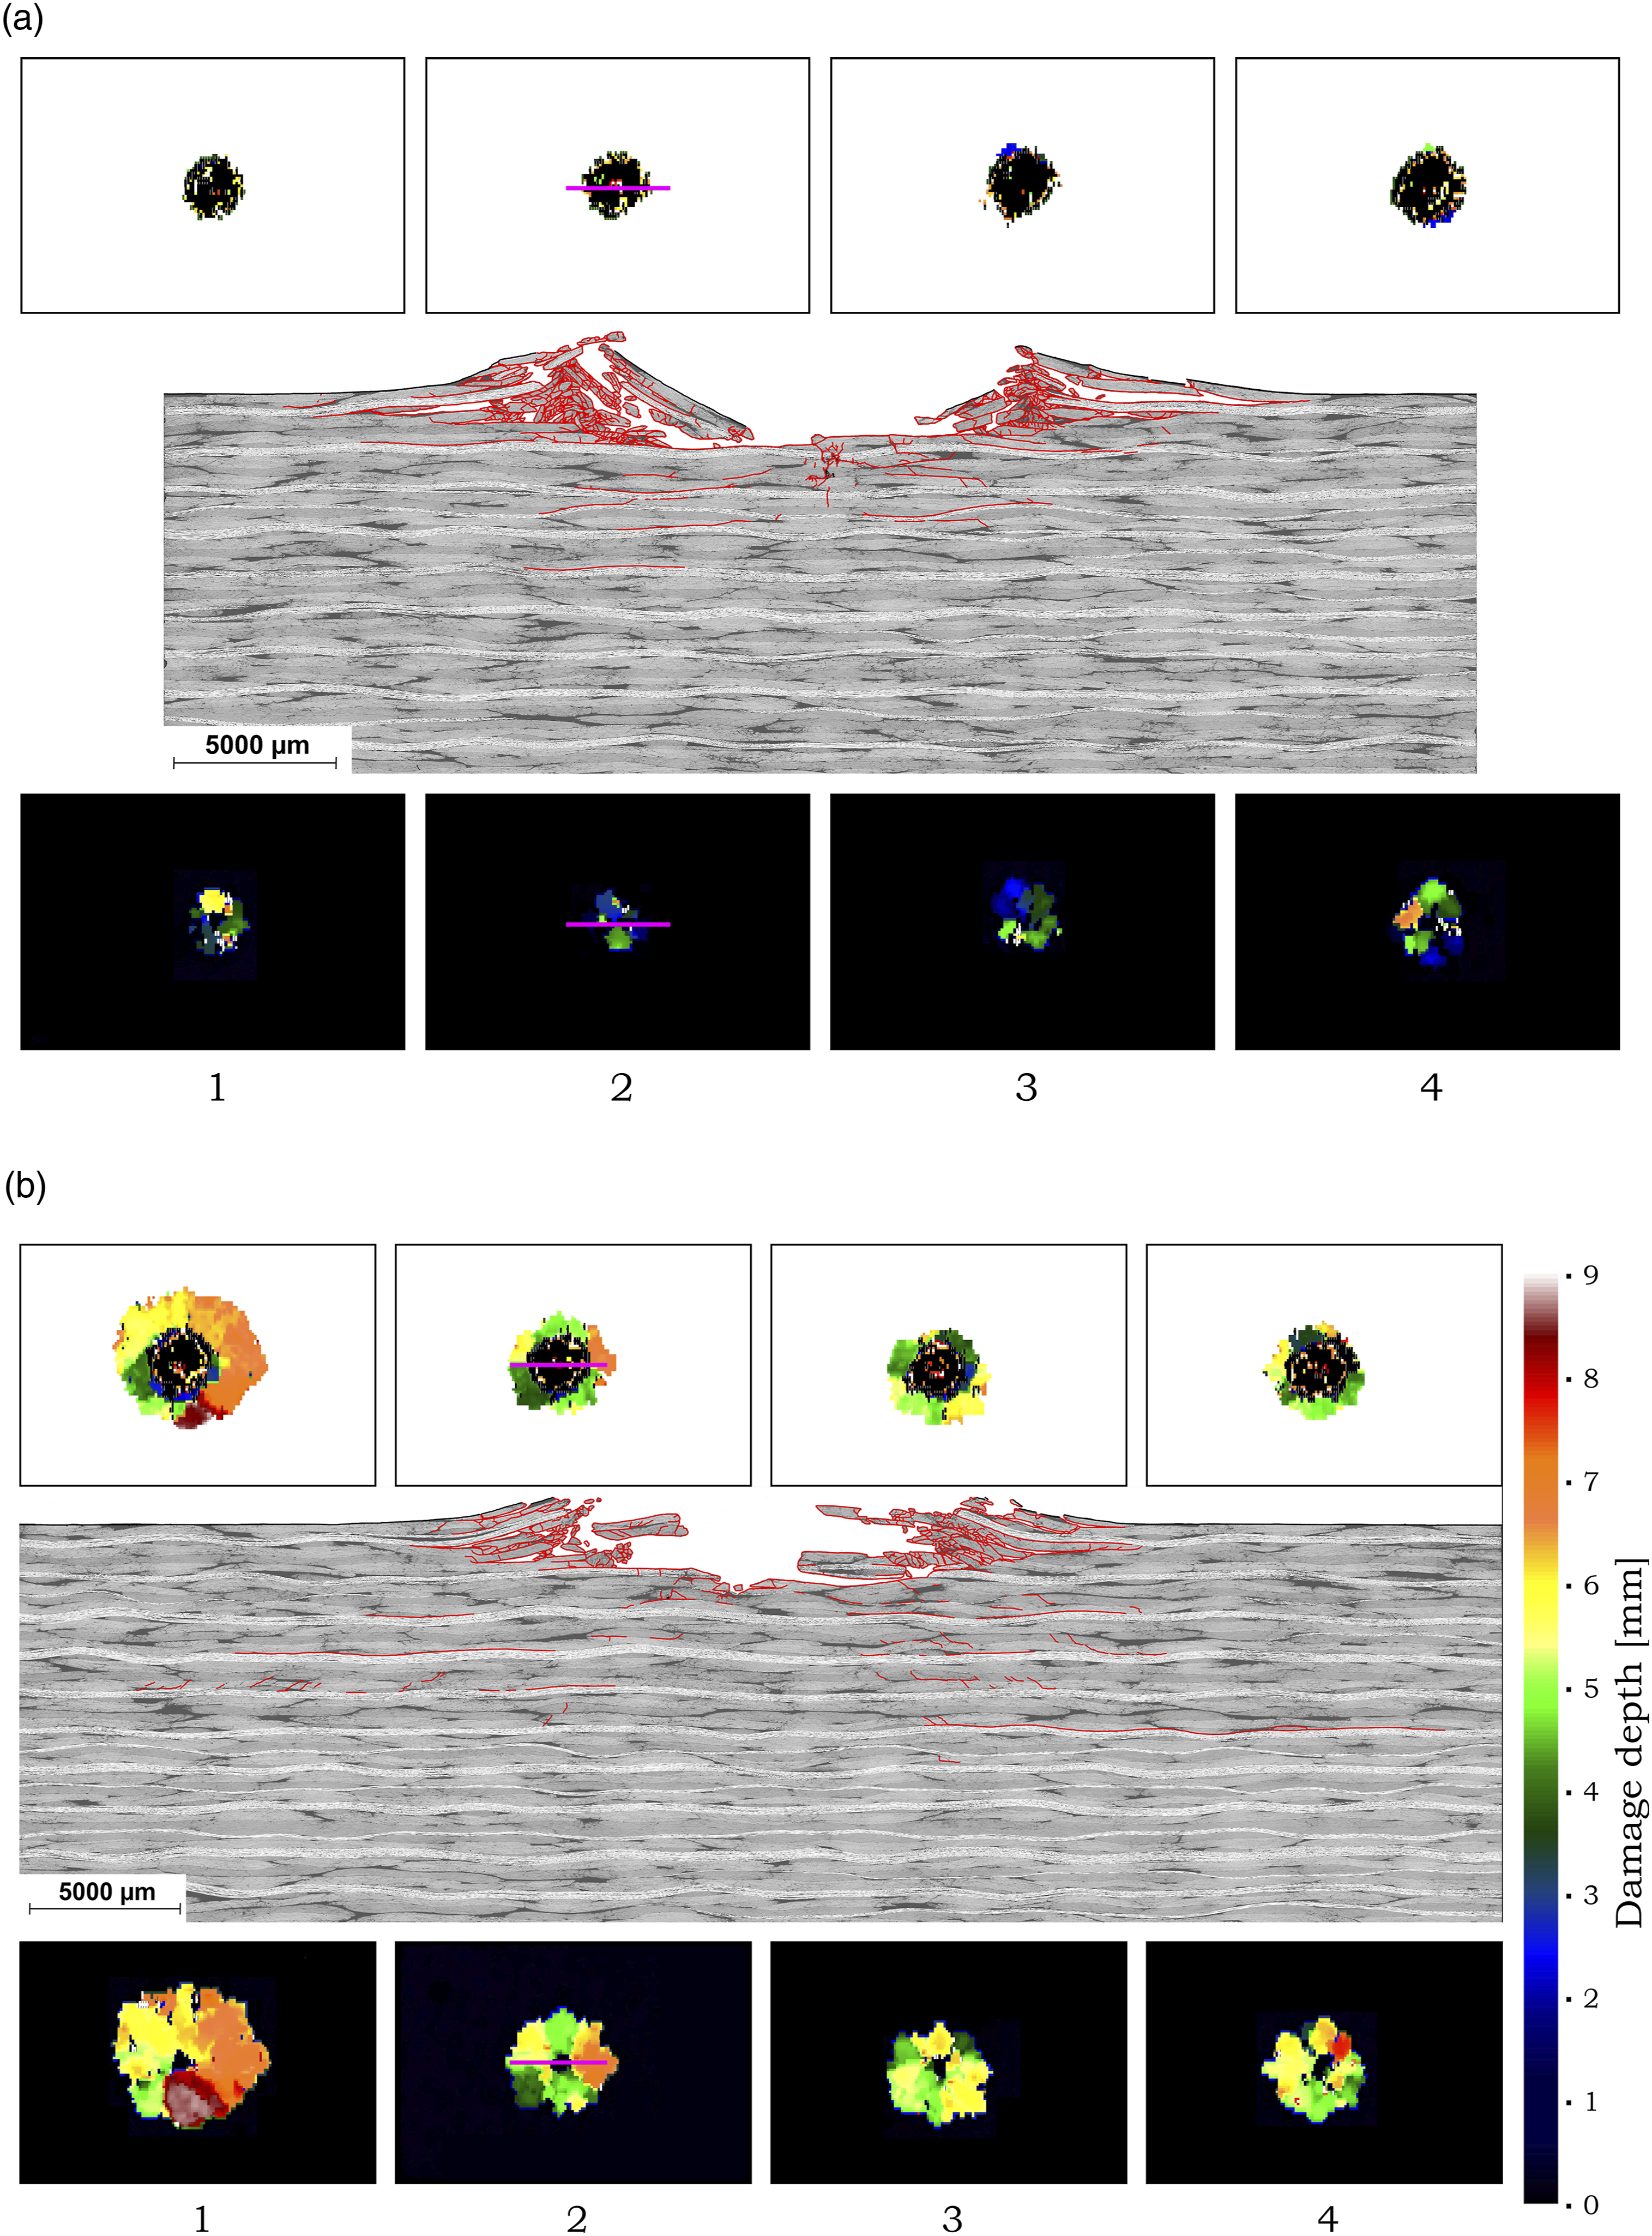
For 55 J impacts on 20 mm thick specimens, the impact force as a function of the impactor displacement, is shown in Figure 16. From the figure, it can be seen that the drop-weight and gas-cannon impact each have a distinct impact response. Gas-cannon impacts generally have a higher impactor displacement and lower peak force. The effect of layup for 55 J LM drop-weight impacts and SM gas-cannon impacts on 20 mm thick specimens. Note: LM: large-mass; SM: small-mass.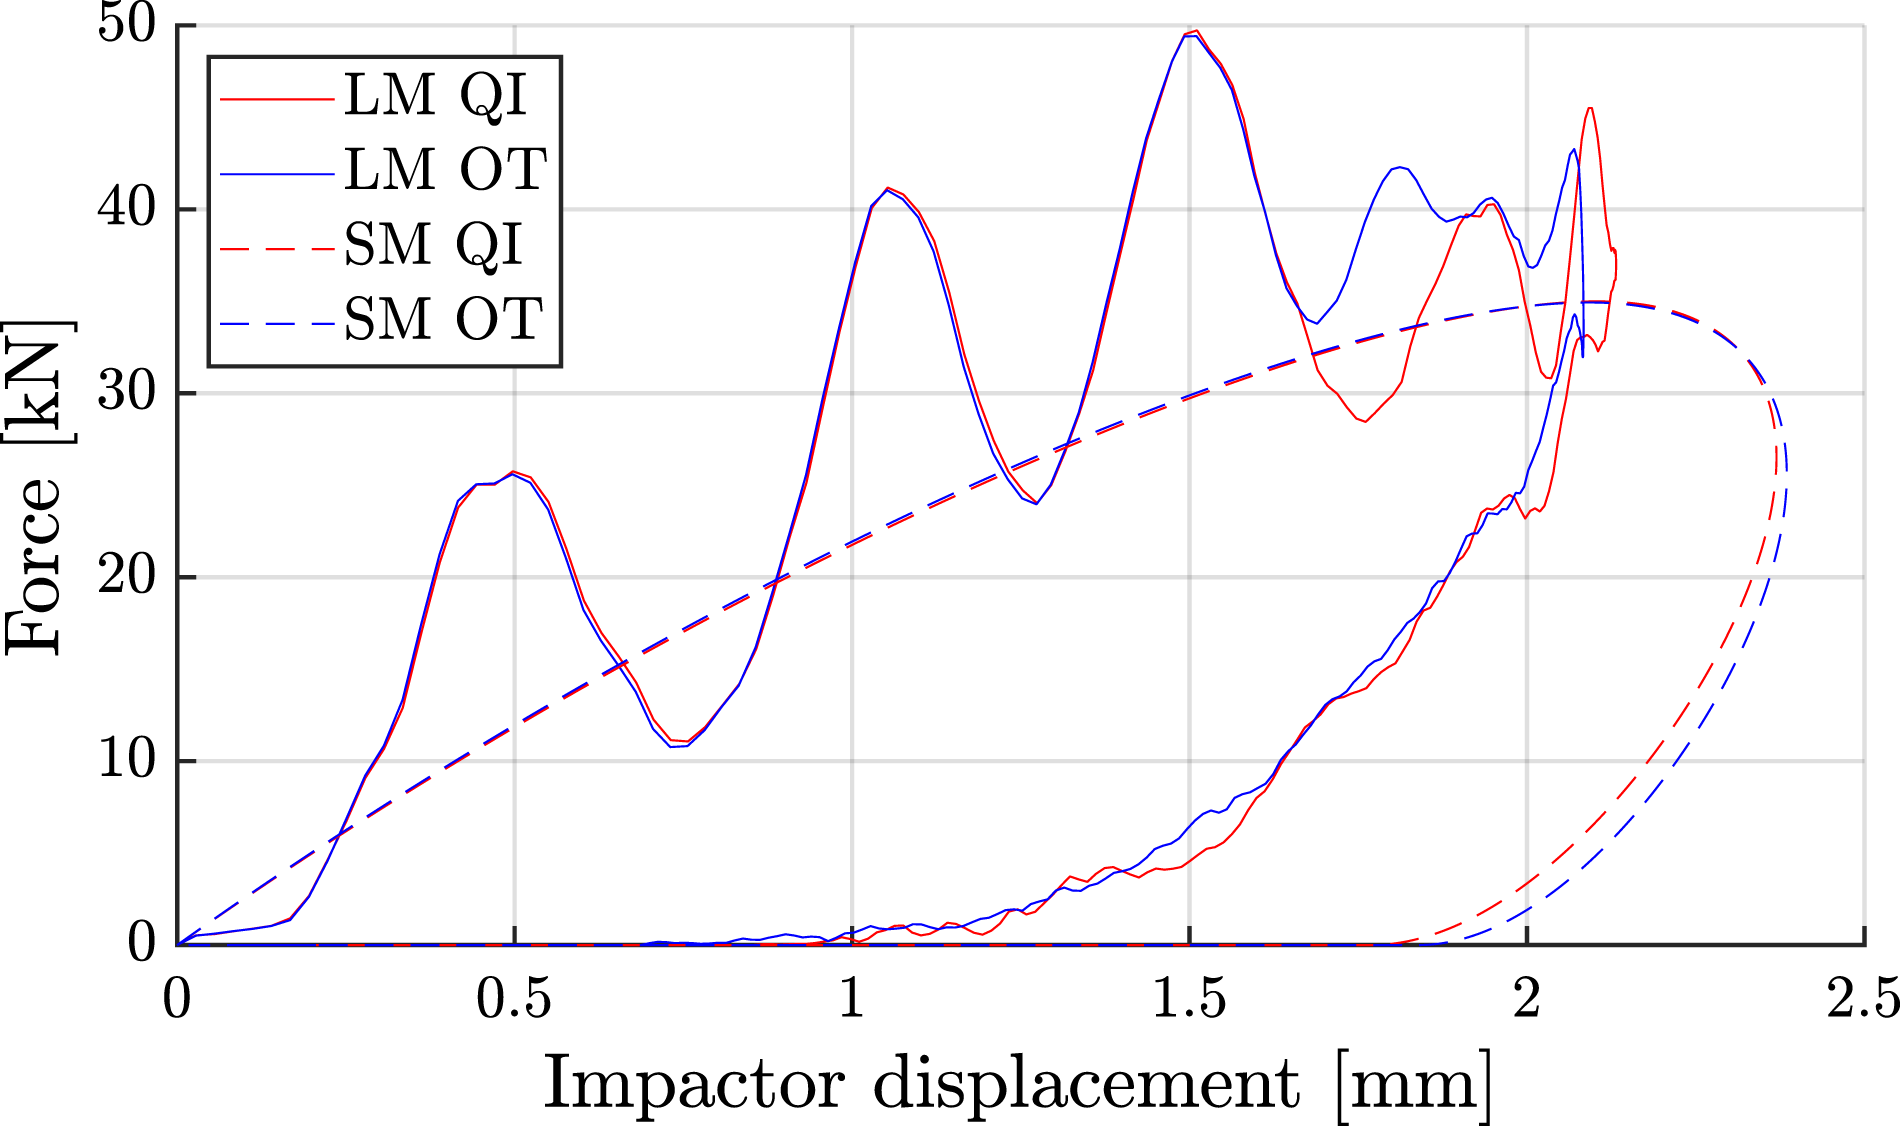
The effect of laminate layup
Comparing the responses for the distinct layouts, it can be concluded from Figure 16 that the details of the layup have a negligible effect on the overall impact response. However, there are some important differences in terms of damage. In Figure 12, the observed damage in 20 mm specimens with a OT layup are compared to 20 mm specimens with a QI layup. For the gas-cannon impacts, specimens with the OT layup show on average a 37% shallower dent compared to the specimens with a QI layup. At the same time, the delaminated area is only 4% higher on average. For the drop-weight impacts, the decrease in dent depth is only 11% and increase in delaminated area 24%. According to these results, it seems that the QI layup is more sensitive to crushing of the first few plies. As more energy is dissipated in this damage mechanism, the energy that is left for bending and subsequent delaminations is lower.
There are no local layup variations that explain the above behaviour since in all cases the dent extends within the first four plies (i.e. <1.24 mm) that are identical for both layups. Knowing that the global bending (i.e. impact response) is also similar, the change in dent depth can only be explained by the presence of adjacent plies with the same orientation in the OT layup. It is known that these plies can show a greater resistance to delaminations. 6 This is confirmed by the visual inspection of cross-sections, for instance, the top image in Figure 13. It is observed that, for the plane parallel to the long edge of the specimen, the largest delaminations appear along the warp yarns of 0° plies at the 45°/0° interface. For the QI layup, for example, in Figure 15, these interfaces appear more frequent than for the OT layup. As a result, the OT layup has fewer delaminated interfaces but the delaminations that occur have a larger area. This effect results in a shallower dent because fewer plies delaminate below the dent.
For the drop-weight impacts on QI specimens, the higher dent depth is compensated by a decrease with the same order of magnitude in delaminated area. However, the gas-cannon impacts on OT specimens show a disproportional decrease in dent depth (i.e. −37%) compared to the increase in delaminated area (i.e. +4%). It is speculated that the mechanisms inherent of gas-cannon impacts, such as the global bending oscillation in absence of an impactor, could explain this discrepancy. However, the available data and observations do not give a definitive answer.
Compression-after-impact tests
In the previous section, impact tests assessed the damage resistance of thick composite laminates. In this case, a structure contains impact damage, it is relevant to assess whether and under what limitations it may continue to function as designed. This is especially crucial for thick composite laminates, which are used in primary structures. As compression is a critical load case, the residual CAI strength has been determined as explained in the Compression-after-impact tests section. A detailed analysis of the failure mechanisms is included and the residual CAI strengths are compared to the undamaged compressive strength.
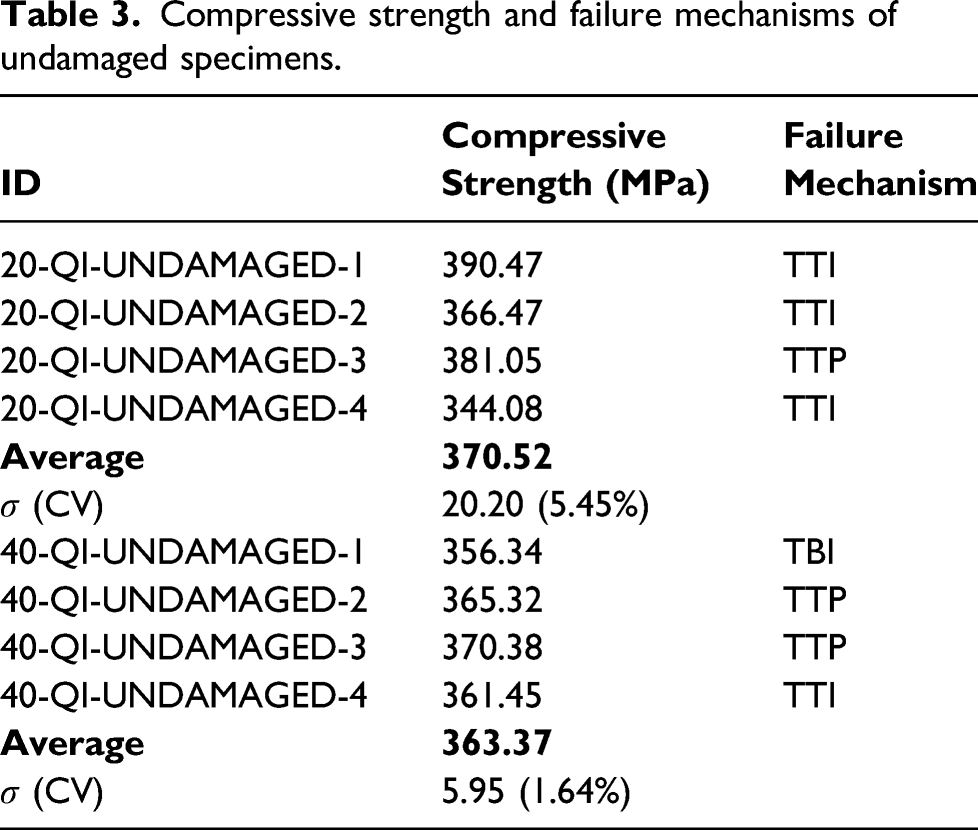
The resulting compressive strengths are visualised in Figure 17. Exact values of the residual CAI strengths can be found in Table A4, while the compressive strengths of undamaged specimens are given in Table 3. As expected, the residual CAI strength is closely related to the delaminated area and damage depth. For instance, specimens subjected to a 100 J gas-cannon impact have the highest delaminated area and therefore the largest reduction in residual CAI strength (i.e. 12% and 18%). In addition, the effect of both gas-cannon and drop-weight impacts is larger on the residual CAI strength of 20 mm specimens compared to the 40 mm impacted specimens. For the 20 mm specimens with gas-cannon impacts, this is explained by larger delaminations that appear deeper in the specimen. For the 20 mm specimens, with drop-weight impacts, the gap with 40 mm specimens is larger, with no significant change in delaminated area. A possible explanation is that the delaminations are approximately 25% deeper for 20 mm specimens. Deeper delaminations mainly affect the sub-laminate bending stiffness, which results in failure at a lower load. Compressive strength for 20 and 40 mm specimens subjected to LM drop-weight impacts and SM gas-cannon impacts. Note: LM: large-mass; SM: small-mass. Compressive strength and failure mechanisms of undamaged specimens.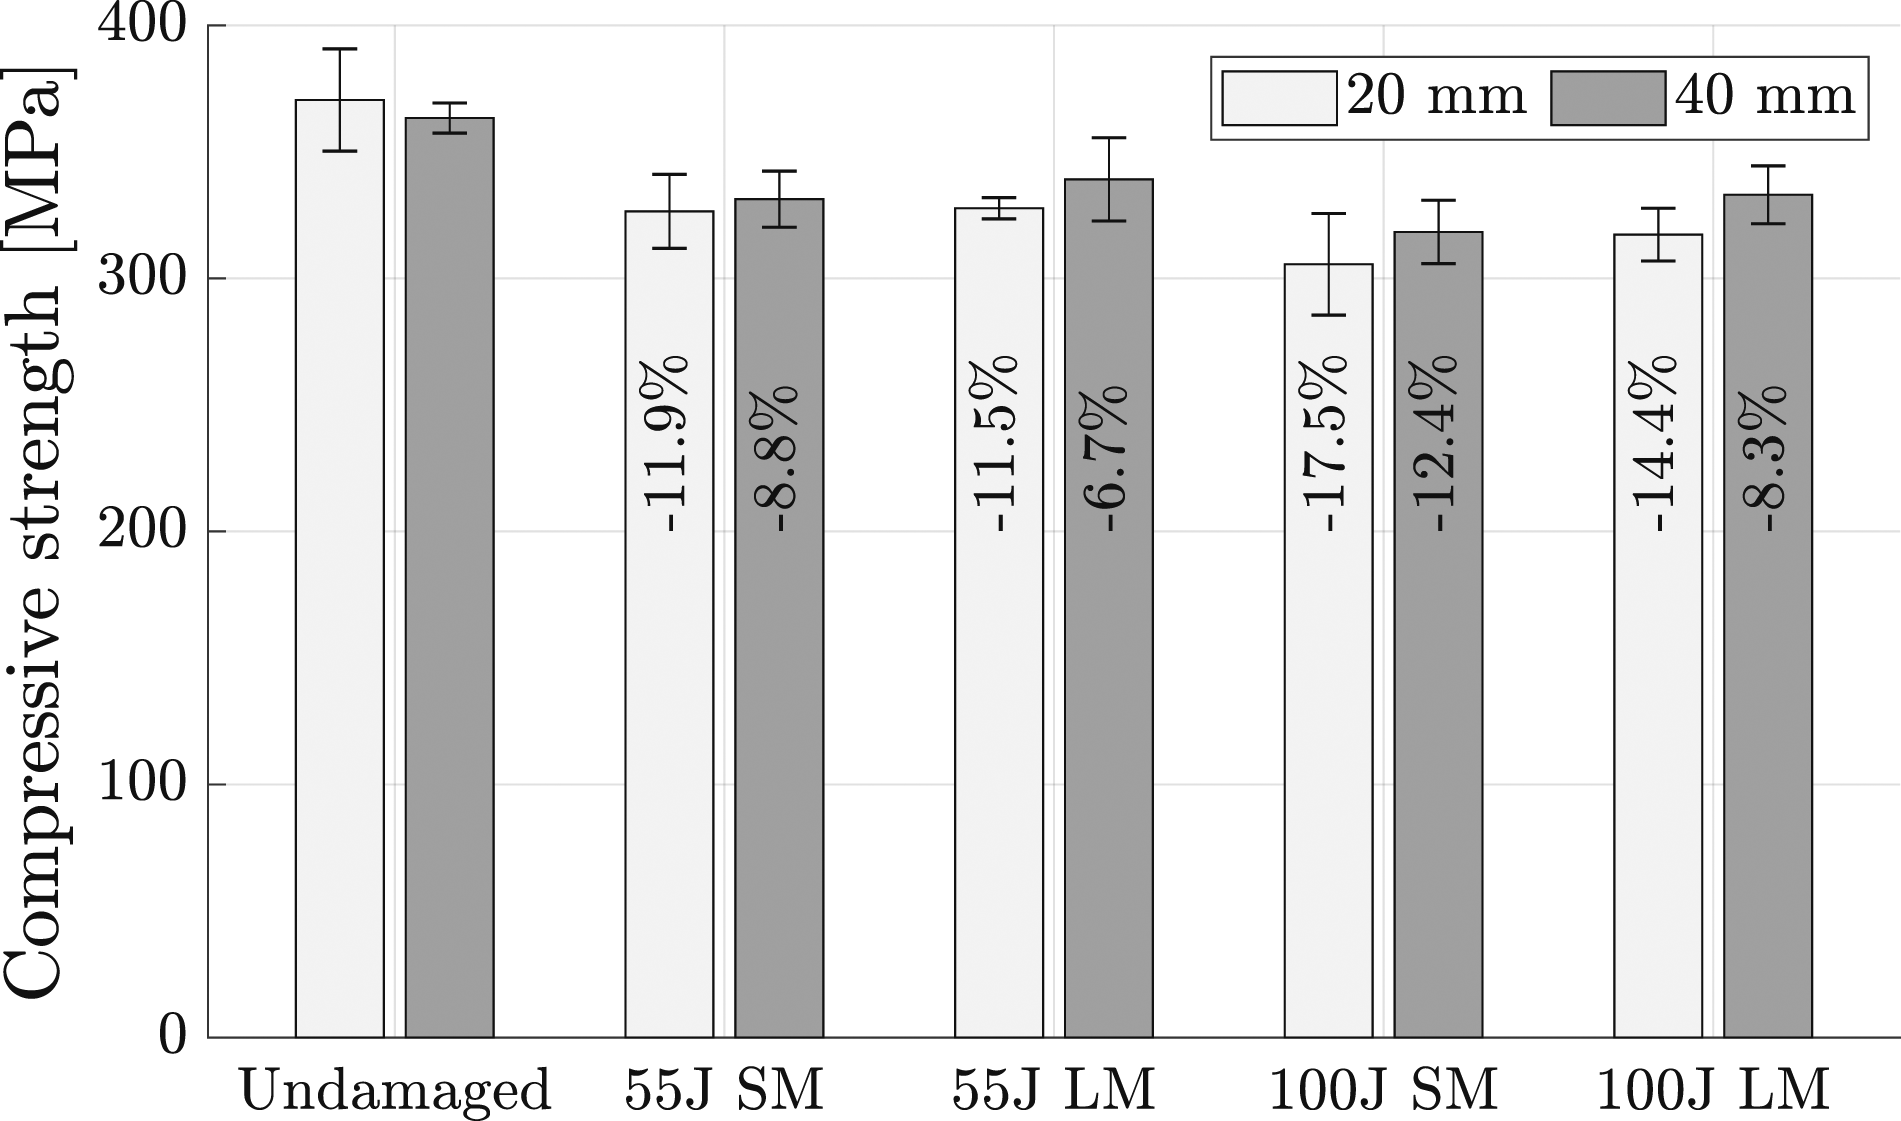
The failure mechanisms have been recorded with two high-speed cameras, capturing the impact side and non-impact side. As a result, a detailed analysis of the involved mechanisms is possible. The failure mechanisms observed are illustrated in Figure 18. The failure mechanisms are categorised based on the location of sub-laminate buckling. Depending on the location where buckling initiates, the failure is identified with a letter as follows: T for top, M for middle and B for bottom. This is recorded for each side of the specimen separately, so TT indicates that buckling initiated at the top of the specimen on both sides. Similarly, MT indicates that buckling initiated in the middle on one side and at the top on the other side. By convention, the first letter refers to the side of the specimen that was previously damaged by impact. Due to the absence of global buckling, these damage mechanisms are usually not observed in CAI tests on thin composite specimens. For instance, in addition to the in-plane behaviour, the through-thickness behaviour is equally important for thick composite specimens. Failure mechanisms observed during the CAI tests with buckling of sub-laminates at the middle (M), top (T) or bottom (B) of the specimen. Distinction is made between symmetric failure (MM and TT) and asymmetric failure (MT, MB and TB). Note: CAI: compression-after-impact.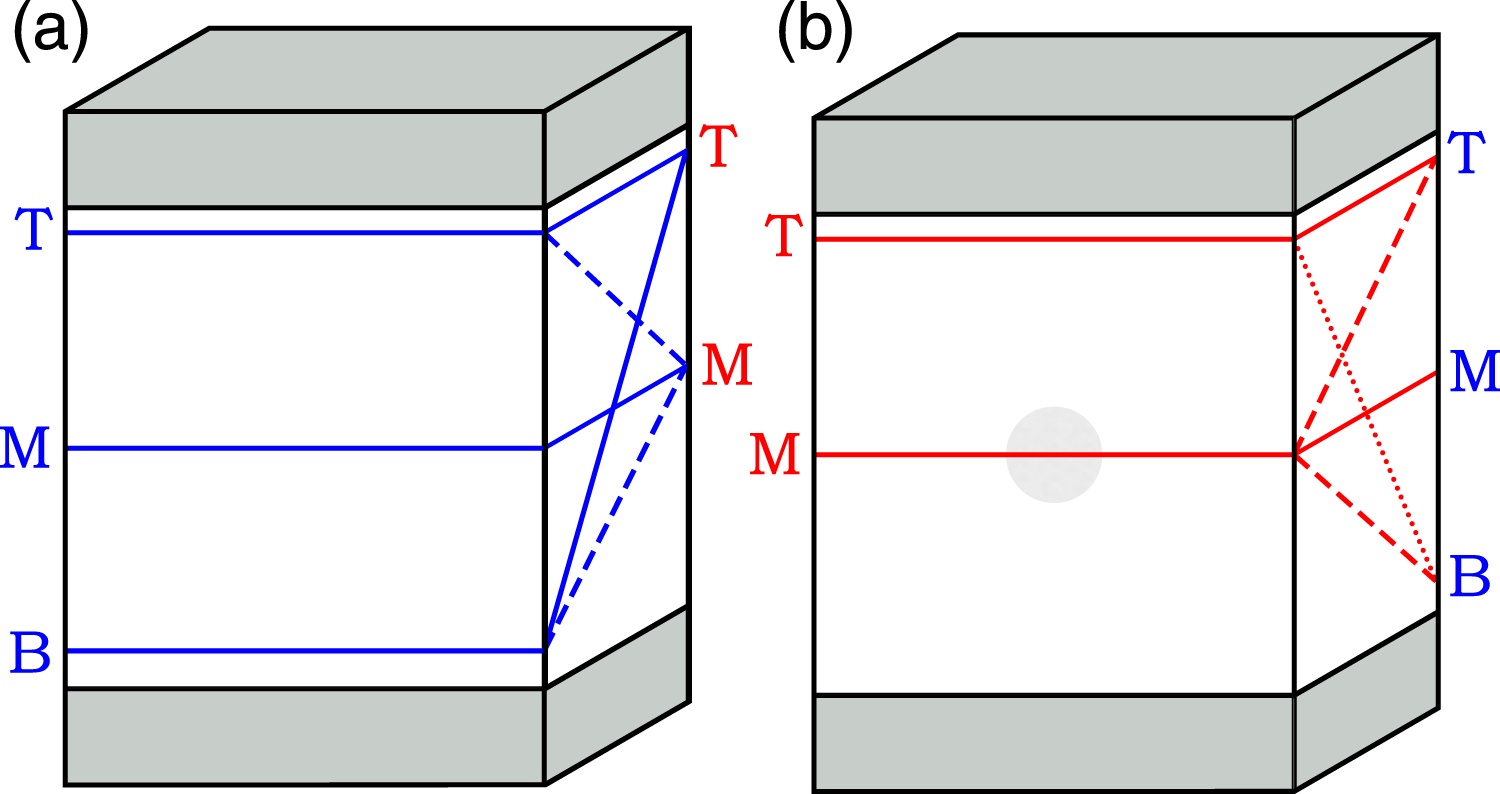
Symmetric failure (MM and TT) occurs when delaminated plies start to buckle at approximately the same location on the impact and non-impact side of the specimen. As a result, the through-thickness damage pattern is also symmetric and usually horizontal, with variations that have a
Asymmetric failure (MT, MB and TB) occurs when sub-laminate buckling of delaminated plies occurs at a different location on the impact side and non-impact side. For instance, the most common case is an MT failure mechanism observed in 45% of specimens. In this mechanism, the impact side sub-laminate buckling occurs in the middle (M) and on the non-impact side at the top of the specimen (T). Sub-laminate buckling generally starts at the impact side. During progressive failure, the cracks in the thickness direction propagate to the location of sub-laminate buckling on the other side. Asymmetric MB and TB failure is observed in two specimens for each mechanism.
In addition to the symmetric and asymmetric failure mechanisms, a distinction is made between progressive (P) and instant (I) failure. Progressive failure describes the case when one or multiple delaminations and corresponding load drops occur prior to final failure. On the other hand, instant failure gives no indication of damage prior to failure and no significant load drops are visible in the stress-strain curve. Overall, 20 specimens showed progressive failure and 18 specimens instant failure.
As mentioned, most specimens show the MT asymmetric failure mechanism. In this case, a sub-laminate at the impact side starts to buckle in the middle due to the impact damage. In absence of these sub-laminates, the compressive load could be off-centre with respect to the intact part of the specimen. As a result, the test bench loading plate slightly tilts, causing a bending moment that introduces damage close to the anti-brooming device at the top. At final failure, this results in through-thickness fracture from the middle to the top of the specimen. Due to the absence of sub-laminate buckling, the undamaged specimens generally show a TT symmetric failure mechanism. Despite a distinction in failure mechanisms, there is no clear correlation with the residual strength.
An example of a CAI test is illustrated in Figure 19. A 40 mm thick specimen subjected to a 55 J drop-weight impact shows progressive damage of category MMP. It is observed that it takes a while for the stress–strain curve to align with the stiffness slope, which indicates that the test bench and specimen are settling. The slope of the stress–strain (i.e. compressive stiffness) originates from the centre and is used to align the stress–strain curve. A compressive stiffness of 25.9 GPa is approximately 50% lower than the undamaged compressive stiffness and comparable discrepancies are observed for the other specimens. Only a part of this difference is explained by the impact damage. For instance, specimen 40-QI-LM-55-4 in Figure 19 has a damage depth of 4 mm, which is approximately 10% of the specimen thickness. The apparent stress, and thus compressive stiffness, should only be 10% higher if it is assumed that this 4 mm of the specimen does not bear any load. The main reason is that due to high compressive forces the steel support of the test bench started to indent, resulting in additional displacement measured by the LVDTs. Since a measured compressive stiffness has no effect on the residual strengths the values obtained are still valid. CAI test of a 40 mm thick specimen subjected to a 55 J drop-weight impact (40-QI-LM-55-4) with in (a) the stress-strain curve and detail view of progressive sub-laminate buckling (b)–(d) leading to (e) final failure with a MMP failure mechanism. Note: CAI: compression-after-impact; LM: large-mass; SM: small-mass.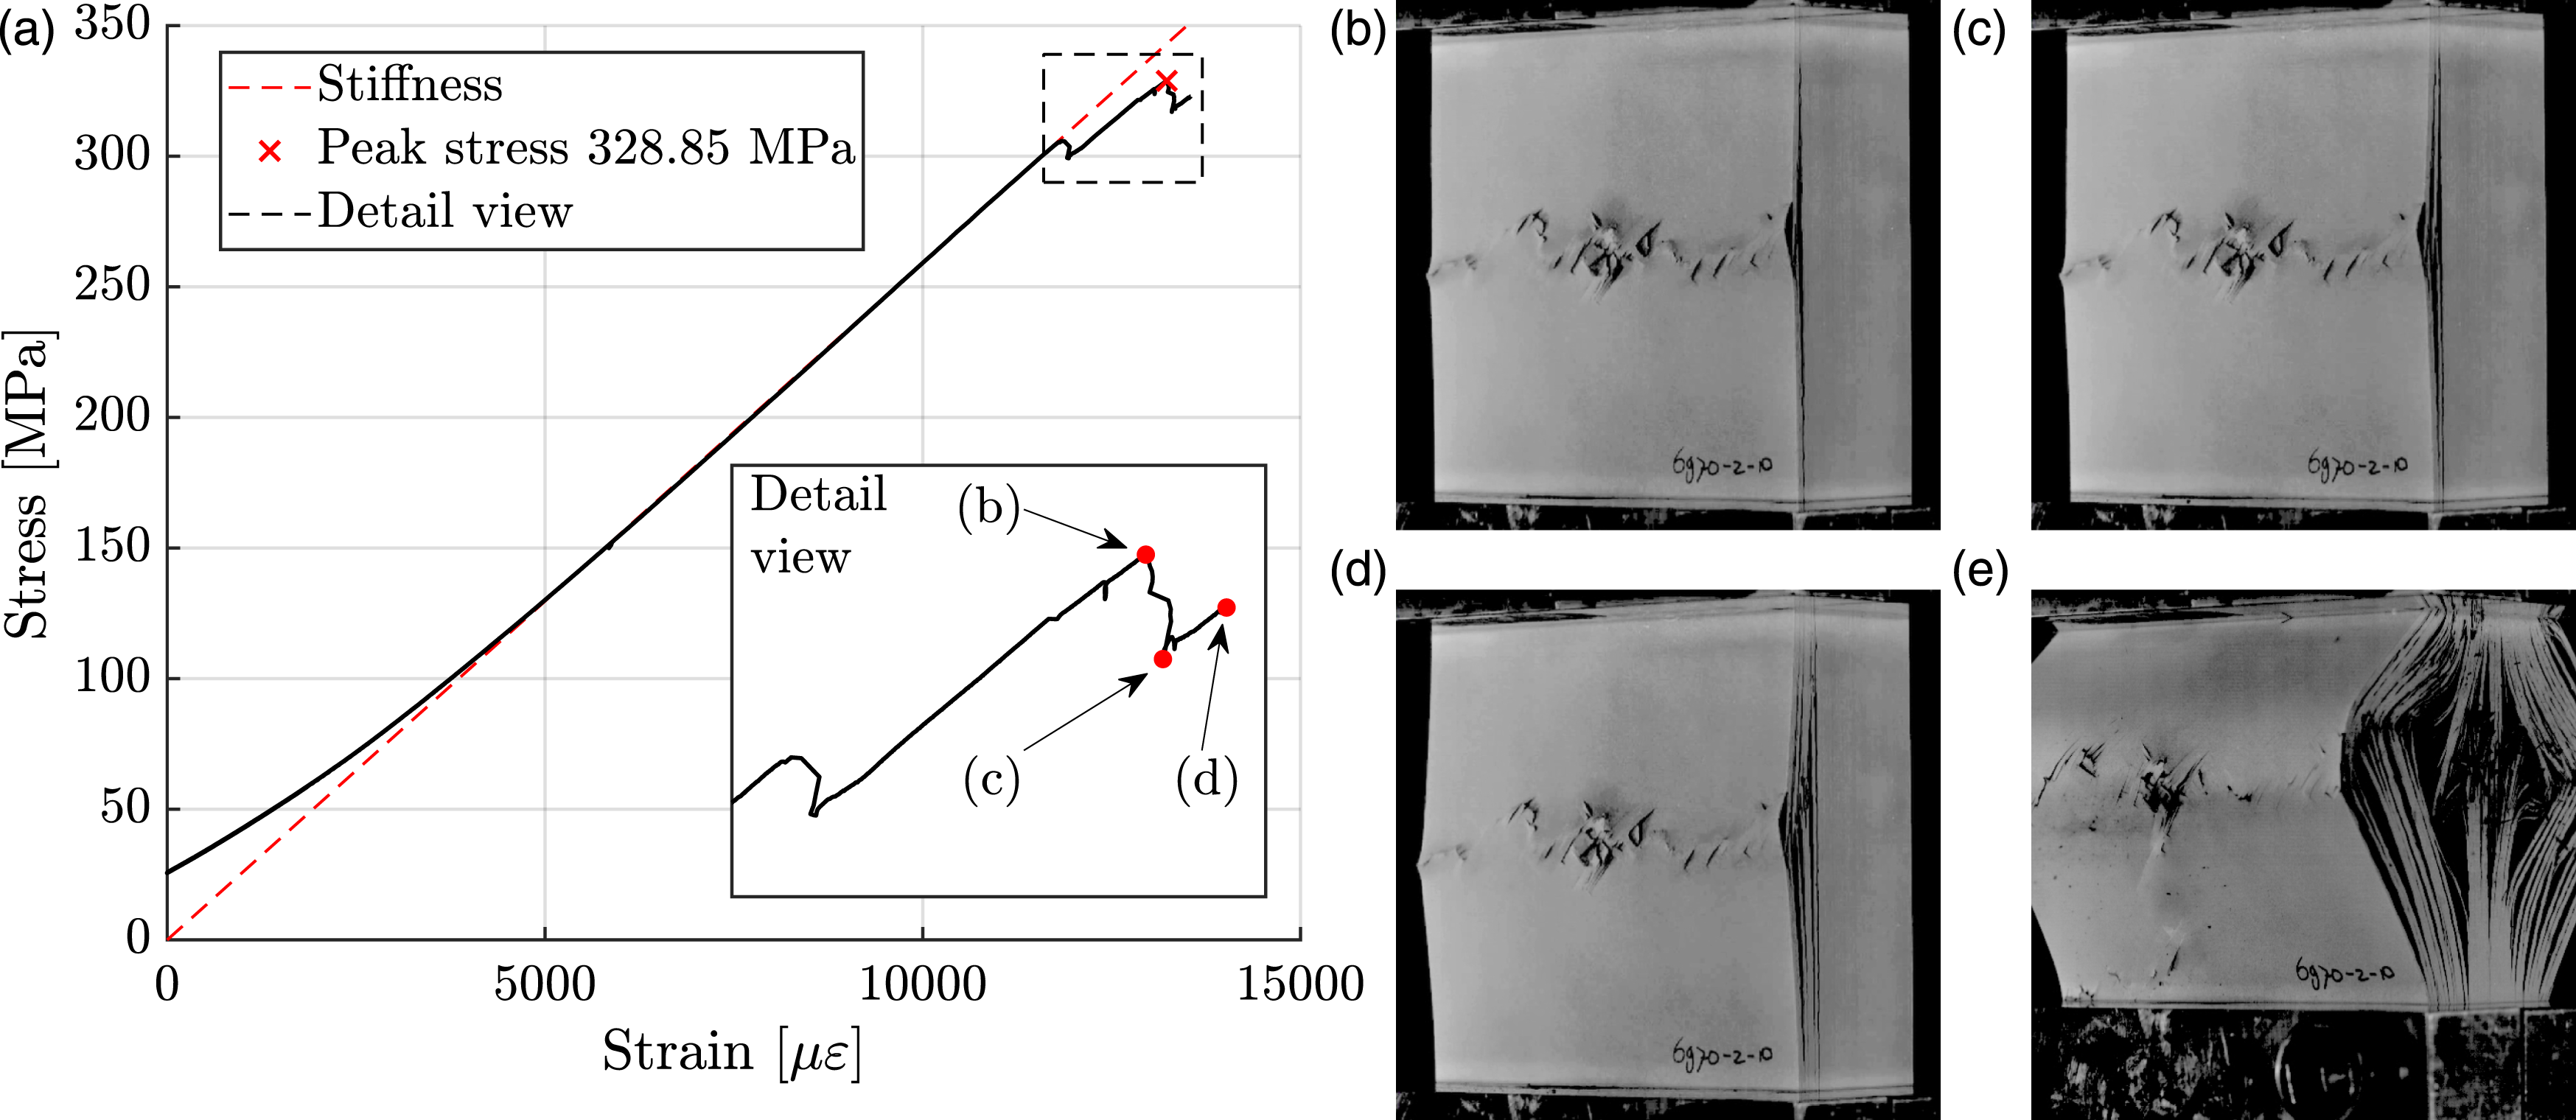
From the detailed view in Figure 19(a), it is observed that multiple events occur prior to final failure. The first load drop at 1205 kN indicates propagation of one or multiple delamination(s) and subsequent sub-laminate buckling. This propagated delamination is present when the specimen reaches its peak strength, visualised in Figure 19(b). A second load drop of 47 kN occurs due to a second delamination that propagates, see Figure 19(c). Between this point and the point illustrated in Figure 19(d), a third delamination propagates, after which final failure occurs. Despite multiple delaminations, the specimen is able to carry an increasing load.
Summary and conclusions
Motivated by the limited availability of experimental impact data for thick fabric composite laminates, an experimental program has been carried for two representative energy levels. Detailed results were obtained regarding the resulting impact damage and global impact response. Together with the variations in test instances, a valuable experimental data set is obtained suitable for validation of impact damage and CAI models. In addition, the results allow for observations that lead to the following conclusions: 1. Due to lower bending stiffness, thinner specimens (20 mm) with a larger thickness ratio, show a larger impactor displacement and a smaller dent depth compared to thicker specimens (40 mm) (lower thickness ratio). For the gas-cannon impacts, increased oscillations lead to significantly higher delaminated area being observed (48–69%), while drop-weight impacts show no change. 2. Impacts on orthotropic (OT) specimens show a smaller dent and larger delaminated area. For drop-weight impact on OT specimens, the decrease in dent depth is similar to the increase in delaminated area. Gas-cannon impacts show a small increase in delaminated area (4%) but a dent decrease of 37%. 3. For an increasing impactor energy, drop-weight impacts show a higher increase in dent depth compared to gas-cannon impacts. On the other hand, the increase in delaminated area is smaller for drop-weight impacts. This indicates that drop-weight impacts favour dent depth creation and gas-cannon impacts favour energy dissipation through delaminations. In addition, thick specimens are less affected by the increase in impactor energy compared to thin specimens. 4. 45% of the specimens show a compression-after-impact failure mechanism that initiates with sub-laminate buckling at the impact location that propagates to sub-laminate buckling at the top back of the specimen. 5. For the impact energies in this test campaign, the effect on residual strength is minimal (i.e. 6.7–17.5%) with the largest impact on 20 mm specimens. 6. The characteristic impact damage pattern of a thick fabric composite consists of a surface dent and a ‘hat-shaped’ internal damage where, in the top plies, at approximately one impactor radius distance, fibre kinking occurs in combination with ply buckling. Delaminations mainly occur above warp yarns and show interaction with transverse cracks.
Footnotes
Acknowledgments
The authors thank Fokker Landing Gear for providing the material required for the manufacturing of the specimens. This work was not possible without the testing department of NLR. Special thanks to Jordi Katarzynski for the drop-weight experiments, Royd Postma for the gas-cannon experiments, Hans Faber for the camera work, Ton van den Belt for the CAI experiments, Jacco Platenkamp and Arnoud Bosch for the NDI, and René Vermeulen for the cross-sections.
Declaration of conflicting interests
The author(s) declared no potential conflicts of interest with respect to the research, authorship, and/or publication of this article.
Funding
The author(s) disclosed receipt of the following financial support for the research, authorship, and/or publication of this article: This work is part of a PhD research program supported by the Royal Netherlands Aerospace Centre in collaboration with Delft University of Technology.
A Complete overview of impacted specimens
The table in the Appendix contains data of each specimen, including an identification number in a format that specifies the thickness, Quasi-Isotropic (QI) or OrthoTropic (OT) layup, small-mass (SM) gas-cannon or large-mass (LM) drop-weight, impact energy, and specimen number. For specimen 20-QI-SM-100-4 no impact response data is available due to missing high-speed images. In addition, drop-weight test 40-QI-LM-100-3 failed and has been excluded from the results. Complete overview of the measured impact damage in terms of dent depth and internal damage including the average, standard deviation (σ), and Coefficient of Variation (CV). In addition, the residual CAI strengths and corresponding failure mechanisms are included. Note that the highlighted cells are not included in the average due to a failed test or missing data.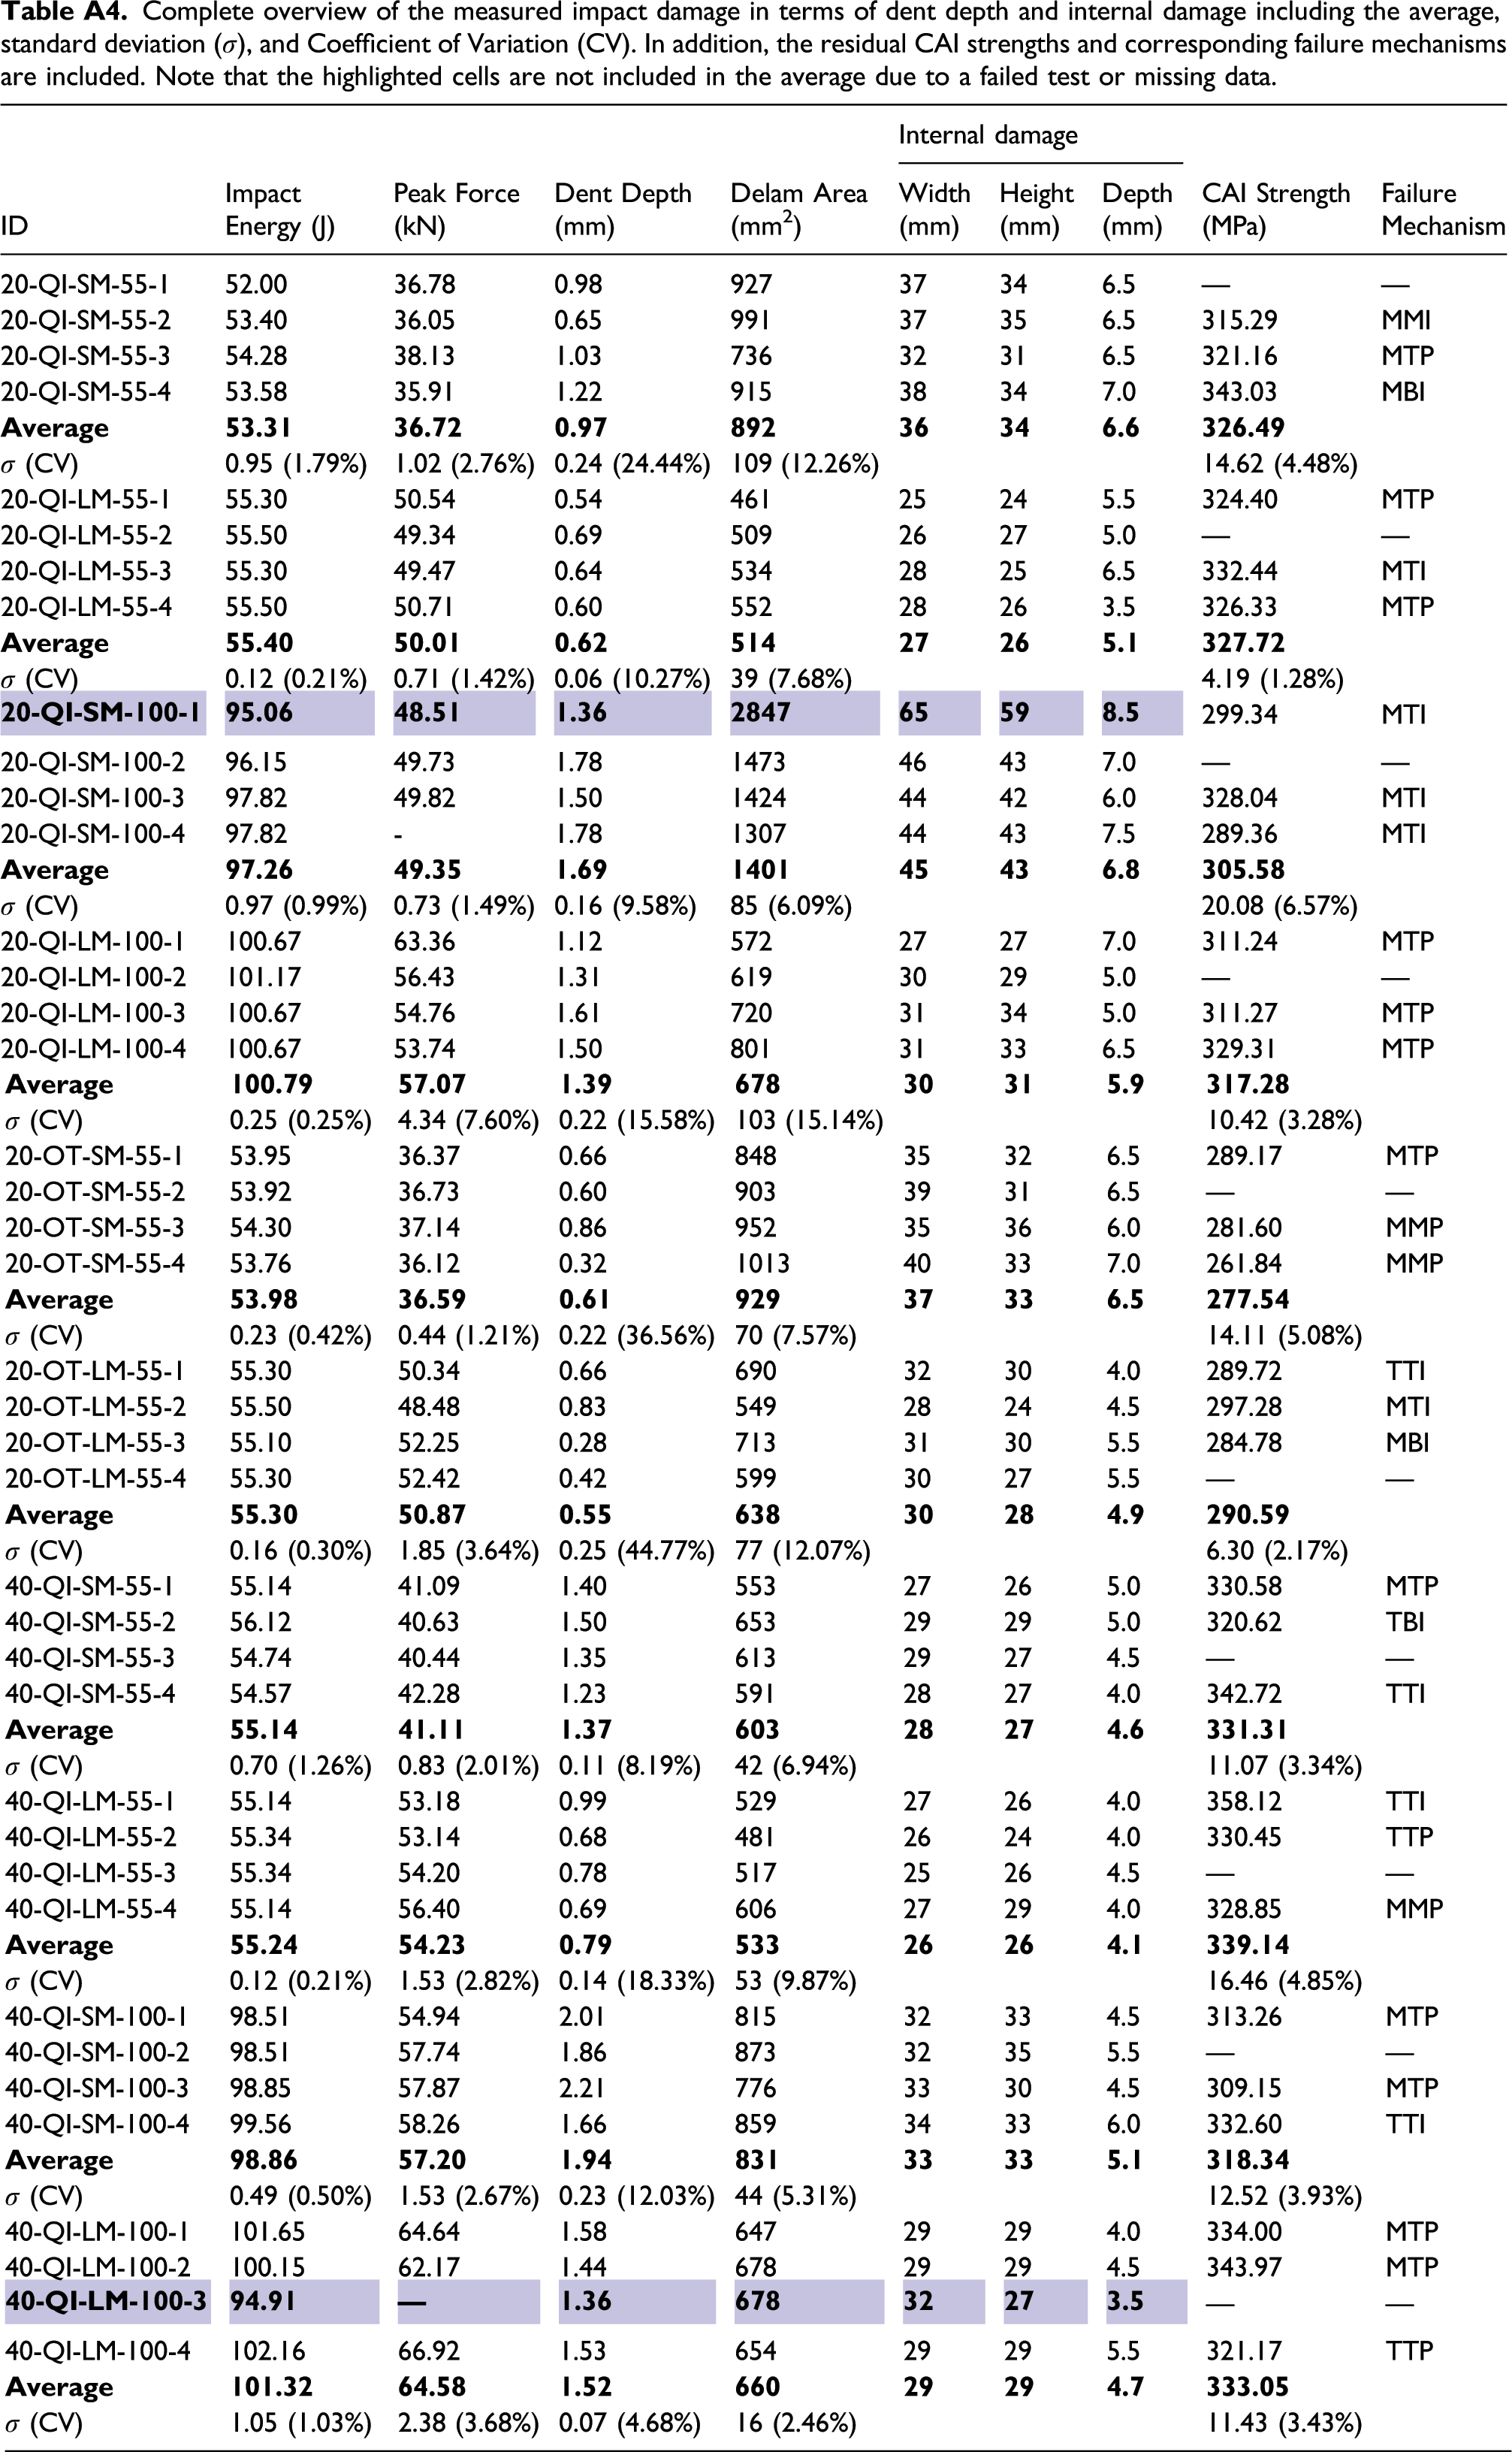
Internal damage
ID
Impact Energy (J)
Peak Force (kN)
Dent Depth (mm)
Delam Area (mm2)
Width (mm)
Height (mm)
Depth (mm)
CAI Strength (MPa)
Failure Mechanism
20-QI-SM-55-1
52.00
36.78
0.98
927
37
34
6.5
—
—
20-QI-SM-55-2
53.40
36.05
0.65
991
37
35
6.5
315.29
MMI
20-QI-SM-55-3
54.28
38.13
1.03
736
32
31
6.5
321.16
MTP
20-QI-SM-55-4
53.58
35.91
1.22
915
38
34
7.0
343.03
MBI
σ (CV)
0.95 (1.79%)
1.02 (2.76%)
0.24 (24.44%)
109 (12.26%)
14.62 (4.48%)
20-QI-LM-55-1
55.30
50.54
0.54
461
25
24
5.5
324.40
MTP
20-QI-LM-55-2
55.50
49.34
0.69
509
26
27
5.0
—
—
20-QI-LM-55-3
55.30
49.47
0.64
534
28
25
6.5
332.44
MTI
20-QI-LM-55-4
55.50
50.71
0.60
552
28
26
3.5
326.33
MTP
σ (CV)
0.12 (0.21%)
0.71 (1.42%)
0.06 (10.27%)
39 (7.68%)
4.19 (1.28%)
299.34
MTI
20-QI-SM-100-2
96.15
49.73
1.78
1473
46
43
7.0
—
—
20-QI-SM-100-3
97.82
49.82
1.50
1424
44
42
6.0
328.04
MTI
20-QI-SM-100-4
97.82
-
1.78
1307
44
43
7.5
289.36
MTI
σ (CV)
0.97 (0.99%)
0.73 (1.49%)
0.16 (9.58%)
85 (6.09%)
20.08 (6.57%)
20-QI-LM-100-1
100.67
63.36
1.12
572
27
27
7.0
311.24
MTP
20-QI-LM-100-2
101.17
56.43
1.31
619
30
29
5.0
—
—
20-QI-LM-100-3
100.67
54.76
1.61
720
31
34
5.0
311.27
MTP
20-QI-LM-100-4
100.67
53.74
1.50
801
31
33
6.5
329.31
MTP
σ (CV)
0.25 (0.25%)
4.34 (7.60%)
0.22 (15.58%)
103 (15.14%)
10.42 (3.28%)
20-OT-SM-55-1
53.95
36.37
0.66
848
35
32
6.5
289.17
MTP
20-OT-SM-55-2
53.92
36.73
0.60
903
39
31
6.5
—
—
20-OT-SM-55-3
54.30
37.14
0.86
952
35
36
6.0
281.60
MMP
20-OT-SM-55-4
53.76
36.12
0.32
1013
40
33
7.0
261.84
MMP
σ (CV)
0.23 (0.42%)
0.44 (1.21%)
0.22 (36.56%)
70 (7.57%)
14.11 (5.08%)
20-OT-LM-55-1
55.30
50.34
0.66
690
32
30
4.0
289.72
TTI
20-OT-LM-55-2
55.50
48.48
0.83
549
28
24
4.5
297.28
MTI
20-OT-LM-55-3
55.10
52.25
0.28
713
31
30
5.5
284.78
MBI
20-OT-LM-55-4
55.30
52.42
0.42
599
30
27
5.5
—
—
σ (CV)
0.16 (0.30%)
1.85 (3.64%)
0.25 (44.77%)
77 (12.07%)
6.30 (2.17%)
40-QI-SM-55-1
55.14
41.09
1.40
553
27
26
5.0
330.58
MTP
40-QI-SM-55-2
56.12
40.63
1.50
653
29
29
5.0
320.62
TBI
40-QI-SM-55-3
54.74
40.44
1.35
613
29
27
4.5
—
—
40-QI-SM-55-4
54.57
42.28
1.23
591
28
27
4.0
342.72
TTI
σ (CV)
0.70 (1.26%)
0.83 (2.01%)
0.11 (8.19%)
42 (6.94%)
11.07 (3.34%)
40-QI-LM-55-1
55.14
53.18
0.99
529
27
26
4.0
358.12
TTI
40-QI-LM-55-2
55.34
53.14
0.68
481
26
24
4.0
330.45
TTP
40-QI-LM-55-3
55.34
54.20
0.78
517
25
26
4.5
—
—
40-QI-LM-55-4
55.14
56.40
0.69
606
27
29
4.0
328.85
MMP
σ (CV)
0.12 (0.21%)
1.53 (2.82%)
0.14 (18.33%)
53 (9.87%)
16.46 (4.85%)
40-QI-SM-100-1
98.51
54.94
2.01
815
32
33
4.5
313.26
MTP
40-QI-SM-100-2
98.51
57.74
1.86
873
32
35
5.5
—
—
40-QI-SM-100-3
98.85
57.87
2.21
776
33
30
4.5
309.15
MTP
40-QI-SM-100-4
99.56
58.26
1.66
859
34
33
6.0
332.60
TTI
σ (CV)
0.49 (0.50%)
1.53 (2.67%)
0.23 (12.03%)
44 (5.31%)
12.52 (3.93%)
40-QI-LM-100-1
101.65
64.64
1.58
647
29
29
4.0
334.00
MTP
40-QI-LM-100-2
100.15
62.17
1.44
678
29
29
4.5
343.97
MTP
—
—
40-QI-LM-100-4
102.16
66.92
1.53
654
29
29
5.5
321.17
TTP
σ (CV)
1.05 (1.03%)
2.38 (3.68%)
0.07 (4.68%)
16 (2.46%)
11.43 (3.43%)