
Abstract
The Nantong blue calico pattern is a significant and indispensable part of China’s intangible cultural heritage, representing an artistic form of weaving and dyeing. However, existing research on blue calico patterns is not extensive, and few studies have focused on the construction of a database categorizing them or on recognizing the Nantong blue calico pattern. Obtaining good efficiency and accuracy through manual recognition has been the primary challenge in recognizing the Nantong blue calico pattern. In light of these challenges, this study proposes the use of deep learning network model to intelligently classify and recognize blue calico patterns.First, the patterns are classified to establish a Nantong blue calico pattern database, and the corresponding category labels are then manually assigned to each image. Second, based on the database and a backbone feature extraction network, the abilities of SSD (Single Shot Multibox Detector), Faster RCNN (Region-CNN), and You Only Look Once (to recognize the Nantong blue calico pattern were compared. The results show that the SSD model based on a VGG (Visual Geometry Group) backbone network has the best recognition accuracy of these three algorithms, with an average accuracy of 79.42%. On this basis, we selected the SSD model for parameter optimization and adjustment, and we replaced the backbone with mobilenetv2, a lighter backbone extraction network, to recognize the Nantong blue calico pattern. The results show that compared with the original SSD model, the optimized SSD model can improve the pattern recognition rate of Nantong blue calico pattern. Furthermore, this paper makes use of the characteristics of the VGG deep network, the backbone network of the SSD model, to efficiently extract the features of blue calico patterns, which provides a basis for designers to design innovative blue calico patterns.
Introduction
Nantong blue calico printing is a traditional handicraft from Jiangsu Province, China, with a history of over 1300 years, 1 making it one of the oldest methods for producing fabric patterns. 2 This pattern has immense cultural significance and was added to China’s intangible cultural heritage list in 2008. The rich history and cultural importance of Nantong blue calico makes its preservation and protection crucial, and intelligent technology can be of great help in this regard.
Several studies on traditional textile patterns have proposed using intelligent convolutional neural network (CNN) models to effectively extract and classify the primitive elements of various patterns. For instance, Jia and Liu 3 proposed an intelligent CNN called CalicoNet, which was designed to extract and classify the primitive elements of the blue calico pattern. When comparing this model with other complex CNN models, CalicoNet achieved the highest verification accuracy on the validation set. Zhang et al. 4 introduced the deep Inception-v4 deep CNN model for classifying Miao embroidery patterns, and then fine-tuned the model to improve its performance compared to the BoW, FV, and VLAD depth models. Juan 5 proposed a two-layer model algorithm for embroidery feature recognition and compared it with two other algorithms. The results showed that the proposed algorithm could accurately identify geometric patterns. The model accuracy was also higher compared to the other two algorithms. Sun et al. 6 introduced a visual interaction framework based on virtual reality for classifying the totem patterns of national clothing. The framework achieved a recognition rate of 89.3%, which was higher than the recognition rates of the Bayesian and the k-nearest neighbor classifiers. Zhou et al. 7 proposed DenseNet 201, a DenseNet-based clothing image classification method, and optimized the network model by pruning the model parameters and introducing a regularization coefficient. The optimized RVFL was then used to classify clothing image features. Compared with ResNet50, ResNet101, Density Net 201, and InceptionV3, the classification performance of the proposed algorithm was proven. Zhang and Zhou 8 proposed the RVFL algorithm, which used a random vector function to classify the color differences of dyed fabrics. An improved HGS algorithm was used to optimize the RVFL’s ability to classify different colors of dyed fabrics, and it was then compared with other advanced algorithm models; the results showed that the algorithm had a strong classification performance. Zhou et al. 9 proposed a random vector optimization model based on a Salp Swarm Algorithm improved through Antlion optimization, and they used it to objectively evaluate the degree of wrinkling in fabric. In this manner, they were able to rectify the low efficiency and inaccurate classification of fabric wrinkles using human eyes. Li et al. 10 proposed a new color difference classification model for dyed fabrics based on a kernel extreme learning machine that was in turn based on an improved grasshopper optimization algorithm. Thus, the kernel of differential evolution optimization algorithm was proposed. The results showed that the classification accuracy of this extreme learning machine model was high and that traditional color difference detection using intelligent technology often has low efficiency and results in mistakes being made. Qian et al. 11 developed an embroidery-style rendering method based on the CNN model, transferring embroidery features to content images through semantic segmentation, color space transfer, style transfer, and embroidery features. The experimental results show that the method is efficient and feasible. Kuo et al. 12 proposed an image analysis system that successfully achieved the separation of color and region, proving itself to be effective for color embroidery images with repeated and non-repeated patterns. Shih et al. 13 developed an automatic analysis system for tatami embroidery fabric images that could accurately extract the color, shape, and textural features of tatami embroidery fabric. As an intelligent technology in modern image processing, deep learning has not been widely studied in the application of Nantong blue calico. Therefore, the focus of this research is on applying a deep learning model to the classification and feature extraction of traditional Nantong blue calico patterns. At the same time, the selected model is optimized to enhance the work of making Nantong blue calico patterns, providing a basis for designers to use blue calico patterns in their work.
A large amount of research has been conducted on the problems associated with the deep learning algorithm models used in image recognition. As advanced deep learning algorithms, the Faster-Faster RCNN structure, VGG structure, and You Only Look Once (YOLO)v8 network structure have been widely used in various fields. Chiu et al. 14 used channel pruning technology to compress and prune the modified YOLOv5s model, and their results showed that it had a good recognition effect on a trash can dataset. Gao et al. 15 developed a partial segmentation method for Chinese characters based on Faster-Faster RCNN in which the proposed adhesion and overlapping component method provided accurate segmentation outcomes. The retrieval system accurately retrieved components, with the average accuracy reaching 95.7%, proving that the proposed method was effective. Chen et al. 16 combined a Faster-Faster RCNN deep learning network with the improved ResNet50 for welding defect detection. The proposed algorithm combined a deformable network, the FPN (Feature Pyramid Network), and ResNet50, resulting in an average accuracy improvement of 4.8%. Furthermore, Sharma and Mir 17 proposed a model known as saliency-guided Faster R-CNN for object detection and recognition using computer vision methods. They compared their model with current methods in terms of average accuracy, and found that the proposed strategy yielded significantly better results when compared to existing methods. Xiang et al. 18 introduced an improved Faster-Faster RCNN model for detecting birds in natural scenes. The improved Faster-Faster RCNN model exhibited a better mean average precision (mAP) and F1 score, achieving 89.0 mAP on a bird dataset. Yang et al. 19 used the improved VGG16 to identify and classify peanut varieties, achieving an average test accuracy of 96.7% on the training test results, which was higher than that of the original VGG16 model. Ye et al. 20 modified the network model based on VGG-16 and combined it with traditional full convolution to fine-tune the decoding part of the original network. Their subsequent experiments showed that the model’s accuracy in remote sensing image classification was more than 98%, which is suitable for remote sensing images with ultra-low pixel values or fewer feature points. Hong et al. 21 used transfer learning to pre-train the VGG16 network and constructed a facial recognition model based on the VGG16 architecture. Their results showed that the VGG16 recognition model achieved a high accuracy, specificity, recall rate, F1 score, and GS screening. The area below the receiver operating characteristic curve value was superior to that of human experts. Ding et al. 22 discussed applying various deep learning strategies based on the VGG16 CNN model for gesture-based identity recognition. The experimental results showed that the proposed centroid from the principal component analysis offered better recognition accuracy and calculation time in gesture-based identity recognition. Li and Niu 23 improved the VGG-16 network by changing its framework structure and conducted face feature extraction experiments based on the Labeled Faces in the Wild dataset, which improved the network’s ability to achieve good image accuracy and sensitivity while realizing single feature extraction. Wu and Dong 24 introduced a new YOLO-SE network based on YOLOv8 for remote sensing image detection and proposed an SEF enhancement module based on SEConv that obtained 94.9% accuracy in detecting objects of different scales and accurately locating small targets. Chen et al. 25 proposed a non-invasive image enhancement technology that combined wavelet threshold denoising, image standardization, bilateral filtering, and Laplace sharpening. The optimized YOLOv8 model could successfully recognize images of internal cracks in Zhengdan 958 corn seeds, effectively solving problems such as the limited transmission of light through corn seeds, the difficulty of crack location, and algorithm generalization. The average accuracy of the optimized YOLOv8 model was 3.1% higher than that of the original model.
Aerial image detection and pattern image recognition have to deal with the same problems in that they must be able to detect small and complex targets. Li et al. 26 proposed an aerial image detection model with excellent performance and strong robustness. Combined with a dynamic non-monotonous focusing mechanism, the “outlier value” was used to evaluate the quality of the anchor box, ensuring that the detector could consider an anchor box with different qualities and thereby improve its overall performance. These results showed that the model had clear advantages in various experiments.
Currently, image recognition technology using convolutional neural networks is relatively advanced. Numerous studies have worked toward upgrading and optimizing existing algorithm models in the pursuit of higher recognition effects. Tian 27 proposed a new algorithm that introduced a recurrent neural network to construct a new residual module and establish a double optimization model to improve the model’s convergence speed and recognition accuracy. Simulation experiments showed that the proposed algorithm could learn different image features and improve its feature extraction and recognition capabilities. Zhang et al. 28 proposed an algorithm that uses a recurrent neural network, a new residual module, and a double optimization model to learn the image diverse features of images. This algorithm was shown to be able to improve CNNs’ feature extraction accuracy and image recognition ability. Furthermore, Li et al. 29 introduced a new network structure, the residual wide network (R-WN), based on wider modules and residual modules to fully use image information and learn richer functions. In image recognition, R-WN outperformed four classical data open sets: MNIST, CIFAR10, SVHN, and Oxford Flowers 17. Zhu et al. 30 developed a new pooling method, called weighted pooling, that calculated the weight of each activation in the pooling area based on mutual information. The experimental results showed that this method had higher recognition accuracy than other traditional pooling methods. In addition, Singh et al. 31 comprehensively summarized the latest progress in stereo vision recognition using CNN. They concluded that the multi-view-based method provided higher accuracy and required less GPU memory than the volume method. Liu et al. 32 advanced a new cross-layer strategy, establishing a convolutional layer between two non-adjacent levels in the network. The experimental results showed that the cross-layer technique improved the classification performance of existing neural networks for image classification. Zhang et al. 33 designed a new architecture, Hybrid CNN, for sketch recognition. This architecture can learn appearance and shape and has been shown to have a higher accuracy than the most advanced sketch recognition methods.
Deep learning models have been widely used in many fields. However, few studies have focused on exploring the recognition of static and complex small targets, such as those in traditional clothing pattern recognition. Three deep learning models based on different backbone feature networks were used to identify Nantong blue calico patterns in this study. The best algorithm was then selected, and it was subsequently upgraded and optimized to achieve the highest accuracy possible in the recognition; this also helped solve the problems of low efficiency and accuracy in the manual recognition and classification of these patterns.
Methods
Faster RCNN
Figure 1 depicts the Faster RCNN network structure, showing that the input image of size P × Q on the far left is first resized to M × N. Then, the M × N image is fed into the network. A feature map is obtained after a series of convolution and pooling operations, after which a Region Proposal Network (RPN) performs 3 × 3 convolution. It then generates positive anchors and corresponding bounding box regression offsets to compute proposals. The region of interest (ROI) pooling layer collects the feature map data and sends it to the fully connected layer to determine the target category.

Faster RCNN network structure.
The development of Faster RCNN had a massive impact on object detection because RPNs could replace the original selective search algorithm to obtain ROIs. With RPNs, detection boxes are generated directly, resulting in faster and more accurate detection. The shared feature map size is approximately 40 × 60, generating about 20,000 anchors. These anchors are then judged as either foreground or background. The network subsequently assigns a score to each box, with higher scores indicating a higher likelihood of an object being present. Bounding box regression then refines the coordinates of foreground anchors, leading to even more accurate detection. Each target has multiple candidate boxes. Next, the non-maximum suppression algorithm calculates the overlap ratio (IoU) between two bounding boxes, which is the overlap ratio of the areas of Bounding Box A and Bounding Box B. This is calculated using formula (1):

where SI represents the intersection area of Bounding Box A and Bounding Box B, SA represents the area of Bounding Box A, SB indicates the area of Bounding Box B, and SA + SB − SI represents the union of Bounding Box A and Bounding Box B. The threshold for IoU is set to 0.8, indicating that if the IoU of Bounding Box A and Bounding Box B exceeds 0.8, the candidate box with the lower score will be discarded. Faster R-CNN integrates all of its modules into one network using the evolution from R-CNN to Fast R-CNN, achieving end-to-end training and significantly improving the overall model performance, especially in terms of detection speed.
YOLOv8
YOLOv8 is the latest version of the YOLO series of object detection and image segmentation models developed by Ultralytics. As an excellent one-stage algorithm model, YOLOv8 inherited the successful aspects of YOLOv5 while introducing a number of new features and improvements to further improve its performance and flexibility, making it excellent for tasks such as target detection, image segmentation, and attitude estimation. Furthermore, YOLOv8 can run on a variety of hardware platforms, from CPUs to GPUs, demonstrating its extreme flexibility. This allows the open source library to not only support the YOLO family of models, but also ensures that it is compatible with other non-YOLO models, making it widely used in classification, segmentation, attitude estimation, and other tasks.
YOLOv8 heavily draws on the advantages present in the designs of YOLOv5, YOLOv6, YOLOX, and other similar models. It is not particularly innovative or novel, and instead is focused on having excellent practical applications in engineering. The primary innovation of YOLOv8is its inclusion of new SOTA (state-of-the-art) models (including P5 640 and P6 1280 resolution target detection networks and a YOLact-based instance segmentation model). In addition, N/S/M/L/X models at different scales are also included based on the scaling coefficient to meet the needs of different deployment platforms and application scenarios. The model’s backbone uses the CSP module for reference, but the C3 module in YOLOv5 is replaced with a C2f module to make it more lightweight. It also uses the SPPF (Spatial Pyramid Pooling with Feature Concatenation) module from YOLOv5 to carefully fine-tune models of different scales; this makes it more than a simple set of parameters, which greatly improves model performance. The neck continues to employ the concept behind PAN (Path Aggregation Network), but by comparing the structural diagram of YOLOv5 and YOLOv8, it becomes apparent that YOLOv8 does not haveYOLOv5’s 1 × 1 downsampling layer. The head of YOLOv8 is very different from that of YOLOv5, as it employs the current mainstream decoupled head structure that separates the classification and detection heads, while also changing from being anchor-based to being anchor-free. For loss calculation, VFL (Visual Format Language) loss is used for classification loss (while BCE loss is used in actual training) and DFL (Distribution Focal Loss) loss + CIOU (Complete-IOU) loss is used for regression loss. In terms of label allocation, YOLOv8 replaced the original IoU allocation or unilateral proportional allocation with the Task-Aligned Assigner plus and minus sample allocation strategy. The network structure of YOLOv8 is shown in Figure 2.

YOLOv8 network structure diagram.
YOLOv8 is the latest and most widely used YOLO model, and its indicators comprehensively surpass existing object detection and instance segmentation models. It draws on the advantages of YOLOv5, YOLOv6, YOLOX, and other models, and comprehensively improves the model structure of YOLOv5 while maintaining its simplicity and ease of use.
Single Shot MultiBox Detector
Single Shot MultiBox Detector (SSD) is a target detection algorithm first proposed by Liu et al. 34 at the ECCV (European Conference on Computer Vision) conference in 2016. This algorithm uses VGG16 as the basic network for feature extraction and converts its two fully connected layers into ordinary convolutional layers. SSD extracts feature maps from Conv4_3, Conv7, Conv8_2, Conv9_2, Conv10_2, and Conv11_2 layers, uses these feature maps to construct default boxes of different scales, and then detects and classifies targets through non-maximum suppression (NMS). As one of the current mainstream detection frameworks, SSD has a significant advantage in speed compared to Faster RCNN, while it also exhibits a significant improvement in average precision mean (mAP) compared to YOLO. One of the main features of SSD is its inheritance of the idea behind YOLO, in that the detection task is transformed into a regression problem that can be completed in a single training. SSD is also characterized by employing a concept similar to a prior box based on the anchor mechanism found in Faster RCNN.
Figure 3 clearly shows the network architecture of an SSD. The starting input for the SSD network is a 300 × 300 pixel image with three color channels. As shown in Figure 4, this image is then fed into the backbone of the VGG16 network. As can be seen in the VGG16 model structure diagram, the first half of the SSD corresponds exactly to the part of the model before Conv5’s third convolutional layer in VGG16. In SSD, the output of the Conv_4 layer is specifically defined as the first feature layer, which corresponds to the convolution layer referred to by the Conv_4 layer in VGG16. The network ultimately generates six feature layers, which are then used to predict objects of different sizes. Of these feature layers, the first one focuses on detecting smaller objects, and as the hierarchy of the network deepens, the feature map gradually becomes more abstract, enabling the detection of larger targets.

SSD network structure diagram.

VGG network structure diagram.
The SSD algorithm extracts feature maps of different scales for target recognition and uses differently scaled prior frames to improve its recognition ability for targets of different scales. For these reasons, this study applies the SSD algorithm to recognize the Nantong blue calico pattern.
Improved SSD
To improve the efficiency of feature extraction, the lightweight MobileNet network is often used to replace the original VGG16 network of the SSD’s frontend; this results in the MobileNet-SSD target detection algorithm. MobileNet networks are particularly suitable for running on mobile and embedded devices, and their core building block is depthwise separable convolution (DSC). This convolution method divides the traditional convolution operation into two independent steps, deep convolution and point-by-point convolution, which not only enhances the nonlinear characteristics of the model compared with the traditional convolution method, but also improves the model’s generalization ability. Figure 5 shows the structure of conventional convolution with batchnorm and ReLU activation functions compared to DSC, highlighting the innovativeness and structural advantages of DSC.

DSC network structure diagram.
In the Mobilenet-SSD network architecture, the final average pooling layer, the full connection layer, and the Softmax classification layer in the original MobileNet architecture are removed. Instead, eight new convolutional layers are introduced after the con13 layer to allow for efficient feature extraction from six feature maps of different scales, including conv11, conv13, conv14_2, conv15_2, conv16_2, and conv17_2.
In addition, the performance of MobileNet-SSD is further improved in this study through hyperparameter optimization. The basic principle of hyperparameter optimization is to fine-tune and optimize the traditional 3D convolution computation while keeping the input and output image sizes unchanged.

where DF is the size of the feature graph, DK is the size of the convolution kernel, and M and N are the number of input and output channels, respectively. The computational amount Ca1 for depth-separable convolution is:

As can be seen from the above equation, the computational cost of MobileNet is reduced by 1/N + 1/D2K compared to traditional convolution.
Experiment
Pattern image material acquisition and classification
To gain a deeper understanding of the blue calico pattern, we undertook preliminary experimental preparation in two forms: online research and offline research. We integrated the two parts of the online and offline collection to establish a database. The patterns were then divided into six categories based on the two dimensions: subject content and organizational form. We conducted field research in Nantong, focusing primarily on the Blue Calico Museum from July 3 to 5, 2023, supplementing the remaining blue calico traditional workshops. Blue calico pattern pictures and materials were collected on-site during our field research. We collected the online research materials from the official website of the Nantong Blue Calico Cloth Museum and books such as “Chinese Arts and Crafts Master Wu Yuanxin” and “Complete Works of Chinese Arts and Crafts Masters,” and finally obtained a total of 226 resources. We created the original picture material library of the dataset after combining the two parts of the material.
Figure 6 depicts six specific types of this pattern classification. Figure 6(a) shows a representative word pattern, which have diffusion circulation and arrangement circulation, and Figure 6(b) shows an example of a character pattern, most of which appear in conjunction with scenes from stories to express meanings of happiness or longevity. Figure 6(c) shows an example of an animal pattern, which usually depict symbolic and auspicious animals such as phoenixes, dragons, horses, and carp, forming patterns through circular arrangements. Figure 6(d) shows a plant pattern, which are mostly Meilan bamboo chrysanthemums or other flowers with positive meanings. Figure 6(e) shows a symbolic pattern, which are often various irregular symbols with auspicious meanings. Figure 6(f) shows an example of a geometric pattern based on geometric shapes placed together in an orderly arrangement.

Classification of the blue calico pattern: (a) word, (b) people, (c) animal, (d) plant, (e) symbol, and (f) geometry.
Image pre-processing
Image pre-processing technology consists of a series of pre-processing operations to improve image quality, highlight target features, and reduce computational costs. This study uses the following image pre-processing methods.
(1) Standardization: The principle of image standardization processing is to adjust the image pixel value into a specified range or distribution, adjust the image of different sources and characteristics to a unified scale, and customize the input to produce the subsequent algorithm. After standardization processing, the image size is converted to 701 × 701 pixels with a resolution of 72 pixels per inch.
(2) Data augmentation: This process improves the model’s generalization ability and anti-disturbance ability. This experiment uses rotation, discoloration, symmetry, and other methods to enhance the data of the original image material.
(3) Image segmentation: The blue calico pattern is very complex and challenging to identify due to the repeated arrangement and coexistence of many kinds of patterns. We performed image segmentation to extract a single material of various sorts to improve the image quality. We enhanced the contrast and improved the image clarity while segmenting to improve the overall image quality. After the operation, we obtained the original 2000 image material data points from the dataset. Figure 7 shows the process of partial pattern segmentation, in which Figure 7(a) is the original blue calico image and Figure 7(b) is the image after conducting segmentation and other types of processing.
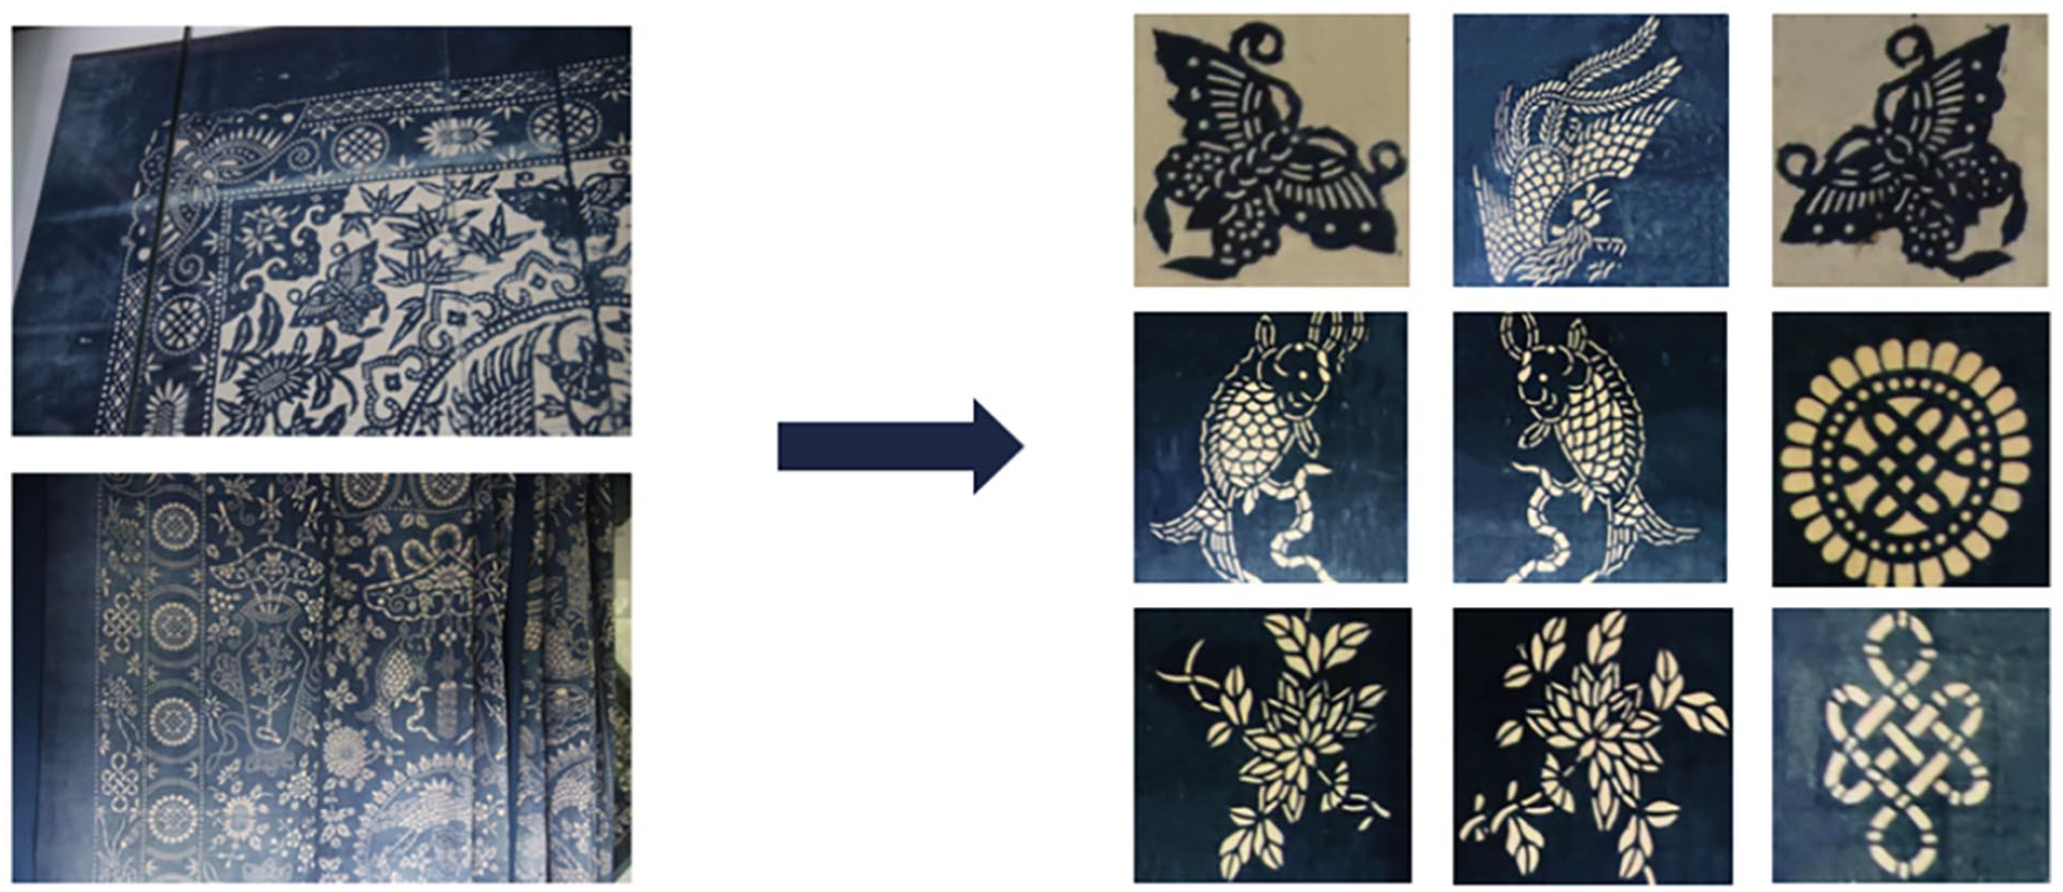
Image segmentation processing.
Experimental environment settings
The experiment consisted of the following steps. First, the pattern images were read in batches to obtain data and label values. Subsequently, the pattern images were pre-processed, and the resulting data were enhanced. Next, the classified images were divided into two parts: a test set and a training set. In the experiment, the ratio of the test set and training set was 9:1. We then randomly disrupted the order of the pattern image data and the labels, thereby dividing the training set and test set. After this division, the hyperparameters were set uniformly. The basic network parameters was shown in Table 1.
Parameter settings.

Comparison and analysis
Data analysis
In this study, the abilities of three models to recognize blue calico patterns were compared and analyzed. We plotted the average accuracies of the three models in a single graph to better evaluate their performances. The mean average precision (mAP) index is a widely used evaluation index in target detection tasks, as it can effectively evaluate the performance of target detection algorithms and it reflects the model’s average accuracy under different thresholds. Figure 7 presents the average accuracy curve of the three detection algorithms on the Nantong blue calico pattern dataset. The abscissa is the recall, which reflects the proportion of positive samples detected by the model to all positive samples, and the ordinate is precision, which reflects the number of true positive samples in the set of positive samples detected by the model.
It was evident from the curve that when the confidence threshold was low, the recall rate was high. However, the accuracy was low when the confidence threshold and precision were high, but the recall rate decreased. As a result, the area under the precision-recall curve reflected the mAP curve; accordingly, the larger the area under the curve, the better the balance between precision and recall.
As shown in Figure 8, the curves of the word category for the three models were nearly saturated, and the recognition accuracy of YOLOv8 and SSD for this category reached 100%. Faster-Faster RCNN was inferior to the other two models, but it still reached 95% accuracy. The people and animal categories developed steadily within the range, and the recognition accuracy of the three models for these two categories was above 80%; notably, the average recognition rate of the SSD model for the two categories was completely consistent, at 86%. Regarding the recognition performance of the symbol category, SSD showed obvious advantages compared with Faster-Faster RCNN and YOLOv8. Meanwhile, recognition of the geometry category was affected by the characteristics of the pattern material itself; this was because the geometric patterns exhibited large differences between individual samples and had more complex arrangements and combinations than the other categories. As a result, the recognition rate of the three models for the geometry class was low, and only the SSD model had more than 50% recognition for this category.
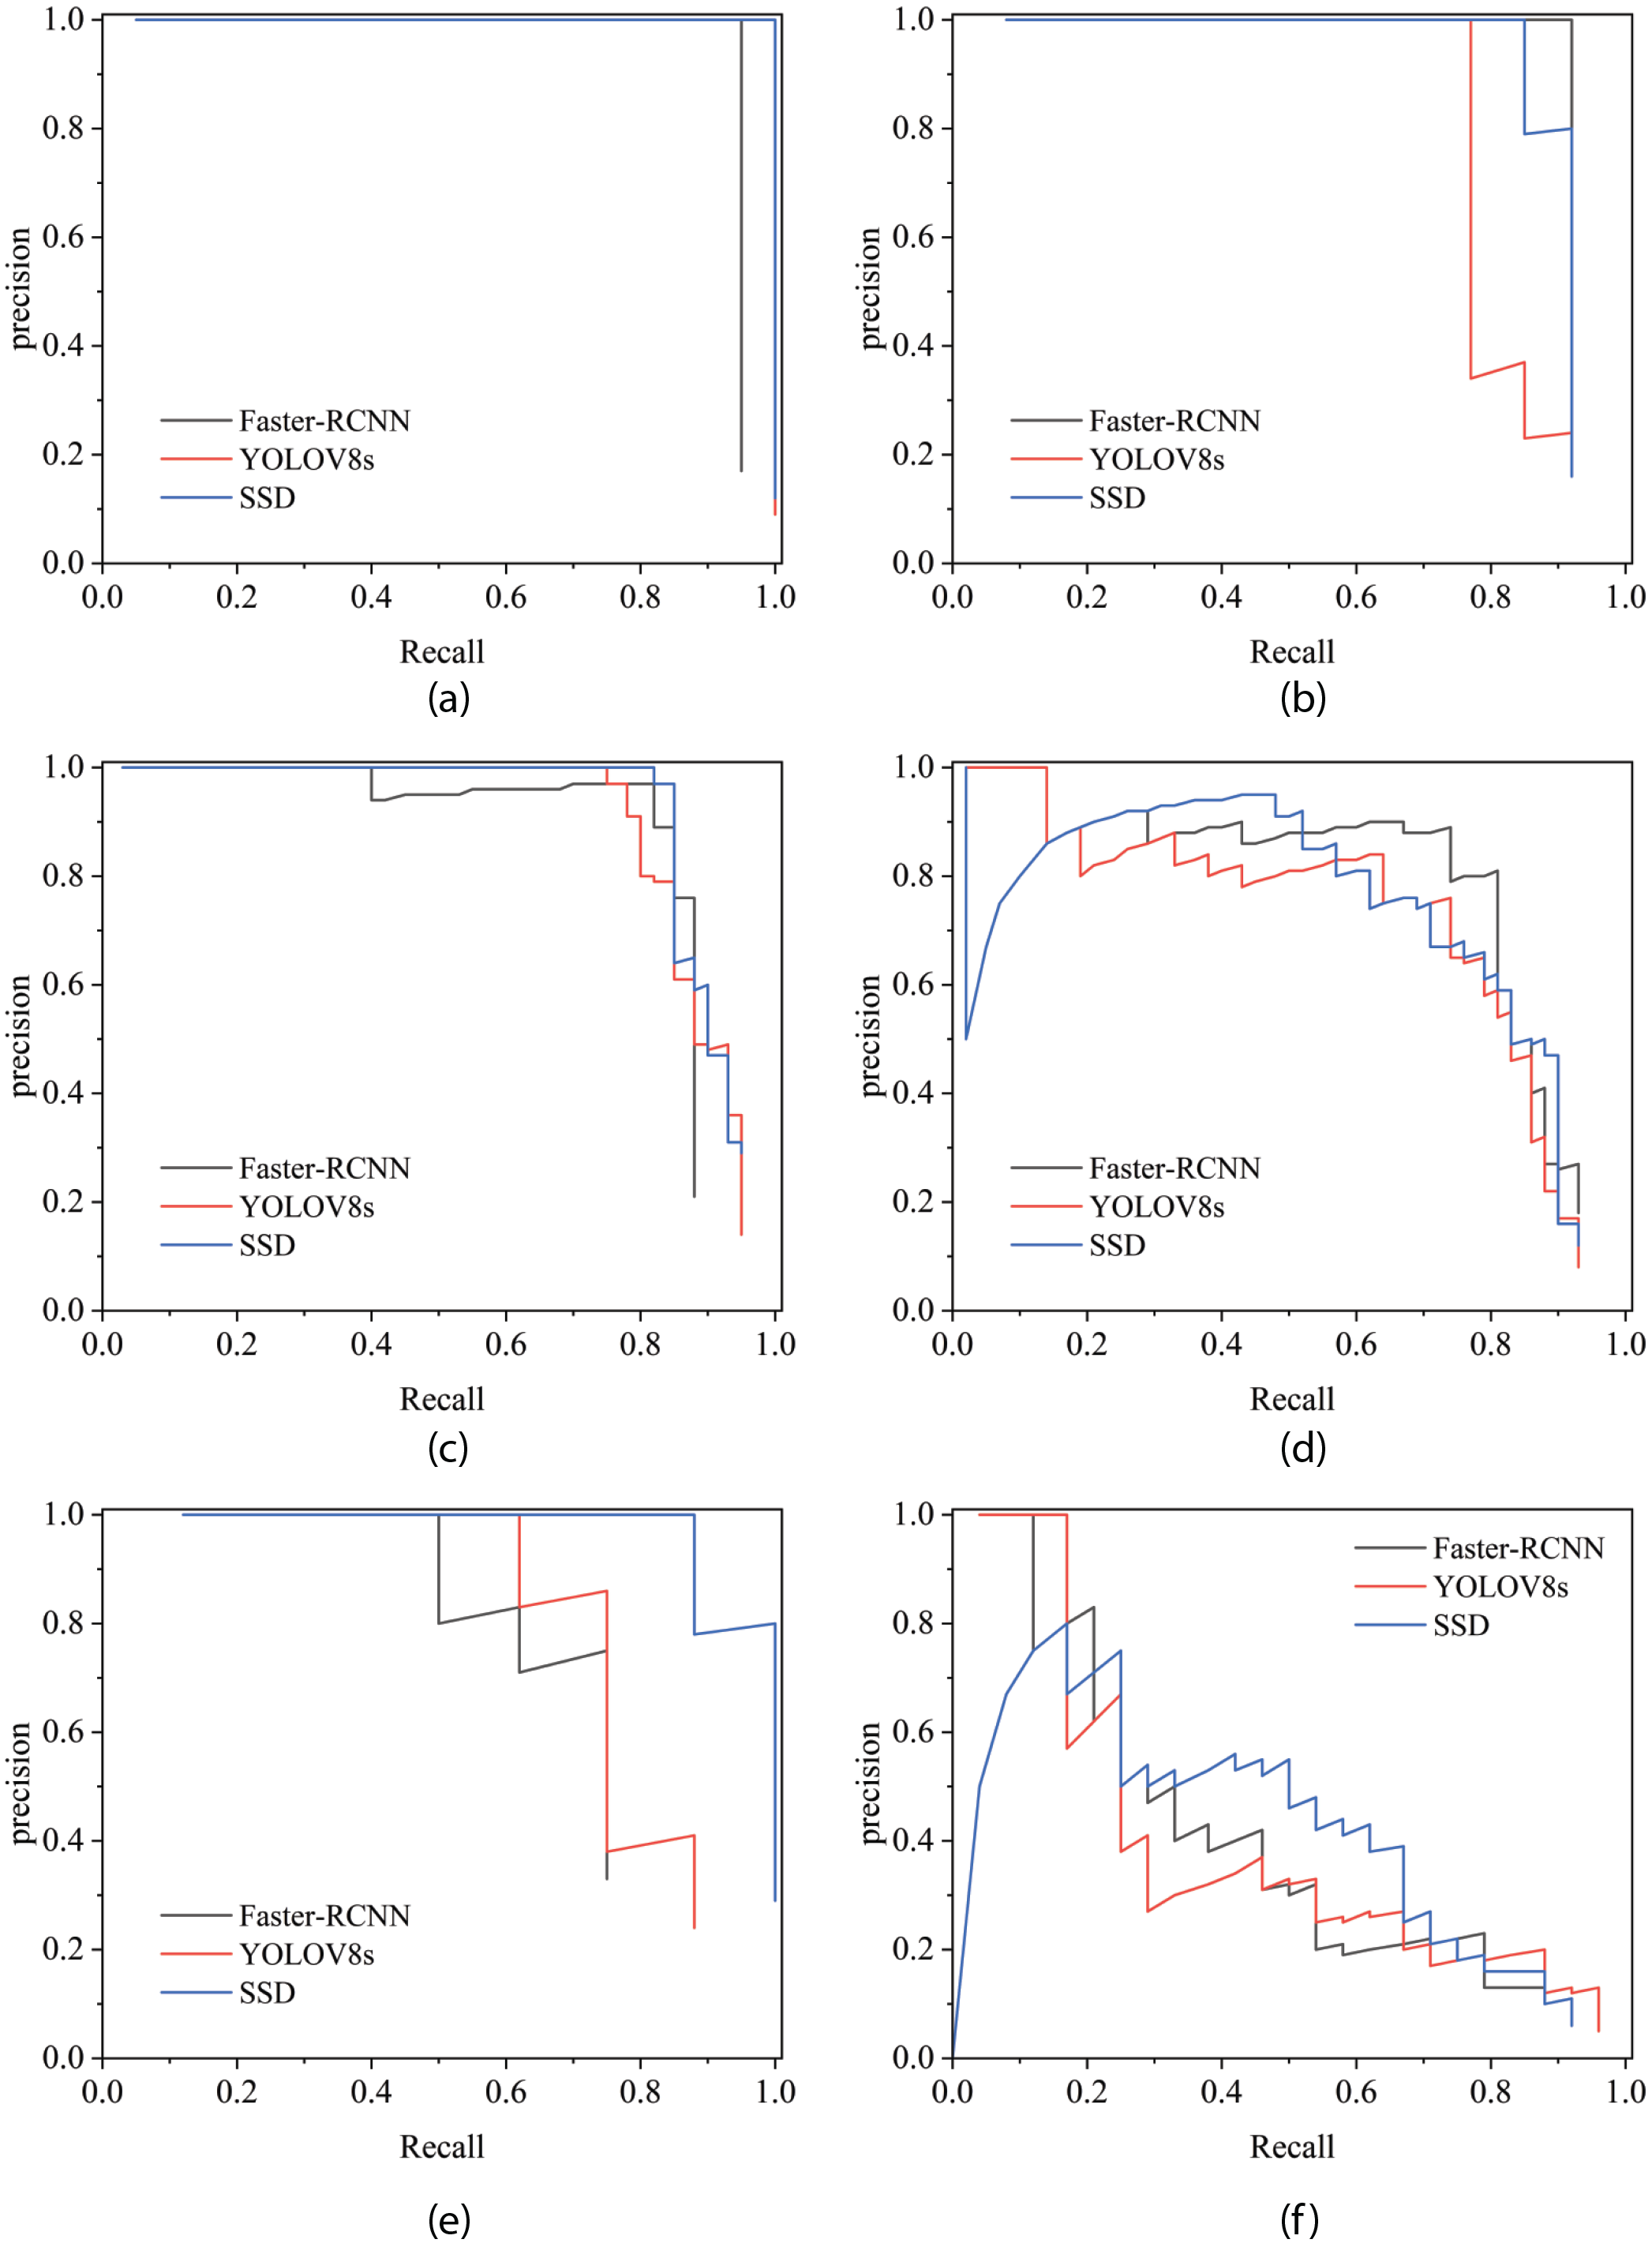
The mean average precisions of the three models: (a) word, (b) people, (c) animal, (d) plant, (e) symbol, and (f) geometry.
Compared with the SSD model, the other investigated models were less effective in detecting certain categories of Nantong blue calico, which lowered the overall mAP. Although the SSD model did not have the highest AP value for each type of target, the SSD model still exhibited a good average performance for the detection of each type of target. In summary, the SSD model is the best in terms of overall performance. Given the above considerations, we selected the SSD model for optimization.
Data analysis after model optimization
In the next experiment, we applied a series of optimizations to the SSD model, including using the lightweight MobileNetV2 backbone network to improve the model’s performance in image recognition tasks. Figure 9 shows the recognition accuracy of the optimized model with MobileNetV2 for the six categories of Nantong blue calico.
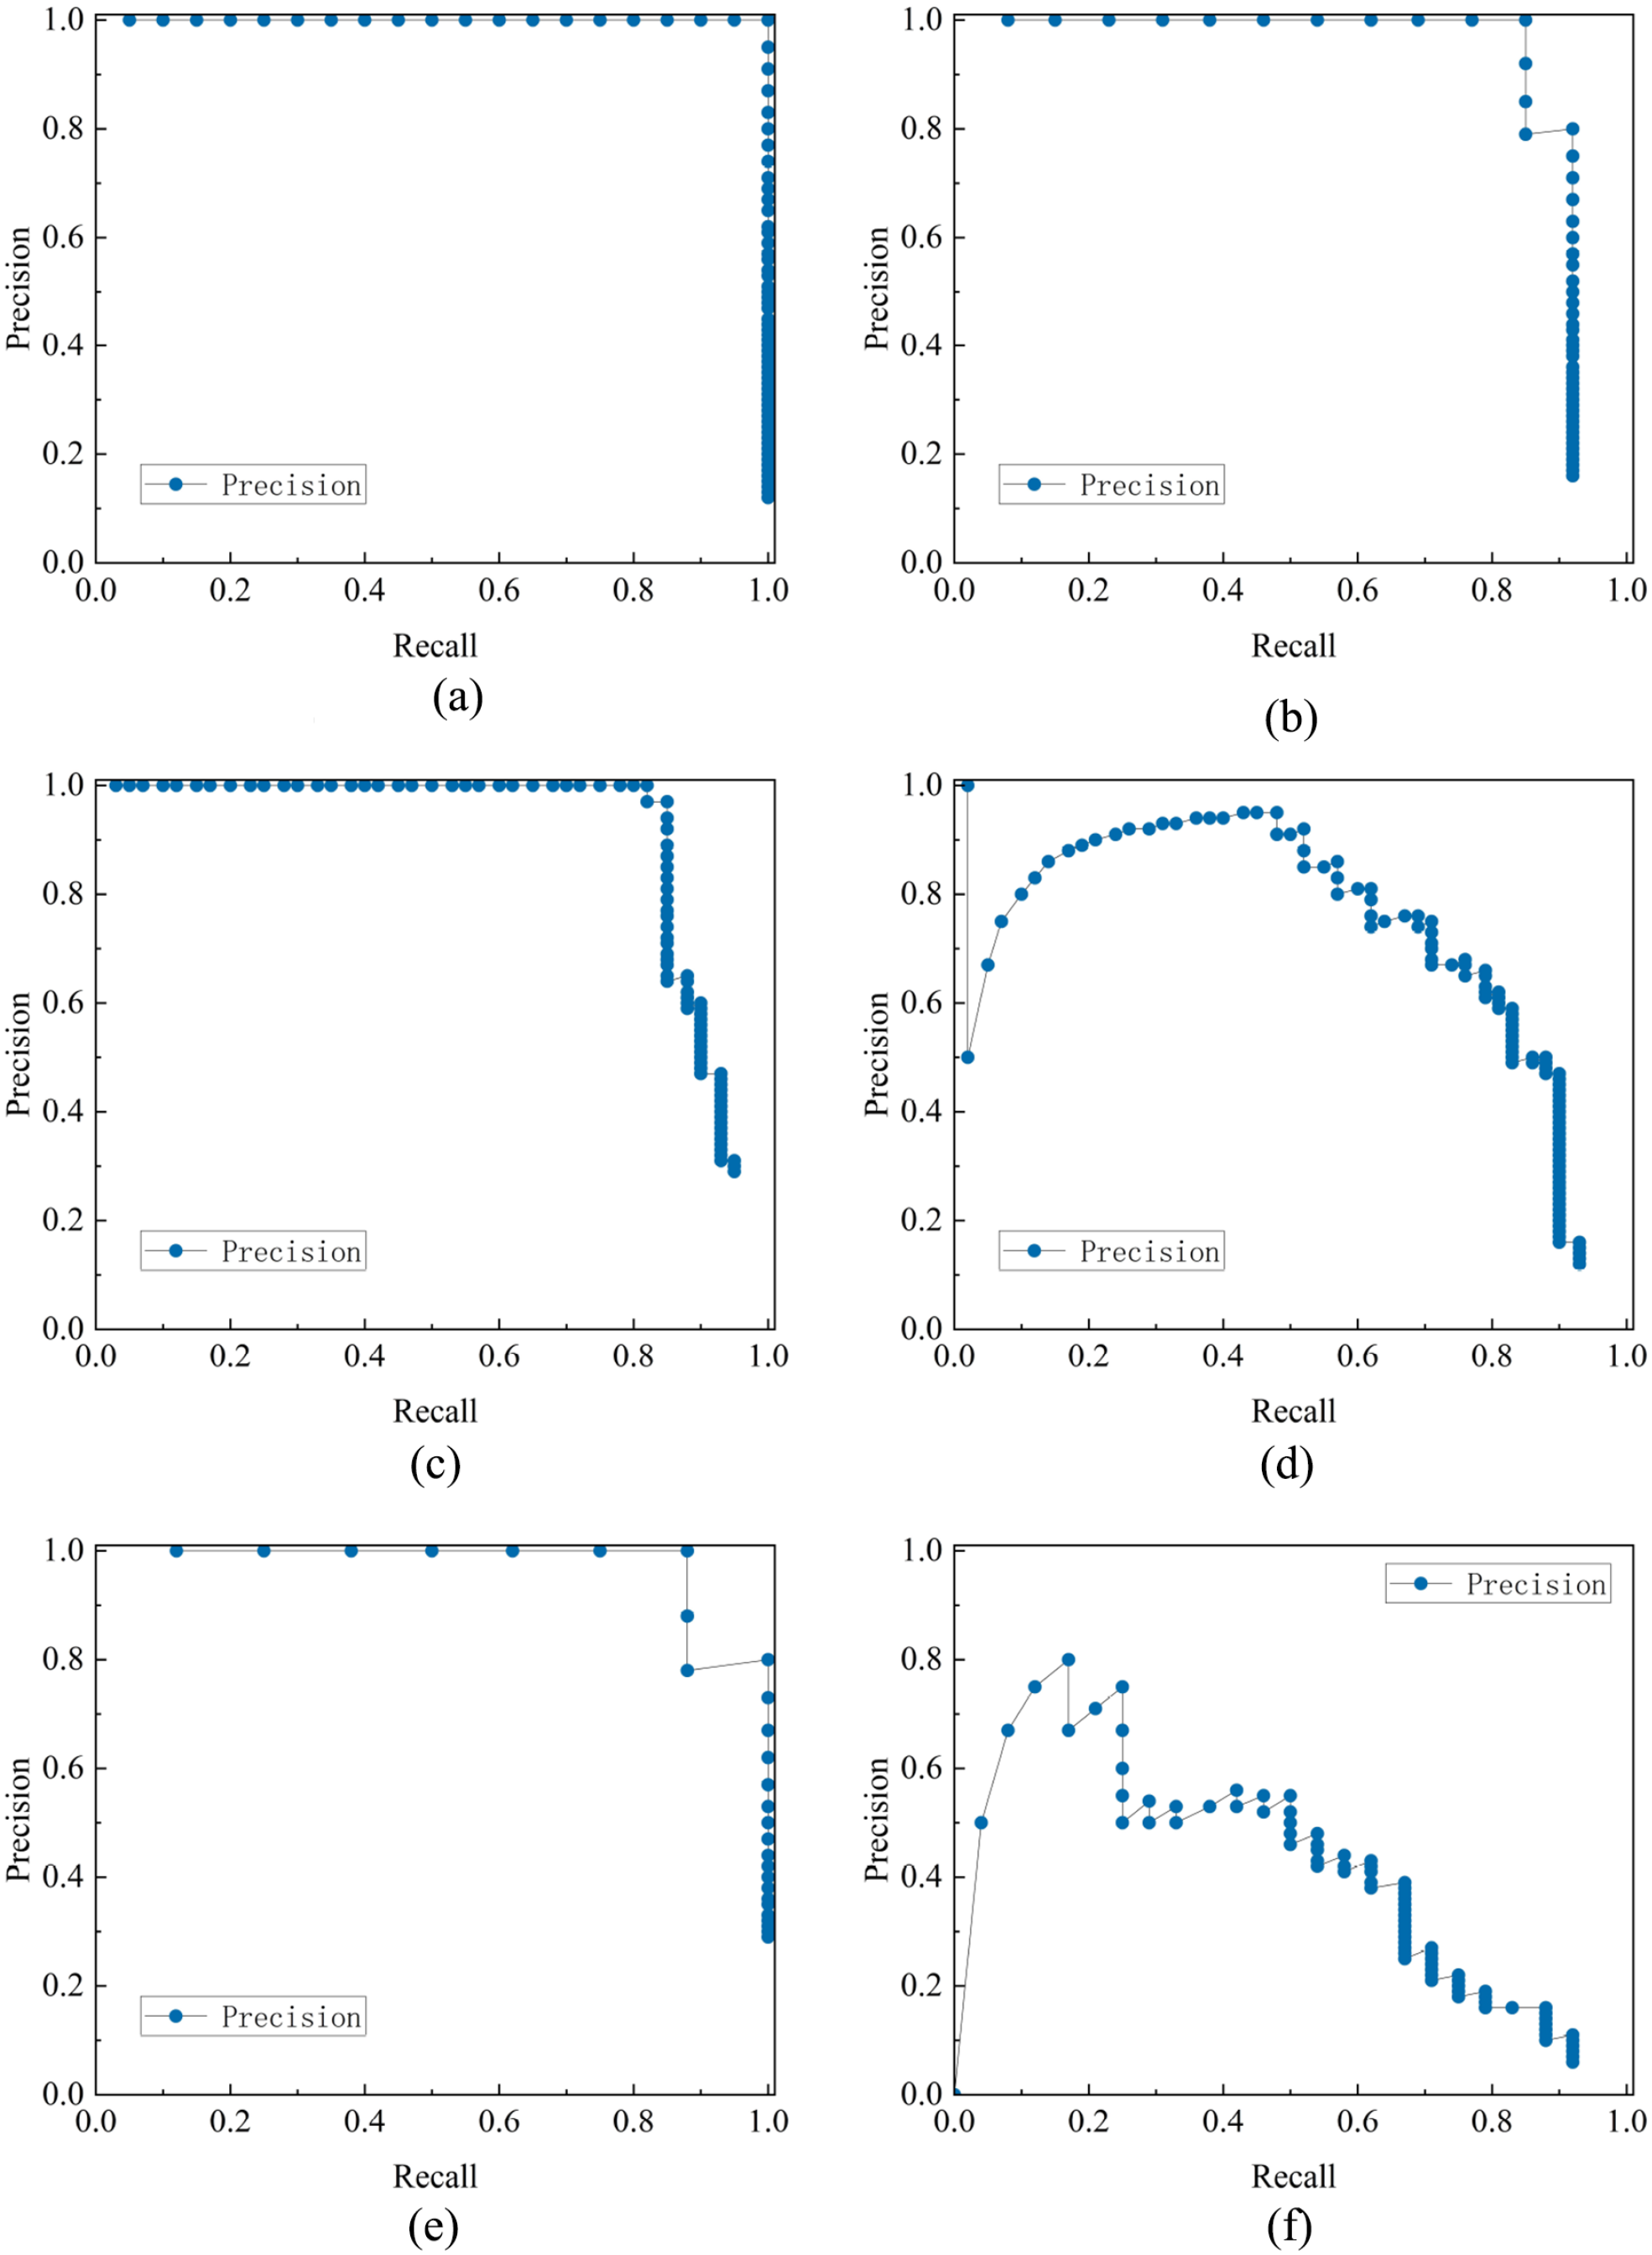
The mean average precision of Mobilenetv2: (a) word, (b) people, (c) animal, (d) plant, (e) symbol, and (f) geometry.
The precision–recall (P-R) curve for each class can be used to intuitively show the detection capability of the model for each category of pattern. The P-R curves of the MobileNetV2 model in the four categories of word, people, animal, and symbol are shown in Figure 9(a)–(c) and (e). It can be seen that the improved model nearly reached a state of saturation in the whole range of the recall rate, maintaining an accuracy of more than 90%. Meanwhile, the word category achieved 100% accuracy. Compared with the first three models in the experiment, the recognition accuracy of these four categories was significantly improved. The overall accuracy rate for plants, shown in Figure 9(d), was lower than that of other categories, but the improvement in the accuracy rate was particularly significant in areas with medium to high recall rates. This improvement was mainly due to the efficient feature extraction capability of MobileNetV2, which resulted in the model having better robustness and accuracy in recognition. Finally, the accuracy in the geometry category, shown in Figure 9(e), was reduced by 6% compared with the SSD model before optimization. However, on the whole, using MobileNetV2 as the backbone network effectively improves the detection accuracy and recall rate of the Nantong blue calico pattern and reduces the complexity and calculation cost of the model.
To better understand the benefits of the optimized SSD model, we also present the F1 values of the MobileNetV2 model for the detection task in Figure 10. The F1 value is the harmonic average of precision and recall, and it is used to evaluate model performance at a single point; that is, the accuracy and recall of the model are taken into account under a specific threshold. This measure is particularly suitable for class imbalance problems because it balances the importance of accuracy and recall, providing a comprehensive evaluation of model performance. In the F1 result plot, the larger the area under the curve, the better the performance of the model. The model had the highest performance as measured by F1 on the word category, reaching 100%, while that on the animal category also reached 91%. The performance on the people, plant, and symbol categories had an average F1 value, showing a high value in the range of 0.2–0.8. The model’s performance in recognizing the geometry category was poor, but the overall trend accords with the rule, and the effect is better in the middle section.
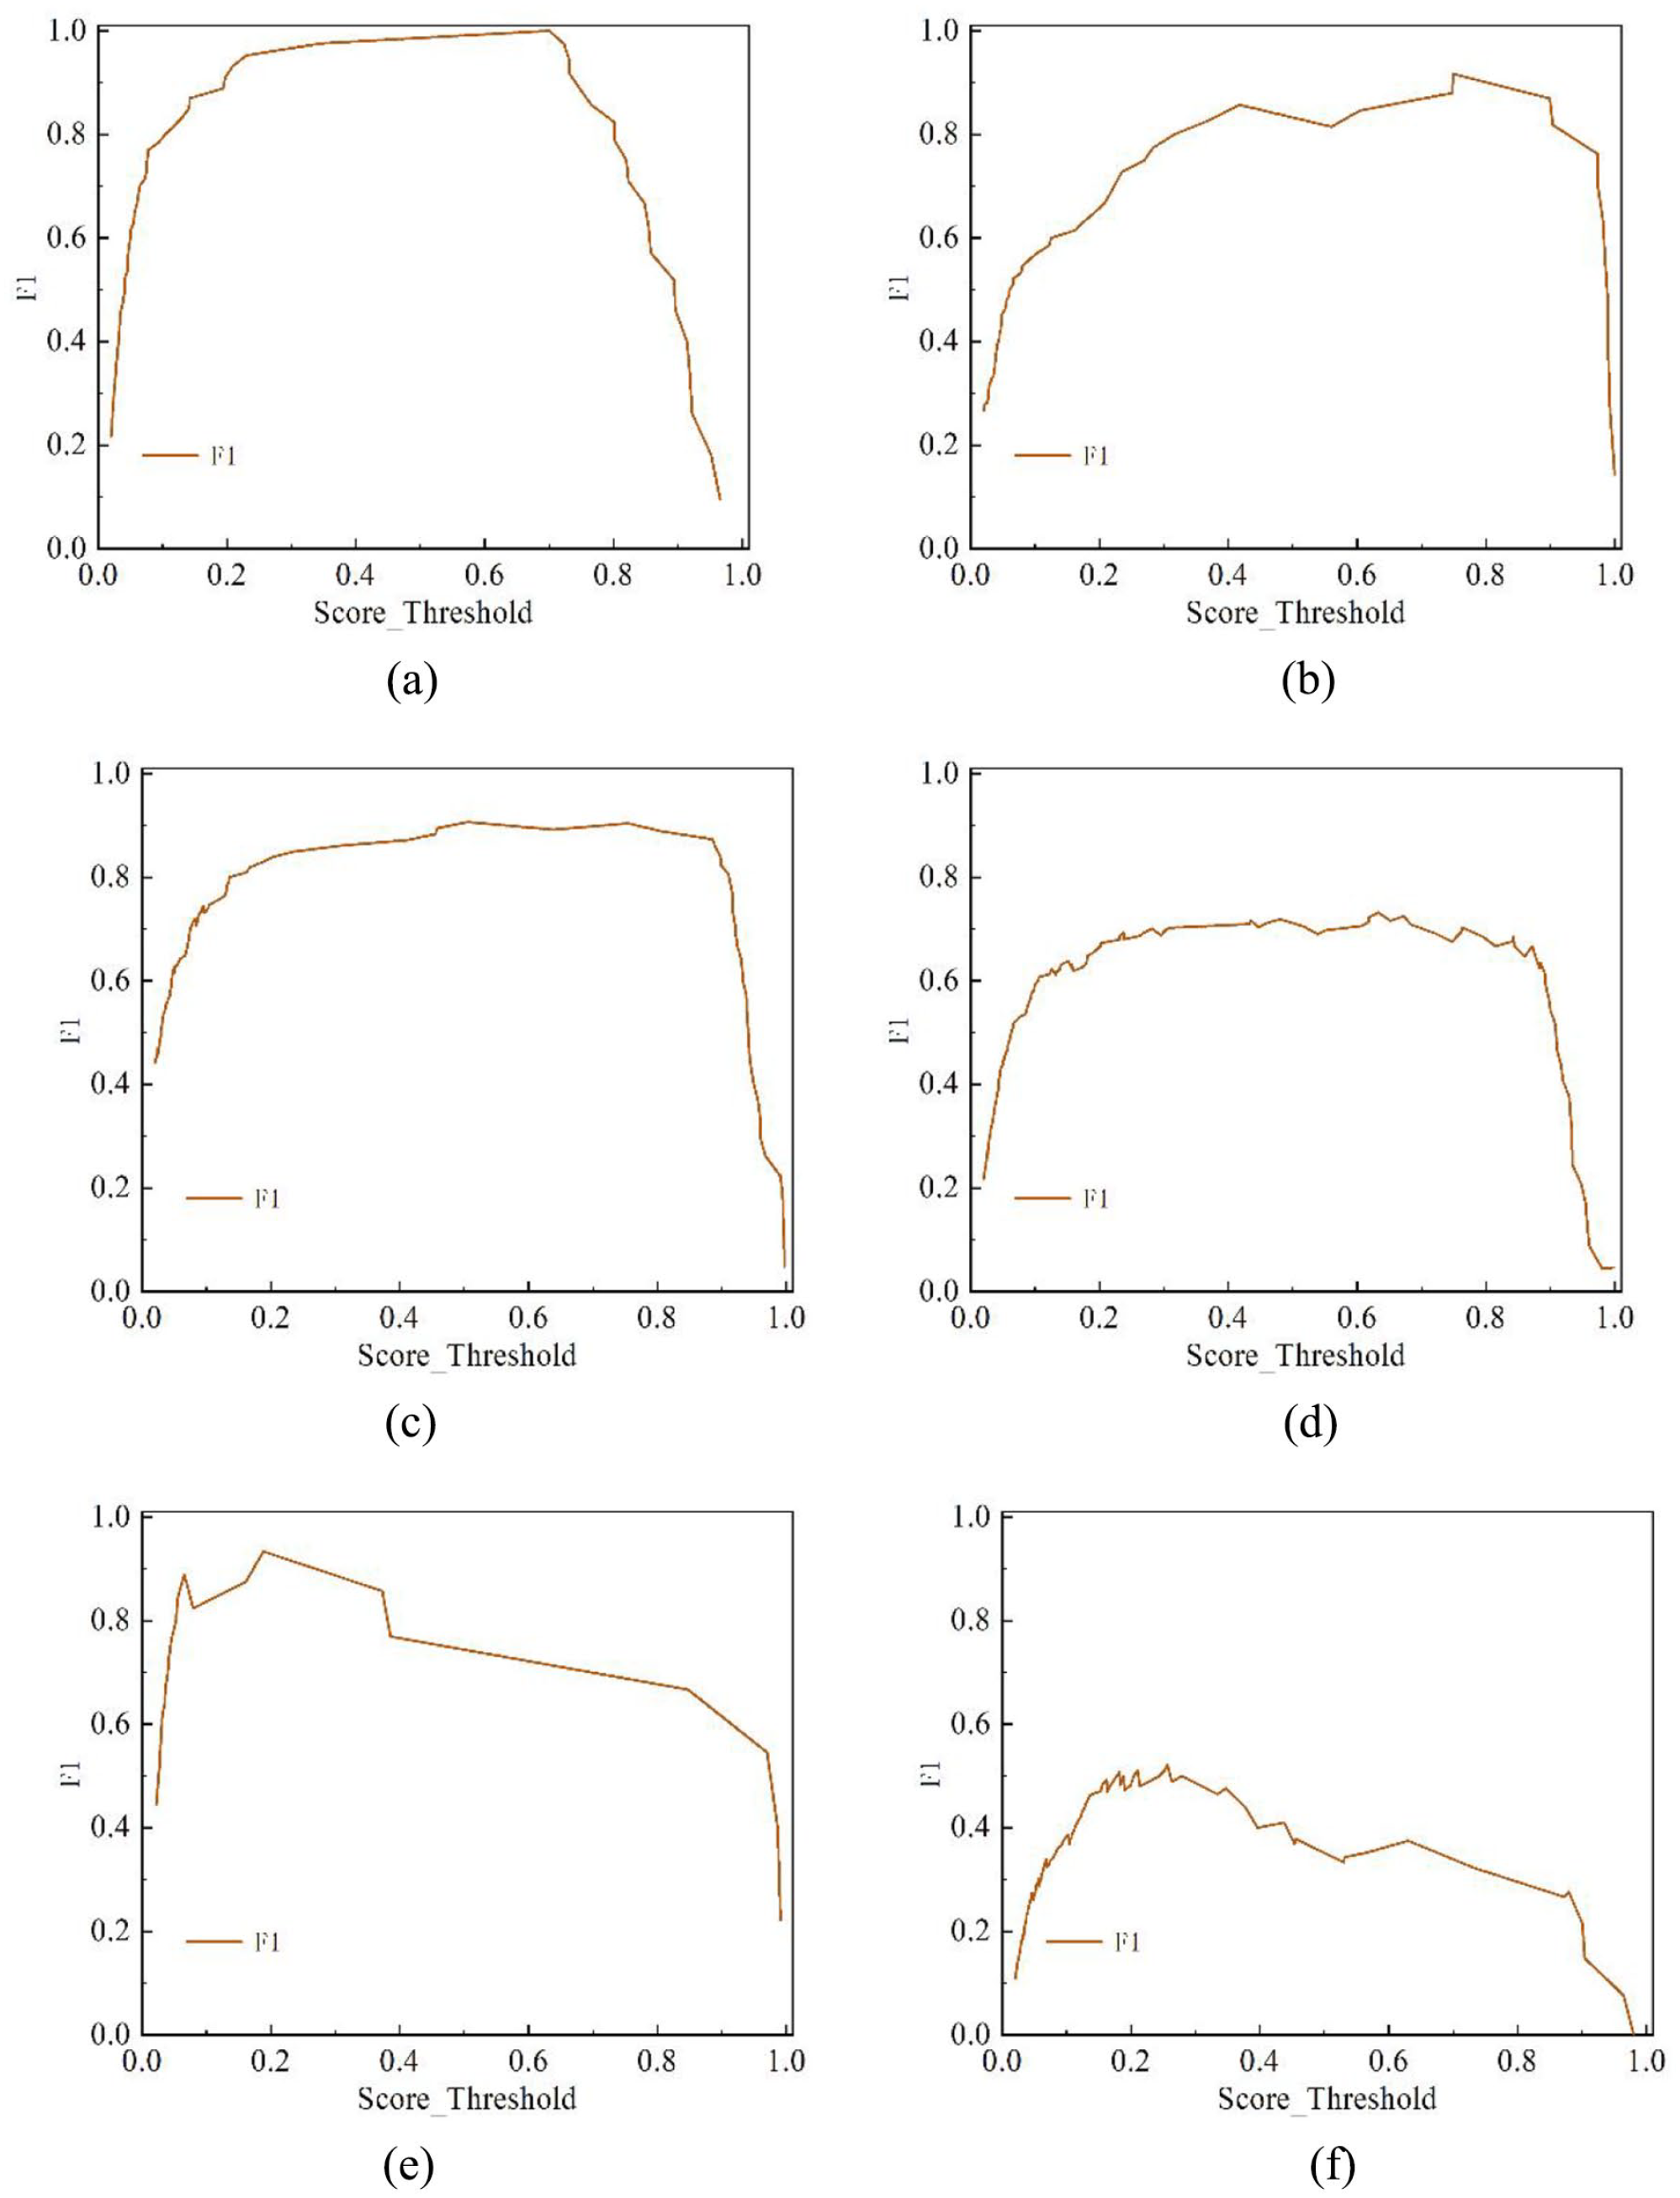
F1 values of MobileNetV2: (a) word, (b) people, (c) animal, (d) plant, (e) symbol, and (f) geometry.
To summarize the above experimental procedures, we compared the performance, number of parameters, floating-point arithmetic (FLOPs), and model size of four target detection models. The specific values are shown in Table 2. The improved SSD model had the best performance on the mAP index, reaching 83.36%, which was significantly higher than the other models. This shows that the improved SSD model exhibited a significant improvement in detection accuracy. At the same time, the improved SSD model has the lowest number of parameters, with only 6.204M parameters, which is significantly lower than other models, especially compared with Faster RCNN’s 137.099M parameters and SSD’s 26.285M parameters, representing reductions of about 96% and 76%, respectively. This shows that the improved model can greatly reduce model complexity while maintaining high precision. The optimized SSD model also performed well in terms of FLOPs, at just 1.784G. This was approximately 99.5% and 97% less than the Faster RCNN’s 370.210G and SSD’s 62.747G, respectively. The size of the model is also only 16.8M, making it the smallest of all the models, being about 84% and 82% smaller than the Faster RCNN’s 108M and SSD’s 95.4M, respectively. The above data demonstrate that the improved SSD model performs well in all aspects; it achieved the highest detection accuracy (mAP) of 83.36% while significantly reducing the number of parameters, FLOPs, and model size. This was mainly due to the introduction of MobileNetV2 as the backbone network, which enabled the model to become more lightweight and achieve greater efficiency while maintaining high accuracy. These results show that the improved SSD model not only exhibits a significant improvement in accuracy, but also that it has excellent performance in resource consumption, as well as a high practical application value.
Average accuracy of model identification.

Feature extraction
After classification and recognition by VGG, a relatively complete Nantong blue calico pattern database was constructed. This work can provide a digital basis for the establishment of a Nantong blue calico intangible heritage website and for pattern retrieval. Moreover, the feature extraction of the blue calico pattern was carried out by a VGG model in this paper. The extracted pattern materials can provide digital information for designers to practice designs, learn and adopt traditional artistic styles, and serve as a basis for innovating new designs. The feature extraction results of blue calico patterns are shown in Figure 11. We selected one piece from each type of pattern to demonstrate the extraction effect.

Pattern feature extraction effect: (a) word, (b) people, (c) animal, (d) plant, (e) symbol, and (f) geometry.
The peak signal-to-noise ratio (PSNR) is one of the indicators commonly used to evaluate image quality. It is often used to measure how distorted the reconstructed signal of an image or set of images is compared to the original content. In general, the higher the PSNR value, the higher the image’s quality. The effectiveness of feature extraction using VGG can be judged by analyzing the PSNR values of various patterns. Taking the word category of Figure 12(a) as an example, the highest average PSNR value of 13.71 appears in the 54th layer, meaning that the 54th layer is the image with the best extraction. Meanwhile, in the people category, the highest PSNR value is on the 62nd layer, with a value of 11.72, while for the animal category, the highest PSNR value is 11.95, which is on the 11th layer. Similarly, the highest PSNR value for the plant category is on the 52nd layer, with a value of 12.62. The highest PSNR value for symbol patterns is on the 30th layer, with a value of 13.91, and the highest PSNR value for geometry patterns is on the 33rd layer, with a value of 13.27. It can be seen that the average PSNR value corresponds to the highest quality output image, which provides a basis for designers to select the best image for feature extraction.

Peak signal-to-noise ratio (PSNR) values of the feature extraction: (a) word, (b) people, (c) animal, (d) plant, (e) symbol, and (f) geometry.
Conclusion
Nantong blue calico was selected as the research object in this study, and a series of test experiments were carried out using deep learning models in the field of image processing.
(1) We collected images of Nantong blue calico and organized a complete pattern material library. Then, Faster-Faster RCNN, YOLOv8, and SSD deep learning models were used to detect and recognize blue calico patterns, and the recognition performance of these models on the dataset was evaluated. As part of this process, a comprehensive Nantong blue calico pattern database was constructed, providing a digital basis for classification and retrieval tasks for Nantong blue calico-related websites or non-genetic websites.
(2) Through the comparative analysis of various indicators, the SSD model obtained better results in the classification recognition test, with an average accuracy of 79.42%. SSD thus has the best generalization ability of all the models tested, with only small gaps between categories, and it is more flexible.
(3) We then optimized the SSD model, adopted a lightweight backbone network, and built the MobileNetV2 model. MobileNetV2 was used to detect and evaluate the dataset, and the average accuracy rate of Nantong blue calico pattern recognition was improved to 83.36%. Compared with the other three models, the accuracy of detection for each pattern was significantly improved.
(4) Based on the superior image processing performance of VGG, we continued to use it for feature extraction experiments on blue calico patterns and obtained better extraction results. The extracted pattern materials can provide digital information for designers to practice designs, learn and adopt traditional artistic styles, and serve as a basis for innovation in new designs.
Footnotes
Declaration of conflicting interests
The author(s) declared no potential conflicts of interest with respect to the research, authorship, and/or publication of this article.
Funding
The author(s) disclosed receipt of the following financial support for the research, authorship, and/or publication of this article: This study was funded by the Natural Science Foundation of Fujian Province (Project No. 2020J01286).