
Abstract
Linseed straw is the stalk or stem of the linseed plant that remains after the seeds have been harvested. This agricultural waste is generated every year and is mostly left or burned in fields, causing environmental problems. This study focuses on the isolation and characterization of crystalline nanocellulose (CNC) from linseed straw fibers as a potential alternative source. The CNCs were isolated using sequential chlorine-free chemical and mechanical treatments, involving three main steps: pre-treatment, acid hydrolysis, and post-treatment. The isolated CNC was thoroughly characterized for its morphology, particle size, aspect ratio, crystallinity, crystallite size, cellulose polymorph, thermal properties, and chemical composition, compared to raw fiber (RF) and micro cellulose (MC). Characterization techniques such as scanning electron microscopy (SEM), transmission electron microscopy (TEM), X-ray diffraction (XRD), thermogravimetric analysis (TGA), and Fourier transform infrared spectroscopy (FT–IR) were employed. The rod-like CNCs obtained exhibited a yield of 79.87 ± 1.35%, with a mean diameter of 7.06 ± 1.95 nm and a length of 66.14 ± 28.58 nm. The aspect ratio was measured at 10.02 ± 4.87 nm, with a crystallinity index of 73.29% and a crystallite size of 5.61 nm. Additionally, the CNCs displayed an average molecular weight of 2.36 × 10⁴ g/mol, an average degree of polymerization of 146, and a peak decomposition temperature of 515°C. These results suggest that linseed straw fibers are a promising source for the production of CNC, which can effectively serve as a filler in polymer composites.
Keywords
Introduction
Cellulose, a renewable and biodegradable polymer, has emerged as a promising material for the development of eco–friendly alternatives due to its availability, sustainability, biocompatibility, good film–forming capacity, active surface area, and nontoxic nature.1,2 The benefit and application of cellulose can be further expanded when cellulose chains are bundled together forming highly ordered domains that can be subsequently extracted as micro and nano particles.3,4 The term micro cellulose describes all forms of cellulose materials with diameters in the micro meter range, typically from 1 to 1000 μm, while nanocellulose describes the forms of cellulose containing dimensions in the nanoscale (1–100 nm). The micro sized cellulose has been classified into micro fibrillated cellulose (MFC) and microcrystalline cellulose (MCC). Similarly, the nano cellulose has nano fibrillated cellulose (NFC) and cellulose nanocrystal (CNC) types. 5
MCC has been described as a purified, partially depolymerized cellulose by chemical treatment generally with 5–50 μm in length and a diameter of 2–20 μm. MFC is produced by mechanical treatment with a diameter of 5–50 nm and in the range of several micrometers in length. 6 CNCs are rod like nanoparticles with 4–70 nm in diameter and 100–6000 nm in length, usually produced by acid hydrolysis. NFC is commonly obtained by mechanical treatment with flexible, longer and wide nanofibers (20–100 nm in width and >10,000 nm in length). 7
However, depending on the cellulose source, isolation procedure, conditions, and pre-post-treatments, the characteristics of nanocellulose such as degrees of crystallinity, cellulose polymorph, aspect ratio, length, diameter, specific surface area, morphology, and other characteristics can be varied.3,8
In particular, nanocellulose has gained significant attention as a filler material in the area of polymer composite materials. Owing to its nanoscale, nanocellulose exhibits various advantageous features than the bulk material, encompassing nanoscale effect such as low density, superior mechanical strength, biodegradability, biocompatibility, large surface area, nontoxicity and sustainability.9–11 The use of nanocellulose as a filler in biodegradable polymer composites has the potential to improve thermal and mechanical properties by adding a small amount of filler to polymers used for various applications, such as 3D printing materials, sensors, automotive parts, aerospace components, packaging coatings, paper coatings, packaging fillers, paper fillers, flexible electronics, paint, cosmetics, aerogels, and organic light-emitting diodes (OLEDs). 12
Plant natural fiber consists of cellulose and non-cellulose materials such as lignin, hemicellulose, pectin, wax, and other extractives. Therefore, in order to extract cellulose either as micro or nano scale, the non-cellulosic materials must be removed. 6 The extraction of nanocellulose typically involves several steps to isolate and refine cellulose fibers into nanoscale dimensions. The extraction steps involved pre-treatment, treatment and post-treatment. The purpose of implementing these pre-treatments is mainly to remove impurities such as wax, lignin, pectin, and hemicelluloses and to facilitate partial breakdown of cellulosic fibers. 13 Various pre–treatment processes and chemicals used to isolate nanocellulose have been reported in the literature, specifically dewaxing, delignification, alkalization and bleaching. A mixture of toluene–ethanol,14,15 benzene–ethanol, 16 and ethanol–water 17 are commonly used as solvents for dewaxing cellulose fibers to remove impurities and extractives (wax, pectin).
The most commonly used chemical solutions for the delignification of cellulose fibers to remove lignin are alkaline hydrogen peroxide and sodium chlorite.18,19 Chlorine reagents are still used in most delignification and bleaching treatments, considering their remarkable oxidation of residual polymeric lignin with little destruction of the polymeric chain of polysaccharides. However, the environmental efficacy of chlorine reagents is high. 20
The delignified fibers are further treated during the alkalization process using widely used chemicals such as NaOH21,22 and KOH23,24 to remove hemicelluloses. To obtain highly purified cellulose, the alkalized cellulose fibers should be further bleached using H2O2.25,26 However, treatment conditions, such as concentration, mixing ratio, reaction time, temperature, and number of repetitions, may vary across studies for successful extraction of pure cellulose.
The second stage involves removing the amorphous domains, splitting local interfibrillar crystalline linkages, and releasing CNCs by a controlled chemical treatment, usually acid hydrolysis. To isolate CNCs from purified cellulosic material, acid hydrolysis is performed by utilizing strong mineral acids with carefully controlled hydrolysis parameters, such as temperature, time, mixing ratio, and acid concentration. 27 For hydrolysis, various kinds of mineral acids can be utilized, such as sulfuric (H2SO4),28,29 hydrochloric (HCl),30,31 nitric (HNO3),32,33 phosphoric (H3PO4),34,35 maleic (C4H4O4),36,37 and formic (HCOOH)32,38 acids. Additionally, the combination of HCl with organic acids, such as acetic acid (CH₃COOH)38,39 and butyric acid (C4H8O2) 38 has also been reported. Among the mentioned mineral acids, the most commonly used acid to prepare CNCs is sulfuric acid. The benefit of using sulfuric acid is that it promotes the grafting of anionic sulfate ester groups and initiates esterification on the cellulose surface. Additionally, the anionic group facilitates the formation of a negative electrostatic layer on the surface of the nanocrystals and improves their dispersion in water.28,40
The third stage of treatments, commonly known as post-treatment methods followed by acid hydrolysis for isolating CNCs include centrifugation, neutralization, dialysis, sonication, and drying.41,42 For the effective processing and commercialization of nanocellulose, dewatering and drying methods are crucial post-treatment steps. 43 The high thixotropic viscosity of the dilute suspension is a result of the large surface area, hydrophilic nature, and high water-holding capacity of CNCs. Therefore, dewatering and drying of CNCs using conventional methods may cause irreversible particle agglomeration, which prevents them from dispersing again upon rehydration due to the hydrogen bonding of the particles. Solvent evaporation, centrifugation, shear stress aided dewatering, filtration, and pressing are some of the current methods utilized in nanocellulose dewatering to reduce obstacles. To properly dry out the nanocellulose gel, a drying step, such as an oven, spray, freeze, or supercritical CO2 drying technique, is required after dewatering. 44 The size, shape, and other properties of nanocellulose, as well as its potential field of application, are influenced by differences in source selection, extraction methods, and subsequent chemical modifications.
Cellulose can be extracted from various sources, such as woods, non-wood lignocellulose plants, and agricultural residues or byproducts, such as hemp, flax, jute, ramie, kenaf, bamboo, sisal, and cotton. 45 With the increasing demand for sustainable and biodegradable materials, there is a growing interest in exploring new sources of cellulose in addition to wood, such as agricultural residues and byproducts, including corncob,46,47 rice husk,48,49 wheat straw,50,51 teff straw, 52 sugarcane bagasse,53,54 and coffee husk.55,56 However, millions of tons of unused agricultural residues are generated every year and left to waste or burn on the field at present. 57 The burning of agro-residue is doubly wasteful, as nutritious straw is lost and identified as a major health hazard leading to pollution or smoke of approximately 12%–60% parts per million (ppm) in concentration. 12
To the best of our knowledge, some studies have reported on the extraction, characterization, and extraction methods of fibers from linseed (oleaginous), flax stalk straw, and hulls.58–60 However, linseed straw fiber has not yet been studied as a potential alternative source for cellulose and nanocellulose extraction. Especially in Ethiopia, it is typically burned on fields compared to other agricultural wastes. Specifically, flax (Linum usitatissimum L.) can be broadly divided into fiber, linseed (oleaginous) and dual-purpose flax species, which are mainly used for fiber, oil (seed), and both fiber and oil extraction, respectively. 61 Our recent study revealed a high production capacity of linseed crops in the world is approximately 3.34 million tons per year and in Ethiopia it is approximately 100,000 tons per year. In addition, our study reported that linseed straw fiber contains a significant amount of cellulose (68%) 62 compared to other sources, such as hemp (70%–74%), jute (61%–72%), sisal (68%–78%), ramie (69%–91%), bagasse (32%–52%), bamboo (26%–60%), softwood fiber (40%–45%), rice straw (28%–36%), wheat straw (33%–38%), barley straw (31%–45%), corn stalk (39%–47%), and corn stover (38%–40%), 63 suggesting that this agricultural straw is a promising source for the extraction of cellulose and nanocellulose.
This study focused on the extraction and characterization of crystalline nanocellulose from abundant linseed straw fiber, to unlock the untapped potential of this agricultural waste as a sustainable source of nanocellulose for ecofriendly material development. The extraction of crystalline nanocellulose from linseed straw fibers involved a combination of sequential chlorine-free chemical and mechanical treatments. Pre-treatments (dewaxing, delignification, alkalization, and bleaching) were carefully designed by incorporating new approaches such as dewaxing with hot water in addition to a toluene–ethanol solvent, delignification utilizing an alkaline–hydrogen peroxide solution as an alternative to chlorine reagents, and additional bleaching treatment involving the use of hydrogen peroxide after delignification. Effective pre–treatment processes enhance the production rate of nanocellulose, hydroxyl group accessibility, inner surface area, and fibrillation process and further alter the crystallinity of the fibers, leading to breaking of the hydrogen bonds in cellulose. During the treatment process, sulfuric acid hydrolysis was used to isolate the crystalline nanocellulose from the micro cellulose by removing the amorphous part. Finally, during the post-treatment process, the samples were repeatedly washed, centrifuged, sonicated, dewatered and dried, followed by acid hydrolysis. The resulting MC and CNC samples were then subjected to a series of characterization techniques to evaluate their morphology, particle size, aspect ratio, specific surface area, crystallinity, crystallite size, thermal stability, and chemical composition in comparison with those of the RF sample using SEM, TEM, XRD, TGA, and FT-IR.
Materials and methods
Materials
RF was extracted from the stalks of linseed straw using water retting, as reported in our recent article. 62 The chemicals utilized in this study were toluene AR (99.9%; Blulux Laboratories Pvt. Ltd., Faridabad, India), ethanol LR (97%; Fine chemical GTP PLC, Addis Ababa, Ethiopia), NaOH LR (98%; Blulux Laboratories Pvt. Ltd., Faridabad, India), H2SO4 AR (98%; Loba Chemie Pvt. Ltd., Mumbai, India), Acetone AR (99.5%; Alpha Chemika, Maharashtra, India), H2O2 LR (30%; Fine chemical GTP PLC, Addis Ababa, Ethiopia) and Deionized water LR (>50 MS; Fine chemical GTP PLC, Addis Ababa, Ethiopia), Urea AR (99%, GHTEC(JHD), Vietnam).
CNCs preparation methods
The procedures used for CNC isolation were pre-treatment, acid hydrolysis treatment and post-treatments64,65, as shown in Figure 1. In the pre-treatment section, the chopped RFs were washed and boiled in hot distilled water for 1 h to remove dust and water-soluble components. Next, the dried fibers were dewaxed with a Soxhlet in toluene–ethanol (2:1) at 98℃ for 4 h 66 to remove minor components, which are referred to as extractives.

Crystalline nanocellulose isolation methods and procedures.
The extractive-free sample was delignified in an alkaline hydrogen peroxide (AHP) solution with a mixture of 5% NaOH and 10% H2O2 at pH 11 67 through constant stirring for 2 h at 90℃ to remove lignin.68,69 In alkaline conditions, H2O2 can act as a nucleophilic agent by forming hydroperoxide anion (HOO−) and reacts with lignin benzene ring and side chains, which decompose phenolic and non-phenolic lignin structures via nucleophilic attack. This mechanism plays a key role in the delignification process by facilitating the degradation and removal of lignin from fibers, ultimately yielding purified cellulose. 70
Then, the delignified sample was alkalized in 17.5% NaOH via constant stirring for 3 h at 80℃ to remove hemicellulose and remaining lignin. 71 The alkalization mechanism involves the swelling of fibers followed by alkaline hydrolysis of hemicellulose ester linkages. NaOH reacts with the ester linkages in hemicellulose, where the hydroxide ions (OH−) from NaOH act as nucleophiles. These ions attack the intermolecular ester bond, which crosslinks xylan (hemicellulose) and lignin, breaking them down. This process leads to the solubilization and removal of hemicellulose and residual lignin from the fiber matrix. 72
Finally, the sample was bleached in 3% H2O2 at a pH adjusted to 11 for 2 h at 90°C using a water bath to remove colored impurities by oxidizing chromophores, as well as the remaining residual lignin after delignification and alkalization. 73 Then, the residue was oven-dried at 60℃ to obtain a dry purified MC. 74
The purified MC was hydrolyzed in 64% H2SO4 (1 g:15 mL), which is the most commonly used concentration and is generally regarded as the optimal value75,76 by stirring for 60 min at 45℃ in a water bath to hydrolyze the amorphous cellulose, reduce its size to nanoscale and rearrangement of the crystalline components.77,78 Finally, during the post-treatment processes, the hydrolyzed cellulose was diluted to a 4% concentration by adding 10-fold distilled water and centrifuging at 10,000 rpm for 15 min to remove acidic solution and sonicated for 10 min in an ice bath to avoid overheating. 79
To reduce the agglomeration of CNCs during dewatering and drying, the solvent exchange method was implemented. This involved utilizing volatile organic solvents acetone and toluene to replace the water in the precipitation. The CNC gel was first dispersed in acetone, centrifuged, re-dispersed in toluene and centrifuged again. Finally, the obtained CNC and toluene mixture was precipitated and dried into pure CNC powder using an oven at 60℃.80,81
Characterization and analysis methods
Yield determination
The yield of CNCs were estimated gravimetrically following successive isolation of CNCs from the purified MC using equation (1). 52

where Y is the yield of CNCs, WCNC is the dry weight (g) of CNCs and WMC is the dry weight (g) of MCs.
Scanning electron microscopy (SEM)
A field emission gun scanning electron microscope (FEG-SEM, Gemini SUPRA 35VP (ZEISS) (Carl Zeiss, Jena, Germany)) was utilized to investigate the morphology and size of the MC sample obtained from the SEM images. Measurements of the MC sizes and distribution were performed using ImageJ (V1.8.0) and Origin (V9.95) software, respectively.
Transmission electron microscopy (TEM)
A field emission transmission electron microscope (FE-TEM, JEOL JEM-F200, Tokyo, Japan) was used to examine the length, diameter, aspect ratio and size and distribution of the CNCs, which were measured using ImageJ (V1.8.0) and Origin (V9.95) software, respectively.
X–ray diffraction (XRD)
Structural and phase analyses of the samples (RF, MC, and CNC) were implemented using an X-ray diffractometer (XRD 7000S, Shimadzu, Japan) with Cu-Kα radiation (wavelength of 1.5405 Å) and step-scan mode (2θ range: 5°–80°, at a scan speed of 3°/min). The crystallinity index (CrI) of each sample was calculated according to the Segal et al. method, and the mean size of the crystallites was estimated using the Debye–Scherer equation, as shown in equations (2) and (3), respectively.82,83

where CrI is the crystallinity index, I200 is the maximum peak intensity corresponding to the crystalline region at the (200) lattice plane around 2θ = 22° and IAm is the peak intensity of the amorphous region at approximately 2θ = 18° between planar reflections (110) and (200). 84

where D is the average crystallite size, β is the line broadening in radians, θ is the Bragg angle, λ is the X-ray wavelength, and k is the Scherrer constant.
The Z-discriminant function (Z) developed by Wada and Okano for the determination of the cellulose crystalline structure (monoclinic and triclinic) in natural fibers was used. By employing discriminant analysis, it is possible to categorize cellulose as type Iα or Iβ. The Z value indicates whether cellulose is dominant in the Iα or Iβ type. When Z > 0 that indicates Iα-rich, while Z < 0 indicates Iβ-dominant. The function that discriminates between Iα or Iβ is given by equation (4). 85

where d1 and d2 are the d-spacings of the peaks at the (1–10) and (110) lattice planes, respectively.
The contents of CI and CII were calculated by using equations (5) and (6), respectively. 86


where ∑A CI and ∑A CII are the sums of peak areas corresponding to CI and CII, respectively.
According to the hypothetical nanocellulose cylinder model, the specific surface area was calculated by equation (7). 87
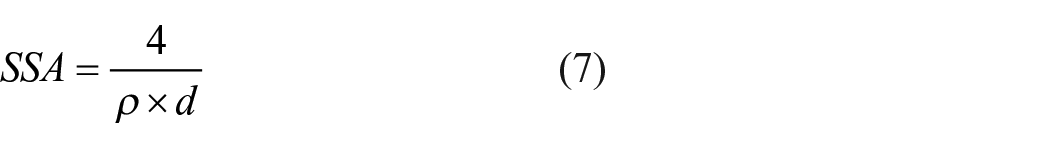
where SSA is the specific surface area (m2/g), d is the CNC particle size (nm), and ρ is the CNC density (g/cm3).
Viscosity, molecular weight and degree of polymerization measurement
The solvent used for measuring viscosity was made by mixing 6 wt.% NaOH and 4 wt.% urea with 100 mL of distilled water. MC and CNC, weighing 4 × 10⁻³ g/mL, were dispersed in this solvent, stirred for 15 min, and then refrigerated at −4°C for 12 h. The frozen solid was dissolved and vigorously stirred at room temperature to produce a solution. The viscosity of the MC and CNC solutions was then measured at 25°C using an Ubbelohde viscometer 50101, Cap.–no.0a, Schott instruments, Mainz, Germany.88,89 The intrinsic viscosity (η), was estimated in mL/g using equation (8).90,91

where η is the inrinsic viscosity, ηr is the relative viscosity (η/η0 = t/t0), t is the time flow of solution, t0 is the time flow of solvent, and C is the concentration.
The average molecular weight (Mw) was esitimated using Mark–Houwink Equation shown in Equation (9).92,93

where η is the intrinsic viscosity, Mw is the average molecular weight, K is the Mark–Houwink constant (2.45 × 10⁻²), and α is the Mark–Houwink exponent (0.815) for NaOH/urea solvent. 88
The average degree of polymerization was calculated using equation (10). 94

where DP is the average degree of polymerization, 162 (g/mol) is the molecular weight of glucose unit.
Fourier transform infrared spectroscopy (FT-IR)
Fourier transform infrared (FT-IR) spectroscopy was performed using a PerkinElmer Spectrum 65 FT-IR spectrometer (USA). Prior to this analysis, all the samples (RF, MC, and CNC) were ground and subsequently mixed with KBr to prepare homogeneous suspensions, pressed into transparent pellets and analyzed in transmittance mode within the range of 4000–400 cm−1 at room temperature.
Thermo-analytical methods
Thermogravimetric analysis (TGA) was used to analyze the thermal decomposition properties of raw fiber, micro cellulose and crystalline nanocellulose using TGA/DTG (Differential Thermo Gravimetry) (DTG–60H, Shimadzu, Japan). The samples were heated from room temperature to 800°C with heating rate of 15°C/min in a nitrogen atmosphere flow rate of 50 mL/min.
Results and discussion
Morphology and size analysis of the MCs and CNCs
The morphologies and size distributions of the obtained MCs and CNCs were characterized by SEM and TEM, respectively. Micro sized MC fibers with a mean diameter of 14.61 ± 6.77 µm were observed in the SEM images shown in Figure 2. However, the MC length is several micro meters, as the fibril ends are not apparent in the SEM micrographs. The extracted size of the MC was compared with the acceptable diameter range (10–15 μm) according to standardized terms for cellulose nanomaterials (TAPPI WI3021). Moreover, the diameter of the MCs extracted from linseed straw fiber was compared with that of the MCs derived from other sources using different methods, such as olive fiber (156.06 μm), 95 sisal (22.0 ± 9.2 μm), 96 coconut palm leaf sheath (10–15 μm), wheat straw (10–15 μm), soy hull (10–15 μm), 97 rice straw (6.6–10.8 μm), and corn stalks (5.8–7.5 μm). 98

SEM images of MC at different resolutions: (a) 10 μm, (b) 20 μm, and (c) 100 μm.
The morphological structure of MC consists of separated individual fibers during chemical treatment, resulting in the formation of cellulose fibrils. Furthermore, the removal of non-cellulosic constituents by pre–treatment cleaved the fibers into smaller sizes. The SEM images of MC show the removal of amorphous materials from the raw fiber after chemical pre–treatments, and these observations support the FT-IR and XRD results.
Nanosized CNC fibers with an average diameter of 7.06 ± 1.95 nm, length of 66.14 ± 28.58 nm, and aspect ratio of 10.02 ± 4.87 were observed in the TEM images shown in Figure 3. The results obtained in this study were compared to established industry standards and relevant literature to assess their conformity to expected ranges. According to standardized terms for cellulose nanomaterials (TAPPI WI3021), the acceptable ranges for the CNC diameter and aspect ratio are 3–10 nm and 5–50, respectively. Additionally, it was compared with the reported studies of CNC sizes (diameter, length and aspect ratio) extracted from different sources, such as from sisal (10 ± 5 nm, 403 ± 159 nm and 40), 99 white coir (8 ± 3 nm, 172 ± 88 nm and 22 ± 8), 100 corncob (4.15 ± 1.08 nm, 210.8 ± 44.2 nm and 53.4 ± 15), 101 soy hulls (2.77 ± 0.67 nm, 122.66 ± 9.4 nm and 44), 102 rice straw (11.2 nm, 117 nm and 10.5) 103 and kenaf (12 ± 3.4 nm, 158.4 ± 63.6 nm and 13.2). 104

TEM images of crystalline nanocellulose at different resolutions: (a) 50 nm, (b) 100 nm, and (c) 200 nm.
The calculated specific surface areas of RF, MC and CNC were 0.02, 0.18, and 377.71 (m2/g), respectively. This indicates that the specific surface area can increase with decreasing CNC diameter. 105 The yield of the isolated CNCs from MC was 79.87 ± 1.35%. Similarly, yields (%) of CNCs isolated from different sources, such as teff straw (50.0 ± 3.32%), enset fiber (70.0 ± 1.49%), sugarcane bagasse (64.0 ± 2.79%), and coffee hull (25.0 ± 2.11%), were reported. 52
Figure 4 shows the size distributions (diameter, length, and aspect ratio) of the extracted MCs and CNCs using a histogram. According to the normality test, the diameter and aspect ratio were significantly drawn from a normally distributed population at the 0.05 level. Only the length distribution of the CNCs did not seem to be normally distributed at the mentioned level. Most distributions seemed to be properly fitted with the normal function.

Histograms with skew normal fits of the size distributions of: (a) diameter, (b) length, (c) aspect ratio for CNCs, and (d) diameter for MCs.
Figure 5 shows the crystalline lattice and its profile plot of rod–like CNC with a lattice spacing of 0.35 nm (3.54 Å), prepared by an inverse fast Fourier transform of a masked fast Fourier transform technique from a high resolution (HRTEM) image. The result is comparable with the mean lattice spacing result of 0.36 nm that obtained from the XRD.
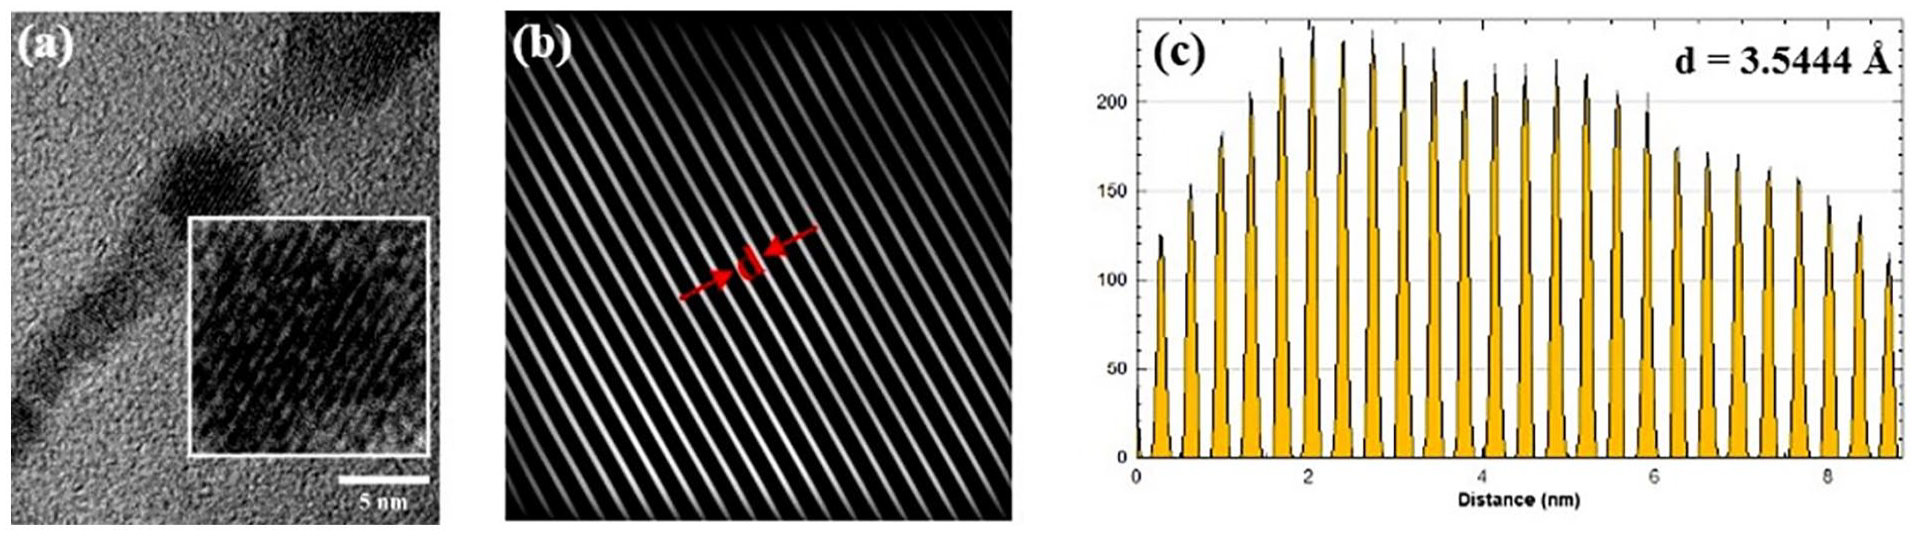
Measurement of the d-spacing from the: (a) HRTEM image, (b) d-spacing, and (c) profile plot.
Viscosity, molecular weight and degree of polymerization
The average intrinsic viscosity (η), molecular weight (MW), and degree of polymerization (DP) of the obtained MC and CNC were investigated to determine the influence of the hydrolysis on the cellulose chains. The measured and calculated values of η, MW, and DP of the MC sample were 134 mL/g, 3.85 × 10⁴ g/mol and 238, respectively. Similarly, the values for the CNC were 90 mL/g, 2.36 × 10⁴ g/mol and 146, respectively.
These results show a significant decrease in viscosity, molecular weight and degree of polymerization during the preparation of CNC due to full or partial depolymerization of the cellulose chains by hydrolysis. Another study reported the average intrinsic viscosity and molecular weight of cellulose extracted from cotton linters and dissolved in 6 wt.% NaOH/4 wt.% urea aqueous solution with different concentrations, in the ranges of 112–332 mL/g and 3.22–12.86 × 10⁴ g/mol, respectively. 88 Similarly, different reports investigated a decrease in DP from 219 to 144 and from 750 to 67.5 during the preparation of spherical nanocellulose from waste cotton fabrics 90 and cellulose nanofibers from curaua fibers, 106 respectively.
FT-IR analysis
The FT-IR spectra of RF, MC, and CNCs are shown in Figure 6. The general profiles of all the spectra of the samples are comparable and similar due to the consistent chemical structure of cellulose, which is the main component of plant cell walls. This uniform structure leads to similar vibrational modes and characteristic peaks in the FT-IR spectra. 107 However, subtle differences can still exist, such as shifts in peak positions, changes in peak intensities, variations in peak shapes, and the appearance and/or disappearance of peaks in the FT-IR spectra. The observed broad absorption bands at approximately 3408, 3411, and 3443 cm−1 for the RF, MC, and CNC samples, respectively, were attributed to O–H stretching vibrations in cellulose and hemicellulose. 108 The absorption bands were observed in all the spectra, revealing the principal functional groups found in the lignocellulosic materials. 107

FT-IR spectra of: (a) RF, (b) MC, and (c) CNC samples.
However, an intense peak was observed for CNCs due to hydrolysis, which reflects hydrophilic properties.109,110 The other peaks shown at 2918, 2920, and 2923 cm−1 indicate asymmetric C–H stretching vibrations in cellulose and hemicellulose. The sharper band and increase in peak intensity shown in the CNC sample at 2923 cm−1 are due to the removal of amorphous cellulose and an alteration of crystalline cellulose by acid hydrolysis. 111 Similarly, the small peaks observed at 2858, 2855, and 2857 cm−1 are attributed to the aliphatic chains of suberin and are attributed to symmetric C-H stretching vibrations. 112
The absorbance band within 1733 cm−1 is attributed to the C=O stretching of methyl ester and carboxylate groups in pectin, the acetyl and uronic ester groups of the hemicelluloses or to the ester linkage of the carboxylic group of the ferulic and p-coumaric acids of lignin and hemicelluloses. 113 This peak strongly decreased for the MCs and CNCs due to the removal of these constituents during the pre–treatment process.
In all the sample spectra, the peaks at 1631, 1634, and 1636 cm−1 correspond to the O-H bending of adsorbed water due to the strong interactions between cellulose and water molecules and difficulty in removing the adsorbed water, even after an appropriate drying process.107,114 The absorbance peak observed at 1430 cm−1 was associated with CH2 and O-CH in-plane bending vibrations in cellulose. 115 The decrease in peak intensity and shift to 1456 cm−1 may be due to the alteration of the cellulose structure after hydrolysis. The absorption peaks at 1246 and 1280 cm−1 are attributed to the C-O stretching vibration of the aryl group in lignin. 116 The peaks are diminished and disappear from the MC and CNC spectra, respectively, due to the removal of lignin.
The absorbance peak at 1060 cm−1 was attributed to the C-O-C pyranose ring vibration in cellulose. 110 The intensity of this peak is very sensitive to the amount of crystalline versus amorphous structure of cellulose, and the broadening of this band reflects more disordered structures, 117 as shown in the RF and MC samples. The peak corresponding to the CNCs was significantly lower than that corresponding to the other samples, possibly due to the removal of amorphous cellulose after hydrolysis. The subtle peaks at 893 and 900 cm−1 were attributed to the β-1,4 glycosidic bond vibrations in amorphous cellulose. These linkages give cellulose a very long, straight chain conformation, and the disappearance of these peaks after hydrolysis may be related to the destruction of the bond and removal of amorphous cellulose.117,118 The absorbance peak at 612 cm−1 reveals O-H out of plane bending in native cellulose Iβ and Iα. However, due to the different hydrogen bonding strengths of native cellulose Iβ and Iα, their O-H out-of-plane bending bands differ. 119
XRD analysis
The XRD patterns of the RF, MC, and CNC samples are shown in Figure 7. Generally, all the samples exhibited similar patterns of four characteristic peaks with different peak intensities. The samples showed main diffraction signals at 2θ values of approximately 14°, 16°, 22°, and 34° with assigned crystallographic planes of 1–10, 110, 200, and 004, respectively.

XRD spectra of: (a) RF, (b) MC, and (c) CNC samples.
Table 1 shows the CrI (%), mean crystallite size (nm), mean d-spacing (nm), Z values and cellulose polymorph (Iα, Iβ, CI, and CII) contents of all the samples obtained from XRD analysis. The calculated CrI (%) for the RF, MC, and CNC samples were 76.71%, 80.78%, and 73.29%, respectively.
Parameters obtained from the XRD analysis of the RF, MC, and CNC samples.
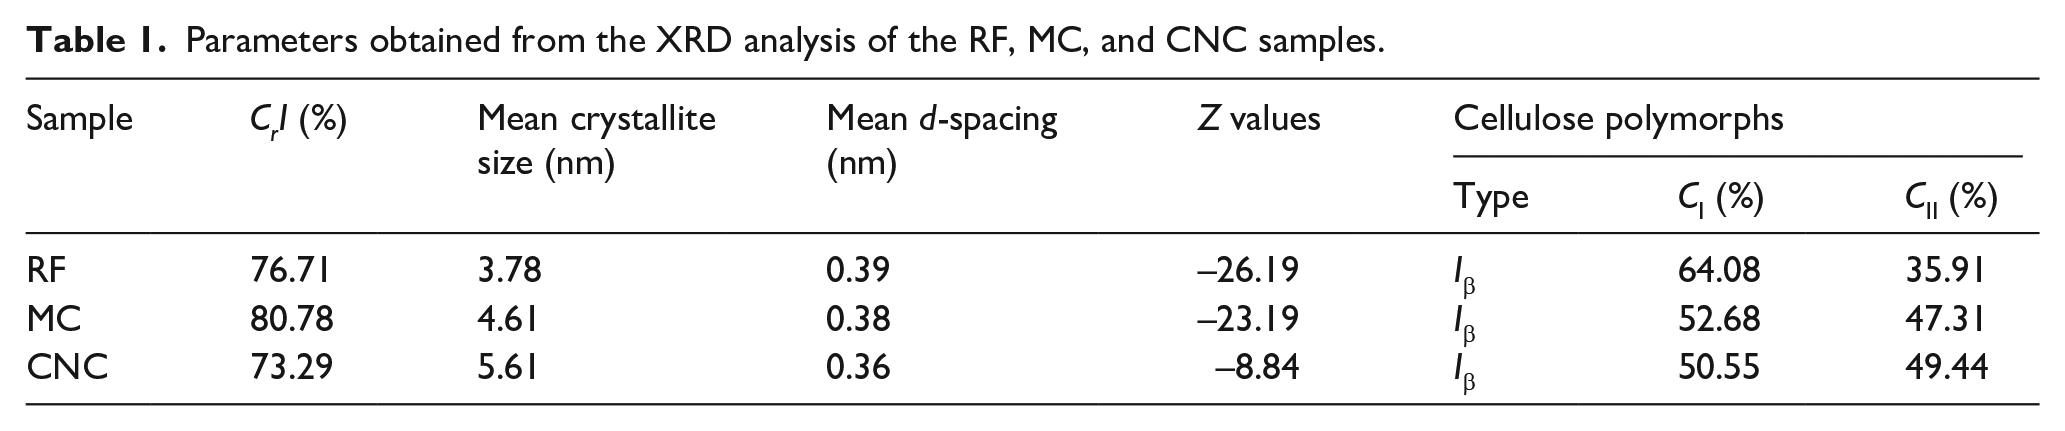
These results are comparable to those of other sources of MC and CNC, such as MC and CNC from teff straw (78.00% and 76.61%), enset fiber (85.56% and 83.41%), sugarcane bagasse (80.92% and 82.60%), coffee hull (77.59% and 80.86%), and commercial cellulose (87.23% and 74.91%). 52 A slight reduction in the crystallinity of CNCs may occur upon strong acid hydrolysis of highly pure and crystalline micro cellulose, indicating that the amorphous regions were already degraded during the pre–treatment processes and that the acid started to partially attack the crystalline portions.52,120
The d-spacings d1 and d2 of RF (0.58 and 0.52 nm), MC (0.59 and 0.52 nm) and CNC (0.60 and 0.530 nm) for the planes 1–10 and 110, respectively, were used for Z value calculations. The Z values for the RF, MC, and CNC samples were −26.19, −23.19, and −8.84, respectively. The results indicated that the monoclinic structure (Iβ-type cellulose) is dominant in both samples, which is supported by the negative numbers since the Iβ type is the dominant polymorph for plant fibers and the Iα polymorph can be converted into Iβ by treatments.52,121
The polymorph of native cellulose is rich in the CI type. After treatment, cellulose crystallizes into various polymorphs (CI, CII, CIII, and CIV) with different packing arrangements. 122 For the MC and CNC samples, a significant conversion to higher CII contents of 47.31% and 49.44%, respectively, was observed compared to that of the RF sample, which had a lower CII content of 35.91%. Furthermore, the XRD pattern of the MC sample reveals the appearance of doublet peaks at 2θ values of 20.6° and 12.6°, corresponding to the (110) and (1–10) planes, respectively. Similarly, these peaks, with increased intensity, were observed in the CNC sample at 2θ values of 19.98° and 12.16°, corresponding to the (110) and (1–10) planes, respectively, which are indicative of CII.86,122 This polymorphic transformation may lead to improved properties of composites reinforced with micro/nano crystals extracted from a mixture CI and CII due to the enhanced hydrogen bonding. 123
The calculated mean crystallite sizes and d-spacings of RF (3.78 and 0.39) nm, MC (4.61 and 0.38) nm, and CNC (5.61 and 0.36) nm were obtained. After the pre-treatment and acid hydrolysis processes, the mean crystallite size increased, but the d-spacing decreased. This indicates that the treatment processes can reclose the distance between cellulose fibers to produce a more compact fiber structure. Generally, the shorter the distance between cellulose chains is, the greater the size of the crystallite formed. An increase in crystallite size led to recrystallization of the cellulose chains through hydrogen bonding. 124
Thermal analysis
The thermal properties of the RF, MC, and CNC samples were investigated via thermogravimetric methods. The TGA/DTG/DTA patterns of all the samples are shown in Figure 8, and the thermal analysis data are summarized in Table 2. For the raw fibers, thermal decomposition occurred in three main steps. This phenomenon can be found in other reports related to lignocellulosic materials. 125 The first weight loss, recorded below 200°C, corresponds to the evaporation of absorbed moisture. The second weight loss, which occurs above 180°C until approximately 375°C, resulted mainly from the thermal decomposition of hemicelluloses and some portion of lignin.

(a) TGA (b) DTG and (c) DTA curves of the (a) RF (b) MC and (c) CNC samples.
TGA/DTG data obtained for RF, MC and CNC samples.

The last stage in the high-temperature range (375°C–517°C) was associated with the degradation of cellulose and lignin. In this temperature range, almost all the cellulose components decomposed. However, lignin is the most difficult to decompose because of the presence of phenyl groups, and its decomposition extends to the whole temperature range, starting below 200°C and continuing to increase to 700°C. 125
Similarly, the degradation of MC was a three-step process. A minor weight loss at approximately 200°C corresponds to moisture loss by evaporation. The second decomposition stage at a temperature of 200°C–370°C was related to amorphous cellulose, and the third decomposition stage at a temperature of 370°C–520°C corresponds to crystalline cellulose. Typically, the CNC sample exhibited three main degradation stages. The first stage involves the loss of moisture content below 124°C. The second stage involves the degradation of the amorphous regions of cellulose at a temperature of 124°C–256°C, which can be attributed to the breaking of glycosidic bonds of amorphous cellulose, sulfate half ester groups and large specific surface area of CNC chains. The third stage involves the thermal degradation of the interior non–sulfated and large crystallite size nano cellulose crystals at a temperature of 256°C–520°C. 126
From the summarized results shown in Table 2, the onset degradation temperature, decomposition temperature range, weight loss (%), and peak decomposition temperature of the samples are different due to the difference in type, structure, size and content of chemical compositions present in the samples. The onset degradation temperatures of the RF, MC, and CNC samples are at 180°C, 200°C, and 124°C, respectively.
The results showed that the onset degradation temperature of the MC sample was higher than that of the RF and CNC samples due to the removal of non-cellulosic components. However, the lowest onset decomposition temperature of the CNCs sample exhibited might be associated with the introduction of the negatively charged sulfate half ester groups, larger number of free ends of chains, smaller size and larger specific surface area of CNCs. These factors lead to faster heat transfer and lower activation energy.127,128 This condition was also observed in MCs and CNCs extracted from different sources, such as teff straw (207°C and 134°C), enset fiber (210°C and 133°C), sugarcane bagasse (199°C and 139°C), coffee hull (282°C and 134°C), and commercial cellulose (268°C and 142°C), respectively.
The maximum weight loss more than 50% of the weight of the RF and MC samples decomposed during the second stage of degradation at 180°C–375°C and 200°C–370°C, respectively.
However, for the CNC sample a maximum weight loss more than half of its weight was observed during the third stage decomposition at a wider range of temperature from 256°C to 520°C. The peak decomposition temperatures for the RF, MC, and CNC samples were 344°C, 355°C, and 515°C, respectively. The results indicated that the peak decomposition temperature for CNCs was higher than that for RF and MC samples due to the greater crystallite size. 129
The reported peak decomposition temperatures for raw fibers, micro cellulose and nanocellulose extracted from different sources were coconut husk fiber (368°C, 389°C, and 322°C), Nypa fruticans trunk (361°C, 400°C, and 207°C) and rice husk (375°C, 370°C, and 286°C), respectively. 130 At the end of the pyrolysis process, the residue remaining at 800°C depends on the lignocellulosic resources and their forms (raw fiber, micro cellulose, and nanocellulose). 130
The final residue weights (%) at 800°C for the RF, MC, and CNC samples were 4.50%, 3.65%, and 3.98%, respectively. The relatively greater residue of RF compared to that of MC and CNC is due to the presence of more ash in the raw fibers. 131 However, the slight increase in residue (%) for the CNC sample compared to the MC sample is due to a dehydration effect of the sulfate group as flame retardants. 132 In general, the residue weights of all the samples were relatively small compared to those in the reported studies of raw fibers, micro cellulose and nanocellulose extracted from different sources, namely, nypa fruticans trunks (30.9%, 11.9%, and 25.9%), rice husks (29.2%, 17.7%, and 21.1%), and coconut husk fibers (23.7%, 11.9%, and 13.9%), respectively.130,131 The low residue indicates the effective removal of the non-cellulosic components, as well as a low percentage of these constituents present in the raw fiber. 133
Conclusion
In conclusion, this study demonstrates the potential of linseed straw fibers as a sustainable source for the isolation of crystalline nanocellulose (CNC). Through sequential chlorine-free chemical and mechanical treatments, CNC was successfully extracted from linseed straw, offering a viable alternative to the environmental issues caused by the burning or disposal of this agricultural waste. The isolated CNC exhibited desirable characteristics, including a high yield, small particle size, rod-like morphology, good molecular weight and good thermal stability. These findings highlight the feasibility of utilizing linseed straw fibers as a valuable resource for the production of CNC, which could be utilized as an effective filler in polymer composites, contributing to the development of eco-friendly materials. Furthermore, the comprehensive characterization of the isolated CNC, including its morphology, particle size, aspect ratio, crystallinity, crystallite size, cellulose polymorph, thermal properties, and chemical composition, compared to raw fiber (RF) and micro cellulose (MC), provides valuable insights into its potential applications. The results indicate that the CNC derived from linseed straw fibers has favorable properties for various industrial applications, particularly in the development of bio-composites and other advanced materials. Overall, this study underscores the importance of utilizing agricultural waste, such as linseed straw fibers, as a renewable and sustainable source for the production of high-value nanocellulose materials. By converting waste into a valuable resource, this approach contributes to reducing environmental impact and promoting the development of eco-friendly technologies.
Footnotes
Declaration of conflicting interests
The author(s) declared no potential conflicts of interest with respect to the research, authorship, and/or publication of this article.
Funding
The author(s) received no financial support for the research, authorship, and/or publication of this article.