
Abstract
Fiber friction behaviors are crucial for understanding the ubiquitous frictional damage phenomena in the manufacturing and service processes of multiscale textile reinforcements. This paper investigates the influence of relative velocity and applied load on the frictional behavior between a solitary glass fiber filament and a metal roller. The results of piecewise regression analysis indicate that the apparent coefficient of friction initially decreases with relative velocity, followed by an increase, and subsequently decreases again until stabilizing at higher velocity. Specifically, the maximum values of the coefficient of static friction are observed within the relative velocity range of 1.26–1.68 mm/s, while that of dynamic friction occurs within the range of 0.84–3.94 mm/s; the coefficient of friction reaches stable values within the relative velocity range of 7.87–15.71 mm/s. Under four different tension conditions, the stable values for the coefficient of static friction are 0.336, 0.308, 0.321, and 0.281, while the coefficient of dynamic friction are 0.291, 0.269, 0.273, and 0.232 respectively. Furthermore, the relationship between the coefficient of friction and the applied load reveals that the coefficient of friction decreases as the load increases. Finally, quantitative investigation reveals a strong coupling characteristic between the velocity dependency and load dependency of the apparent coefficient of friction.
Introduction
In recent years, the global spread of COVID-19 has significantly impacted the economic development of nations worldwide, and the manufacturing industry is grappling unprecedented challenges. Reducing production costs is unquestionably a vital strategy for small and medium-sized enterprises to seek and sustain their vitality in the crevices. In the case of textile composites, ensuring the quality and performance of the reinforcements, such as fibers and textiles, is an effective means of achieving cost control. 1 Friction, as a mechanical behavior throughout the entire process of the production, manufacturing, and use of fibers and their textiles, profoundly affects the surface properties and structural stability of fibers, yarns, and fabrics, which determines the quality and performance of multi-scale textile reinforcements and formed composites.2 –5
Take the weaving process as an example. In the case of using glass fibers in the weaving process, the tensile strength of the warp yarn is reduced by some 30% after the entire weaving process, of which nearly 23% of the attenuation occurs in the let-off and tensioning stages, which is largely attributed to the friction between the yarn and guiding mechanisms (such as warp beams, yarn guides, etc.).3,4 Furthermore, fiber, as the basic unit that constitutes the yarn, its damage and fracture during yarn friction should be the main reason for the degradation of yarn’s mechanical properties. Specifically, at the fiber level, the friction between the fiber and the metal produces scratches on the fiber surface, resulting in a degradation of the tensile strength of fiber monofilament, thereby leading to a decrease in the mechanical properties of the yarn. Studies by Rudov-Clark et al. showed that friction during the weaving process can theoretically cause scratches with a depth of 0.18 μm on the surface of glass fibers. 4 At the yarn level, yarn tension that is too high causes excessive friction between the yarn and the metal surface, which leads to the breakage of the surface fibers, thereby reducing the yarn performance. This inference is supported by evidence that approximately 5%–7% of the fibers on the surface of the yarn are broken due to the friction in the weaving process. 4 Consequently, investigating the frictional behavior of fibers is of great significance to ensure the quality and performance of multiscale textile reinforcements and the composites materials formed from them.
Frictional behavior between a single fiber and the surfaces of tool made from other materials, such as metal, is an important component of fiber friction. Numerous experimental studies have been conducted over the past few decades to investigate the influence of test and environmental conditions on the coefficient of friction between fibers and tools. The results show a pronounced dependency of the frictional behavior of fibers on test conditions. Specifically, the coefficient of friction decreases as the normal load increases,6 –9 while the effect of relative velocity shows an opposing trend, namely, the coefficient of friction increases with higher velocity. 8 The influence of tool surface roughness has also been studied, and consistent research results demonstrate that the coefficient of friction of the fiber on a smooth surface is higher than that on a rough surface.6,7 Wang et al. pointed out in their study that the coefficient of dynamic friction between the fiber and the tool decreases with increasing fiber diameter, both in air and water media, while there is no apparent size-dependent behavior in liquid nitrogen.9,10 The abovementioned studies qualitatively analyzed the influence of various factors on the frictional behavior of fibers, and the findings are helpful in knowing the frictional peculiarities of fiber products. However, due to the lack of in-depth exploration of the quantitative relationships between tribological parameters, such as the coefficient of friction, and the influencing factors, the research results fall short of guiding process parameter quantitative adjustments.
The above studies fully demonstrated the complexity of the frictional behavior in flexible fibers. As a high-performance fiber and the preferred reinforcement material for textile composites, glass fiber’s friction characteristics and its occurrence mechanisms are far from being fully understood. On that account, this paper investigates the effects of relative velocity and applied load on the frictional behavior between a single glass fiber filament and metal roller based on the constructed friction measurement apparatus using the Capstan method. Subsequently, it quantitatively analyzes the characteristics of the dependence of the apparent coefficient of friction on relative velocity and applied load using the experimental results.
Materials and methods
Materials
Friction experiments were conducted on a 24 μm-diameter glass fiber filament extracted from an untwisted glass fiber tow. The microscopic image of the fiber is illustrated in Figure 1. The fiber possesses a density of 2620 kg/m3.

Photograph of glass fiber sample taken by Digital Microscope System VHX-6000.
Experimental methods
The frictional behavior of the glass fiber filament was investigated using the Capstan measuring method, which is a standardized method for measuring the coefficient of friction between yarn and solid materials. 11 Different specific test rigs designed based on the Capstan method are widely employed in the investigation of the frictional behavior of multiscale textiles.8,12 –14 As depicted in Figure 2, for the measurement setup designed following the Capstan method, a tested fiber sample is pulled over a roller with a wrap angle of θ rad. An initial tension, denoted as T1, is applied to the fiber sample using a dead weight attached to one end of the sample. When the roller rotates at a speed of n, the frictional force between the fiber sample and the roller surface developed by the normal force generated by the initial tension T1, makes the tension at the other end of the sample measured by the tension sensor, denoted as T2, to be greater than initial tension T1. Subsequently, the apparent coefficient of friction, denoted as μapp, is used to characterize the frictional behavior of the fiber on the roller. This coefficient is calculated with the Capstan equation:


Schematic description of the Capstan method for friction characterization of glass fiber.
Table 1 lists the relevant parameters of the friction experiments. Tests were conducted at eight different rotation speeds of the roller (0.5, 1, 2, 3, 4, 9.4, 18.8, and 37.5 r/min), which correspond to linear speeds of the roller surface of 0.21, 0.42,0.84, 1.26, 1.68, 3.94, 7.87 and 15.71 mm/s. The four distinct applied load values selected are 50 × 10−3, 100 × 10−3, 150 × 10−3, and 200 × 10−3cN, which were achieved by attaching different dead weights. Each test was repeated for at least ten times. Typic frictional behavior for a single glass fiber filament is illustrated in Figure 3. This curve clearly demonstrates that the frictional behavior of flexible fibers is very similar to the Coulomb/Amonton friction of a rigid body. Consequently, in this paper, the peak point at the initial phase of the friction curve is designated as static friction, and the mean value of sampled signals during the stable phase of the curve over a 5 s interval is considered dynamic friction.
Experiment parameters.


Typic frictional behavior of single glass fiber filament on metal.
Results and discussion
Effect of the relative velocity on the fiber filament friction
Figure 4 shows the evolution of the apparent coefficient of friction between the glass fiber filament and the metal roller with relative velocity at four different applied loads. The error bands in the graph indicate the standard deviation of the measurement results. In this paper, the apparent coefficient of static friction and dynamic friction are denoted as μapp-s and μapp-d, respectively.

The apparent coefficient of friction between glass fiber and metal roller varies with relative velocity at different applied loads: (a) G = 50 × 10−3 cN, (b) G = 100 × 10−-3 cN, (c) G = 150 × 10−3cN, and (d) G = 200 × 10−3 cN.
A commonplace friction response is observed that the apparent coefficient of static friction of glass fiber filament is greater than that of dynamic friction. Furthermore, a unique general trend is observable in Fig.4: the apparent coefficient of friction between the glass fiber filament and the metal roller increases first and then decreases with the relative velocity before reaching a stable value. Under four different applied load conditions, the maximum values of μapp-s are all obtained with a relative velocity in the range of 1.26–1.68 mm/s, and that of μapp-d are obtained with the relative velocity in the range of 0.84–3.94 mm/s. Then, both μapp-s and μapp-d reach stable values in the range of relative velocities from 7.87 to 15.71 mm/s. Table 2 lists the maximum values of μapp-s and μapp-d under four diverse applied load conditions in detail. Moreover, under the first three applied load conditions (i.e. 50 × 10−3, 100 × 10−3, and 150 × 10−3 cN), the apparent coefficient of friction shows a tendency to decrease before increasing to the maximum value, while for the last applied load condition of 200 × 10−3 cN, there is no decreasing tendency.
The maximum values of μapp under four different applied load conditions.
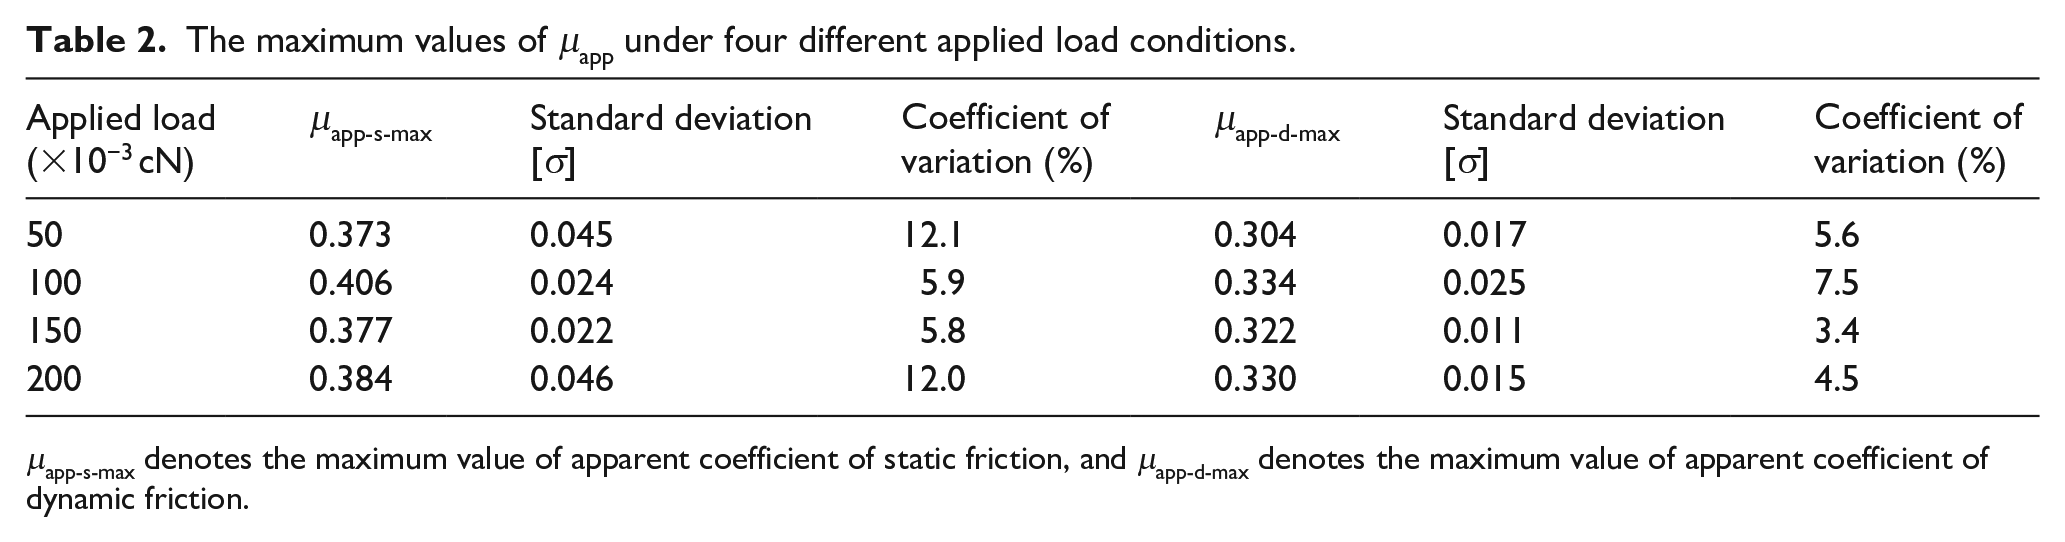
μapp-s-max denotes the maximum value of apparent coefficient of static friction, and μapp-d-max denotes the maximum value of apparent coefficient of dynamic friction.
In summary, the evolution of the apparent coefficient of friction between the glass fiber filament and the metal roller with the relative velocity involves all or part of the following three stages: the initial-decreasing stage, the increasing stage, and the decreasing-to-stability stage. When the relative velocity is low, the decrease of the apparent coefficient of friction in the first stage (i.e. the initial-decreasing stage) with increasing velocity may be ascribed to the rolling friction yielded by the rotation of the fiber filament around itself; in a specific range, as the rotation speed increases, the rolling friction intensifies, resulting in a reduction in frictional force and the apparent coefficient of friction. The increase in the apparent coefficient of friction in the second stage, which is the increasing stage, can be attributed to the viscoelastic properties of the fiber.8,12,15 The schematic illustration of the contact behavior between the fiber and the roller is presented in Figure 5. It can be seen that the filament undergoes extrusion deformation in its cross-section along its radial direction by the normal pressure generated by the applied load on its ends, thereby forming a contact area with the roller surface. When relative motion occurs, the friction between the fiber filament and the roller leads to an elastic deformation of the filament in the contact area along its axial direction (i.e. tangential to the roller). The higher the relative velocity is, the greater the deformation becomes, the shorter the deformation recovery time becomes, and the greater the tension difference between the two ends of the fiber is, the greater the apparent friction coefficient becomes. Finally, after the relative velocity exceeds the critical value (in the range of about 1.26–1.68 mm/s), the decrease in the apparent coefficient of friction in the third stage (i.e. the decreasing-to-stability stage) may be attributed to the entrapped air between the fiber and the roller surface. 16 When the rotation speed of the roller is high, the rotating roller produces a thin layer of air on its surface, which serves as a lubricant and reduces the frictional force and coefficient of friction between the fiber filament and the roller surface.

Schematic drawing of contact behavior between a glass fiber and the roller surface.
Effect of the applied load on the fiber filament friction
Figure 6 presents the apparent coefficient of friction values for different applied loads at relative velocities of 7.87 and 15.71 mm/s, as the friction behavior tends to stabilize within this relative velocity range. The error bars in the graph indicate the standard deviation of the measurement results. It can be seen that a general tendency of the apparent coefficient of friction in response to the applied load is that the apparent coefficient of friction decreases with increasing applied load. Taking the relative velocity configuration of 15.71 mm/s as an example, as presented in Figure 6(b), the apparent coefficient of static friction decreased from 0.345 to 0.261 when the applied load increased from 50 × 10−3 to 200 × 10−3 cN. Similarly, that of dynamic friction decreased from 0.298 to 0.215. In other words, μapp-s and μapp-d decreased by 24.3% and 27.9%, respectively.

Apparent coefficient of friction of glass fiber under different applied loads at different relative velocities: (a) relative velocity of 7.87 mm/s and (b) relative velocity of 15.71 mm/s.
A similar phenomenon has been observed by other researchers, such as Roselman and Tabor in the case of single carbon fiber, 6 Zhang et al. in the context of a nylon monofilament filament, 8 and Wang et al. when examining a metal fiber. 9 As discussed in Section 3.1, when subjected to an applied load, the fiber undergoes cross-sectional deformation and produces contact areas with the roller. Adhesion-shearing theory suggests that the frictional force Ff and the contact area Ac adhere to the relationship: Ff = τAc, 17 where τ represents the interfacial shear strength and is typically considered a constant. Consequently, the evolution of the frictional force with the applied load is contingent on the connection between the real contact area and the applied load. In this context, Cornelissen et al. proposed a mathematical model for the contact area between the fiber and the roller based on the Hertz contact theory. 18 The model reveals that the real contact area between the fiber and the roller exhibits a nonlinear increase with the applied load. Specifically, the proportion of the contact area to the applied load diminishes with increasing applied load. Thereby, the apparent coefficient of friction decreases at higher applied loads.
Characterization model for coefficient of friction of a fiber versus relative velocity and applied load
In order to quantitatively investigate the dependence of the coefficient of friction on the relative velocity and the applied load, all the apparent coefficients of friction against the relative velocity for different applied loads were fitted, and so was the apparent coefficient of friction against the applied load for the relative velocity of 7.87 and 15.71 mm/s.
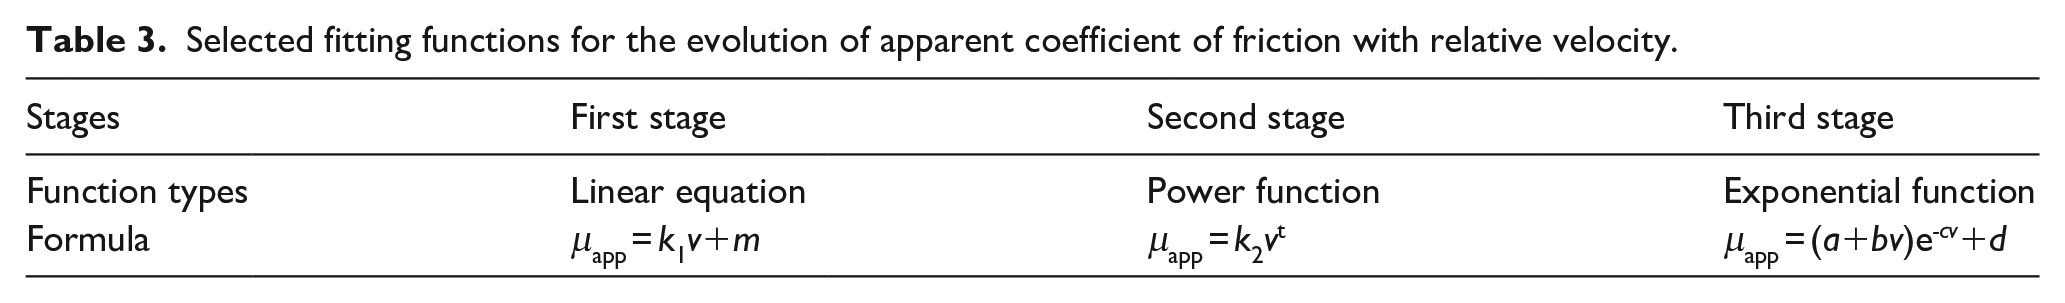
The experiment results obtained in Section 3.1 reveal that the apparent coefficient of friction goes through three stages with increasing relative velocity: the initial-decreasing stage, the increasing stage, and the decreasing-to-stability stage. As can be seen from the curves depicting the relationship between the coefficient of friction and relative velocity in Figure 4, the apparent coefficient of friction in the first stage decreased significantly with the relative velocity, and this behavior is amenable to modeling using the linear equation μapp = k1v+m. In the second stage, where the apparent coefficient of friction escalates with higher relative velocities, a power function in the form of μapp = k2vt was chosen to fit the behavior, since the effectiveness of the power function in characterizing the dependency of the apparent coefficient of friction between the glass fiber tow and metal on relative velocity. 12 Finally, in the third stage, it was discovered that the apparent coefficient of friction decreases with relative velocity in an exponential pattern from the overall trend, hence this behavior can be accurately represented using the function form μapp = (a+bv)e-cv+d. Table 3 lists the selected fitting functions for characterizing the evolution of the apparent coefficient of friction with relative velocity for each stage.
Selected fitting functions for the evolution of apparent coefficient of friction with relative velocity.
As depicted in Figure 7(a), for different applied loads (i.e. 50 × 10−3, 100 × 10−3, 150 × 10−3, and 200 × 10−3 cN), the selected functions effectively capture the evolution of the apparent coefficient of friction against the relative velocity. Furthermore, a detailed analysis of the fitting parameters for each stage was carried out. Firstly, it can be observed from Figure 7(a) that the fitting coefficient m exhibits an overall downward trend with the applied load. Taking the μapp-s as an example, as the applied load increased from 50 × 10−3 cN to 150 × 10−3 cN, the value of the fitting coefficient m decreased from 0.428 to 0.335. This decline indirectly reflects the behavior in which the apparent coefficient of friction decreases with increasing applied load. Next, as shown in Figure 7(b), the fitting coefficient k2 remains numerically stable. The mean values of the fitting coefficient k2 for μapp-s and μapp-d across four load cases are 0.374 and 0.317, respectively, and the coefficient of variation is only 2.8% and 8.4%, respectively. More importantly, for fitting coefficient t, an overall increasing trend with the applied load was observed from Figure 7(b). Finally, the fitting coefficient d, which indicates the asymptotic value of the apparent coefficient of friction as the increasing relative velocity, is approximately equal to the value of μapp-s/μapp-d at the relative velocity of 15.71 mm/s, as presented in Figure 7(c). Furthermore, in this paper, the relative error of μapp-s at the relative velocity of 15.71 mm/s, to d is expressed as δμapp-s = abs(μapp-s − d)/μapp-s × 100%, and that of μapp-d to d is expressed as δμapp-d = abs(μapp-d − d)/μapp-s × 100%. Then, Figure 7(c) reveals that the maximum relative error is less than 10%.

(a) The fitting results of the apparent coefficient of friction as a function of the relative velocity, (b) trend of the fitting coefficient of k2 and t versus to the applied load, and (c) trend of the fitting coefficient of d versus to the applied load.
Models characterizing the relationship between the coefficient of friction and external load for multi-scale textiles have been investigated by many researchers, and the most recognized one is the power function model proposed by Howell and Mazur, represented as μ = k3Gq. 19 Consequently, in this paper, the dependence of the apparent coefficient of friction of glass fiber on the applied load was examined using this power function. Furthermore, the apparent coefficient of friction against the applied load was investigated for four different relative velocities (i.e. 0.21, 1.26, 7.87, and 15.71 mm/s), ensuring the representativeness of the analytical results.
Figure 8(a) indicates that the power function works well in fitting the load dependence of the apparent coefficient of friction of the glass fiber. Notably, at the relative velocity of 1.26 mm/s, the apparent coefficient of friction increases with the applied load, which deviates from the results at the other three relative velocities. Subsequently, the more in-depth information of the fitting parameters was analyzed, and these parameters were plotted against the relative velocity, as shown in Figure 8(b). It is evident that the fitting parameter k3 decreases first and then increases as the relative velocity increases, with a more rapid rate of growth in the initial phase of increase. Conversely, the fitting parameter q follows an opposite trend to k3, that is, as the relative velocity increases, q first increases and then decreases, and the rate of decay is faster at the initial phase of decrease. More importantly, a majority of the values of q are minus, which reflects the decaying extent of the apparent coefficient of friction under increasing applied loads. A higher q value indicates a smaller absolute value, signifying a slower decay in the apparent coefficient of friction. Therefore, from Figure 8(b), it can be observed that there exists a specific relative velocity condition where the value of q is 0, which signifies that the apparent coefficient of friction is not affected by the applied load under this particular relative velocity.
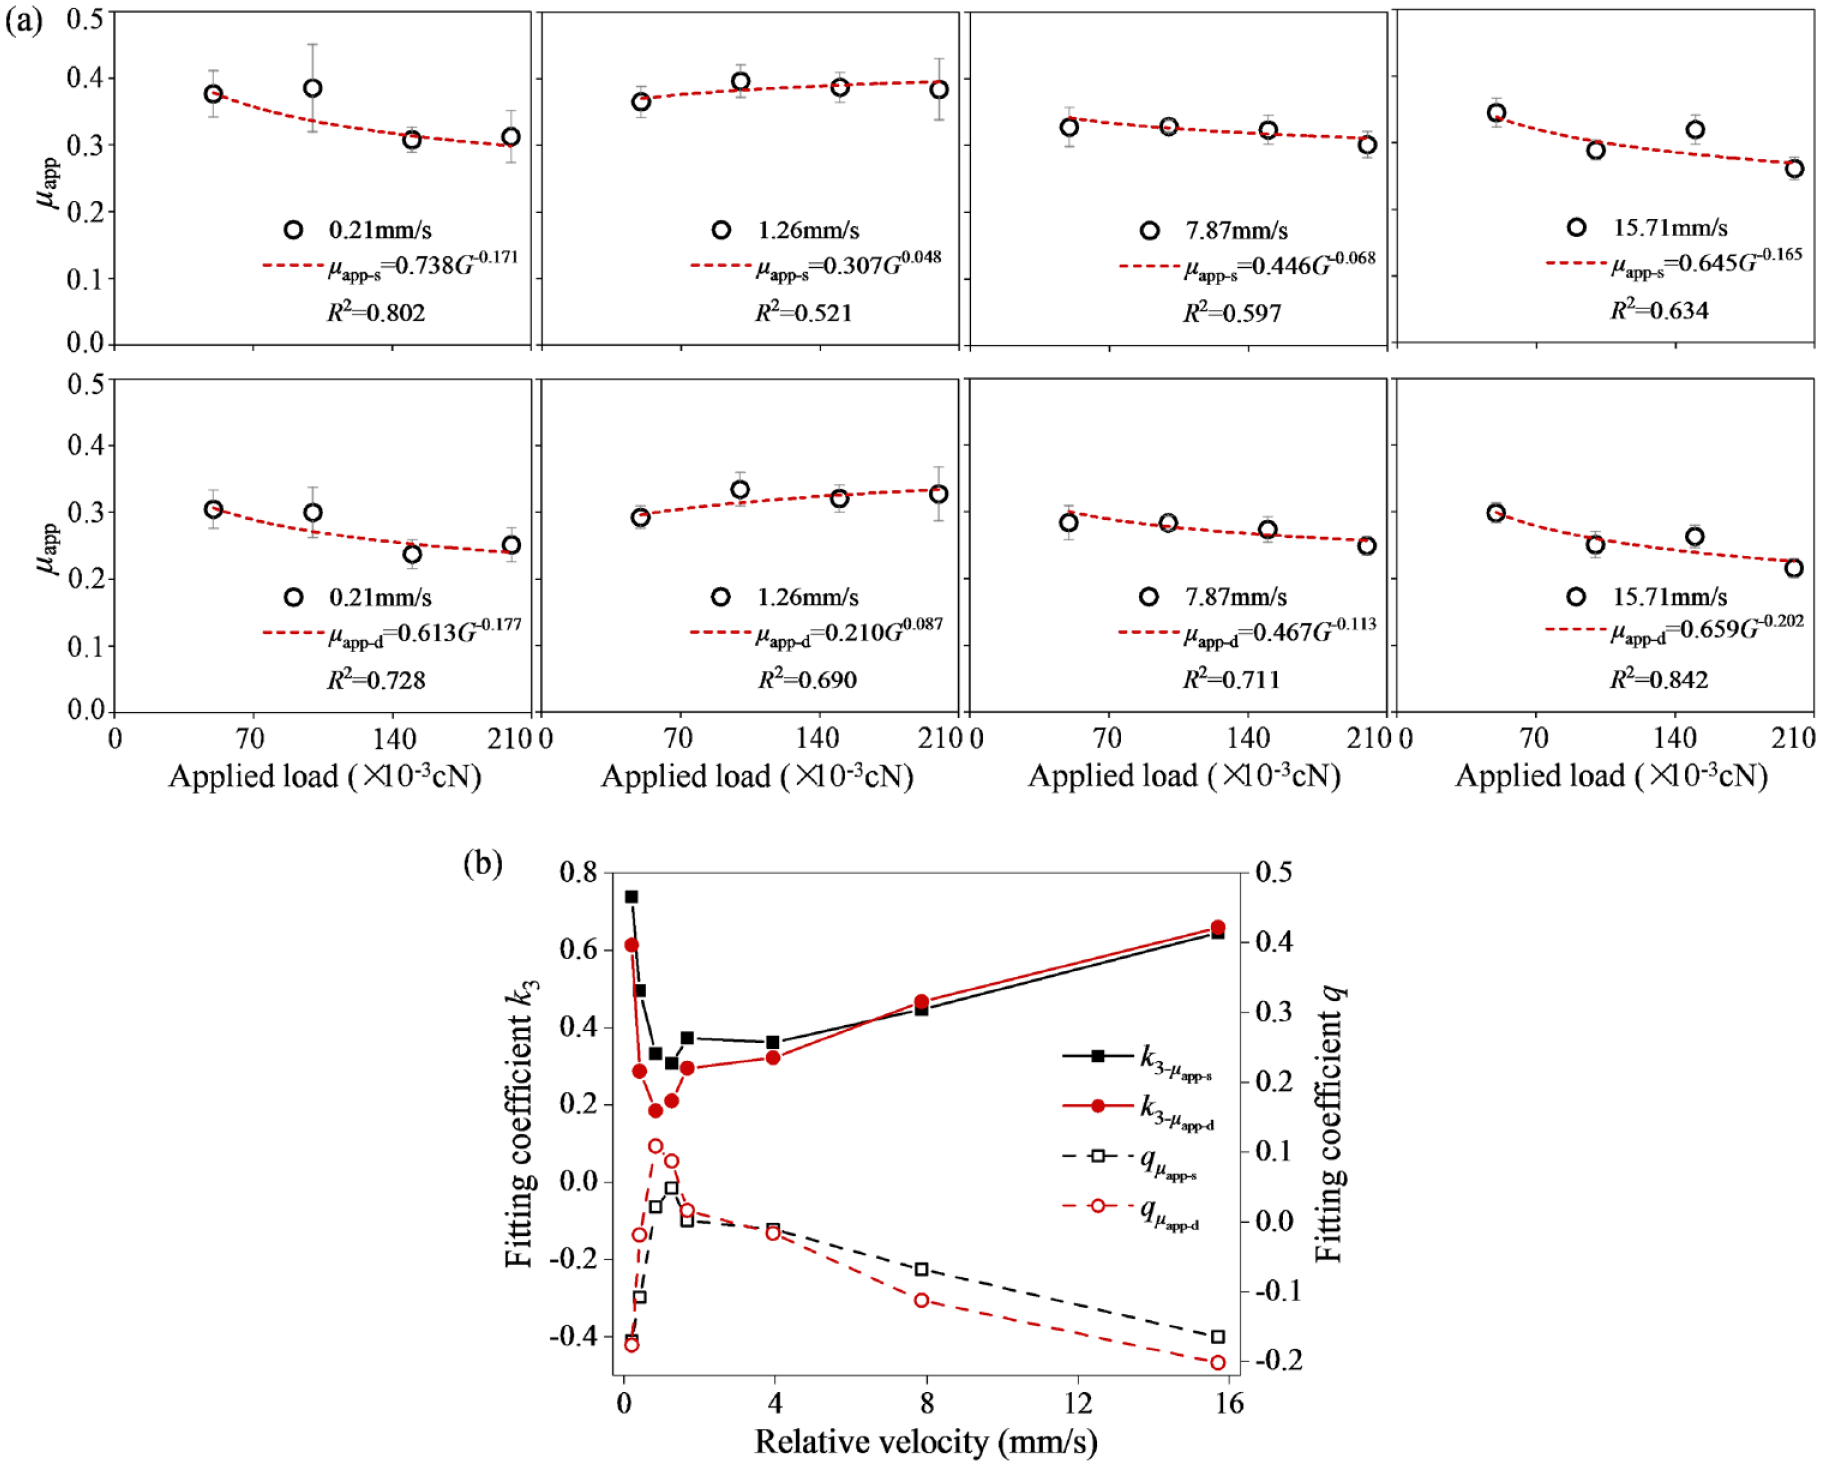
(a) The fitting results of the apparent coefficient of friction as a function of the applied load and (b) trend of the fitting coefficient of k3 and q versus to the relative velocity.
Investigation results on the dependence of the coefficient of friction on the relative velocity and applied load indicate that there is a coupling effect on the influence of these two factors on the apparent coefficient of friction of glass fiber. This observation aligns with the findings of previous studies on the friction behavior of glass fiber tow and glass fiber plain woven.12,20
Conclusions
The influences of the relative velocity and applied load on the frictional behavior of a single glass fiber filament were experimentally studied. It was discovered that the apparent coefficient of friction as the relative velocity increases goes through all or part of three stages successively: an initial-decreasing stage, an increasing stage, and a decreasing-to-stability stage. For the first stage, the rolling friction between the fiber filament and the roller generated by the rotation of the fiber should be responsible for the reduction of the apparent coefficient of friction; for the second stage, the increase in the apparent coefficient of friction is due to the increase in relative velocity leading to an increase in tangential deformation of the fiber and a decrease in recovery time; for the third stage, the decline in the apparent coefficient of friction may be ascribed to the presence of entrapped air between the fiber and the roller surface. Additionally, the apparent coefficient of friction decreases with increasing applied load. This is due to the decreasing ratio between the contact area and the applied load increase.
Furthermore, the dependence of the apparent coefficient of friction on the relative velocity and applied load was quantitatively analyzed. The findings indicate that the apparent coefficient of friction decays linearly with the relative velocity in the first stage (i.e. initial-decreasing stage), and then follows a power function with increasing relative velocity in the second stage (i.e. increasing stage), after that, it decreases again exponentially with the relative velocity until reaching stability. Additionally, the apparent coefficient of friction decreases following a power function as the applied load increases. What’s more, the dependence of the coefficient of friction on the relative velocity and applied load exhibits strong coupling characteristics.
This study broadens the tribological data for glass fiber material, offering guidance for parameter adjustments in both usage and manufacturing processes. In future studies, the influence of the fiber diameter, the environmental conditions, the roller surface roughness, etc. on the frictional behavior will be further investigated to establish a complete data set for the friction characteristics of glass fiber, facilitating predictive modeling of friction characteristics using intelligent algorithms.
Footnotes
Acknowledgements
The authors thank the editor and anonymous reviewers for helpful comments and valuable suggestions.
Declaration of conflicting interests
The author declared no potential conflicts of interest with respect to the research, authorship, and/or publication of this article.
Funding
The author disclosed receipt of the following financial support for the research, authorship, and/or publication of this article: This work was supported by the Science and Technology Project of Jiangsu College of Engineering and Technology [grant number GYKY/2023/4].