
Abstract
Yarn quality is a key indicator in spinning production process, which directly determines the processing quality of the finished fabric. Considering the problems that the yarn quality is difficult to predict due to many influencing factors and widely monitoring dimensions existed. This paper proposes a multi-correlation parameters-based feature subspace model for yarn quality fluctuation prediction method. Firstly, Kernel Principal Component Analysis (KPCA) algorithm is used to analyze the relationship between the relevant parameters affecting yarn quality, and the characteristic subspace of yarn quality fluctuation is reconstructed. Then, a feature subspace-oriented deep learning prediction structure based on Deep Belief Network (DBN) is constructed, and the intelligent prediction model of yarn quality is established by using Particle Swarm Optimization (PSO) algorithm to optimize the modeling parameters. Finally, a case for spinning spun yarn process data set is used to validate the effectiveness of the proposed method, result shows that the proposed method can effectively analyze the multi-correlation parameters fluctuation law, which shows good effect for predicting yarn quality accurately.
Introduction
With the rapid development and application of big data, artificial intelligence and other technologies, the textile production industry is being deeply innovated.1,2 Due to the complex nonlinear relationship among the raw material properties, spinning process and yarn quality, 3 this makes the spinning quality fluctuation prediction model difficult to build according to product requirements. At the same time, with the increasing demand for market diversification and customization, the traditional way to improve the yarn quality by adjusting the processing parameters and cotton matching scheme through a lot of trial spinning and expert experience inevitably lead to waste of time and raw materials, 4 which does not meet the inherent needs of online product quality control in the context of intelligent manufacturing. 5 As a key link in the cotton spinning production process, the yarn quality in spinning process is directly determines the forming the subsequent process efficiency and the finished fabric processing quality. However, due to the characteristics of many factors affecting the spinning production process, wide monitoring dimensions, and complex nonlinearity between spinning process parameters and yarn quality, 6 it is difficult to establish a prediction model of spinning process quality fluctuation. Therefore, the key problem for spinning quality control is that how to build a spinning quality fluctuation prediction model based on key process influence parameters, which shows great value for improving yarn quality, increasing process stability and optimizing decision support.
In order to solve this issue, this paper mainly focuses on how to characteristic and predict the yarn quality fluctuation due to the change of multi-correlation parameters in the spinning process. And the multi-correlation parameters-based feature subspace mechanism for yarn quality fluctuation prediction in spinning process is proposed. Specifically, two main works are conducted. Firstly, the influence relationship of the relevant parameters affecting the yarn quality is analyzed, the feature subspace which can characterize the yarn quality fluctuation is constructed by Deep Belief Network. Secondly, the nonlinear relationship between multi-correlation quality influencing parameters and quality characteristics is constructed based on the deep belief network. In this way, key quality characteristics of the spinning process are intelligently predicted accurately. It hopes that the proposed method can provide some useful guidance for improving production process quality prediction efficiency and product quality stability.
The rest of this paper is organized as follows. Some related work and research motivations are briefly reviewed in Section 2. Section 3 presents the framework for spinning quality fluctuation prediction based on multi-correlation parameter feature subspace. In Section 4, multi-correlation parameters yarn quality prediction based on deep belief network of feature subspace is focused, which includes the multi-correlation parameters feature subspace reconstruction and deep learning yarn quality prediction model constructing. Section 5 shows a case study. Finally, conclusion and future work are presented in Section 6.
Related works and motivations
In this section, a literature review is summarized in the field of multi-correlation parameters quality fluctuation monitor and quality intelligent prediction algorithm in production process.
Multi-correlation parameter quality fluctuation monitor
In the actual production process, there are many factors that affect the fluctuation of product quality. When the process state variables are disturbed by abnormal factors, the final product quality characteristics will fluctuate around the ideal value. 7 It is difficult to control the quality fluctuation caused by multiple variables in the manufacturing process. Xin-chun et al. 8 proposed a quality control method based on big data and pattern recognition. In order to keep the quality of the whole production process continuously stable and consider the mutual influence between multi-correlation parameters. Principal component analysis and kernel principal component Analysis were successfully applied to control the quality fluctuation of multi-stage manufacturing process.9,10 In order to identify the abnormal fluctuation of quality in the process and give early warning, the change point identification model is used to determine the quality fluctuation stability.11,12 With the development of production process complexity and the advancement of machine learning techniques, 13 many researches have focused on intelligent quality prediction, including neural networks to build nonlinear relationships for prediction,14,15 production process quality data mining analysis .16,17 In order to improve the quality prediction accuracy, Bai et al. 18 proposed to combine data dimensionality reduction and support vector machine to build a quality prediction model. Klein et al. 19 applied the machine learning method of random forests to predict dimensional and surface quality characteristics of honed bores.
Through the above analysis, the existing research on quality fluctuation monitor has achieved ideal results. However, these methods are mainly based on raw quality data for modeling analysis, while ignoring the influence of multi-correlation parameters on the quality prediction model.
Quality prediction model based on related algorithms
High-precision quality prediction model is helpful for improving quality control effect. The general step of quality prediction modeling is to use various historical data to build an appropriate prediction model, and then real-time data is collected to predict output quality characteristics online to help optimize production decisions.20 –22 there have been remarkable research works on the prediction modeling with various algorithms. Yang and Gordon 23 proposed a spinning quality prediction method based on multiple regression model. The prediction model is constructed by a large amount of spinning historical data to achieve accurate prediction of yarn quality. Quality prediction is more difficult because the actual manufacturing process is a complex process affected by multiple variables at the same time. Deng et al. 24 proposed a deep regression framework based on manifold learning, which mainly dealing with the problems of inaccurate quality prediction and weak quality control in parts production processes. Su et al. 25 integrated the rough set and particle swarm optimization support vector machine to solve the problems of quality prediction. With the development of artificial intelligence technology, artificial neural networks and the improve algorithm have been selected to enhance the performance of prediction model, which enables quality stability to be ensured.26,27 Doran and Sahin 28 proposed an artificial neural network and a support vector machine model to predict the quality characteristics of core-spun yarns using fiber quality and spinning parameters. To improve the shallow neural network prediction accuracy, Hu et al. 29 proposed a convolutional neural network-based quality prediction model. Ghanmi et al. 30 proposed a hybrid neural network fuzzy expert system model to predict the overall performance of rotor yarn quality. In order to solve the problem that the quality is difficult to predict and analyze due to the strong nonlinearity and coupling between process parameters in the actual production process, Zou et al. 31 explored an internal crack prediction model based on the principal component analysis and deep neural network was proposed by collecting sufficient industrial data. Wang et al. 32 presented a deep boltzmann machine algorithm for condition prediction in smart manufacturing process.
Through the literature review, it can be concluded that the fluctuation stability of spinning production process is a key factor affecting yarn quality. Prediction the quality fluctuations during spinning is used as an effective way to master yarn quality stability. Many researches have been conducted on spinning production process control and have achieved ideal results. However, these studies mainly focus on the spinning yarn quality prediction modeling based on shallow neural network and analyze it from the perspective of improving the prediction accuracy of the model. The problem of yarn quality prediction brought about by the analysis of multi-parameter correlations in the production process is rarely considered.
Based on the above analysis, the motivation of proposed research is that, with the rapid development of communication and sensing technology, the high-dimensional mass data collected by its production process intelligent monitoring system is used to reflect the stability of the spinning process. The change of data trace not only reflects the changing trend of the spinning process, but also the fluctuation range of the yarn quality is characterized. Thus this paper takes the yarn spinning production process as the research object and mainly focuses on exploring and solving the problem of multi-correlation parameter yarn quality prediction based on feature subspace deep belief network, it mainly contains two key technology illuminated as follows:
(1) The influence relationship of the relevant parameters affecting the yarn quality is analyzed and the characteristic subspace that characterizes the yarn quality fluctuation is constructed. Thus, it could realize the feature dimension reduction and subspace reconstructed for the original multi-association parameters.
(2) A deep learning yarn quality prediction model based on feature subspace is constructed. On this basis, the modeling parameters are optimized to realize the yarn quality intelligent prediction.
In the process of spinning, there are many complex parameters that affect quality. In this paper, the correlation algorithm is used to map the high-dimensional space of the original multi-dimensional correlation parameters to the low-dimensional feature subspace, which is uncorrelated and can represent the original features. It reduces the amount of data and has strong novelty. At the same time, the deep belief network which is more accurate and superior to other shallow neural networks is adopted, and optimize the network. So as to realize the establishment of prediction model for quality fluctuation in spinning process.
The framework for proposed yarn quality fluctuation prediction
This paper motivates to propose a spinning quality fluctuation prediction method based on multi-correlation parameter feature subspace. The framework of the proposed method is shown in Figure 1, which main contains three modules: ① Correlation analysis is carried out on the multi-related parameter data of the spinning process. The dimension of quality data is reduced, redundant information is eliminated, and the main feature subspace of yarn quality fluctuation is reconstructed. ② The nonlinear influence relationship between multi-correlation parameter feature subspace and yarn quality fluctuation is explored. A deep belief network is constructed to perform deep feature extraction on the data information of the feature subspace. And supervised global fine-tuning of yarn quality depth prediction modeling via error backpropagation is implemented. ③ The number of neurons in the hidden layer of the RBM is jointly optimized by the particle swarm optimization algorithm. The intelligent prediction of spinning quality by constructing an optimized deep belief network model is realized.

The framework for spinning quality fluctuation prediction.
Construction of quality fluctuations of multi-related parameters in spinning process
Multi-relation parameters feature subspace modeling in spinning process
When constructing a prediction model for yarn quality fluctuation, the first work is to analyze the influence of multi-related parameters on yarn quality fluctuation.
33
Since there are many parameters affecting yarn quality and they are related to each other,
34
the dynamic fluctuation of yarn quality with the change of the parameters is caused by the dynamic fluctuation of yarn quality. A typical situation is that even if each quality parameter fluctuates within the normal range, the actual yarn quality may also fluctuate abnormally. This makes it difficult to accurately predict yarn quality. Firstly, the influence relationship of multi-related parameters of yarn quality is analyzed. For nonlinear data, PCA is usually unable to process, so this article selects the KPCA algorithm.
35
The working principle of KPCA is that it first maps the original data to a high-dimensional space by using a specific kernel function, perform linear processing in feature space, the key is to introduce kernel function, ignoring the expression of the specific mapping function, and directly obtain the inner product of the low-dimensional data mapped to the high-dimensional data (each element of the covariance matrix is the inner product of the vector). And then using principal component analysis (PCA) to reduce their dimensions to solve some complex nonlinear relationships. The principal component analysis algorithm is used to map the high-dimensional space of the original multi-dimensional correlation parameters to the low-dimensional feature subspace that is independent of each other and can represent the original features. A subset of principal features that can reflect yarn quality fluctuations are extracted. The essence of the method is to map the characteristic data of the
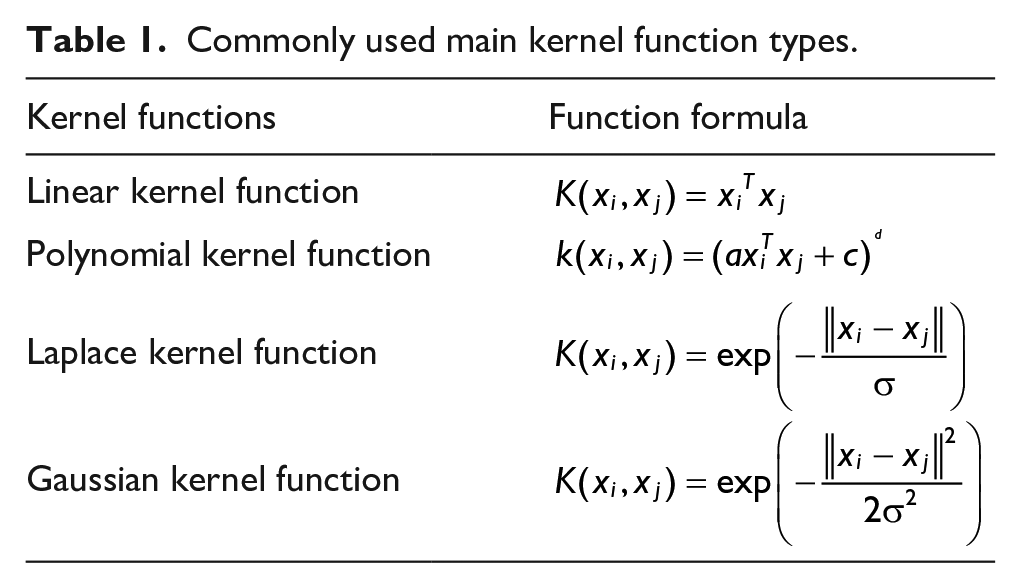
Commonly used main kernel function types.
KPCA algorithm is to map the
Suppose there is a sample matrix

The covariance matrix

The eigenvalue

Substituting equation (3) into the characteristic equation of covariance matrix

At this time, the nuclear matrix

In equation (5), the elements of kernel matrix

Where

It is worth noting that the above derivation process is based on the premise of centering on

Where
The selection of kernel functions also greatly affects the results of dimensionality reduction. Linear kernel function, whose function is simple, is simply to add a constant to the inner product of two vectors, which can only solve linear separable problems. Polynomial kernel functions are slightly more complex than linear kernels, and can handle nonlinear problems due to the addition of the exponent

Where
The feature subspace obtained after correlation analysis and reconstruction enables the feature information of the original sample data space to be effectively preserved. The obtained feature subspace can not only remove the correlation of the original multi-correlation parameters, but also ensure the orthogonality of the feature dimension. Thus, the obtained feature subspace is used as the input of yarn quality fluctuation prediction model, which the dimension reduction is realized. Based on this procedure, the complexity of the yarn quality fluctuation prediction model is some degree of simplification.
Spinning quality prediction and parameter optimization
After the multi-associative parameter feature subspace that affects the spinning quality is constructed. How to construct the yarn quality fluctuation prediction model is regarded as the key technology of the next work. The function model between the multi-correlation parameter feature subspace

where
In the spinning process, the evenness CV value of the yarn directly reflects the thickness of the yarn. It is an important indicator used to measure the yarn quality. The larger the CV value, the more uneven the thickness of the yarn, which will affect the yarn breakage rate. The factors that affect the CV value of yarn evenness include oil content of tops, twist coefficient of roving, moisture regain of tops, fiber diameter, spinning speed and many other quality-influencing parameters. Deep belief network is a deep learning algorithm composed of multiple restricted Boltzmann machines. 37 DBN shows excellent fitting ability in nonlinear system modeling. Therefore, this section explores the nonlinear relationship between the multi-related quality influencing parameters and the yarn quality characteristics. A deep belief network prediction model of spinning multi-related parameters and yarn quality indicators is constructed. The model structure is shown in Figure 2. The yarn quality prediction model is divided into two parts: RBM layer-by-layer unsupervised training and BP layer supervised fine-tuning. The bottom of the model is composed of four layers of RBM stacked, which is to realize the deep feature extraction of the data information of the feature subspace. The top of the model is constructed by a BP neural network, which is supervised and globally fine-tuned by error back-propagation. The nonlinear relationship between the multi-correlation parameters and the yarn quality index is established through the multi-layer feature mapping and layer-by-layer transfer of the DBN model. Based on this, intelligent prediction of yarn quality is realized.

Spinning quality prediction structure based on DBN network.
Each RBM is a double-layer network structure composed of visible layer
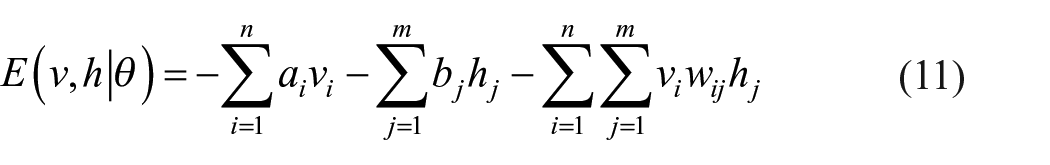
Where
Among them, the lower energy represents that the network is in a more ideal state. At this time, the error of the yarn quality prediction model is small. Calculation of energy function regularization and exponentiation. The joint probability distribution of the visible layer and the hidden layer

Where
Due to the structural properties of the independent activation states of the neurons in the RBM layer. When the state of the neurons in the visible layer is given, the probability that the j-th neuron in the hidden layer is activated can be calculated. Similarly, when the state of neurons in the hidden layer is given, the probability of the activation of the i-th neuron can be calculated by equation (13).

Where σ is the activation function.
Therefore, constructing a yarn quality prediction model is to find the combination

By solving the RBM layer-by-layer the negative gradient

Where
In the unsupervised training phase, a greedy algorithm is used to train the RBM of the predictive model layer by layer. And the output of the previous RBM hidden layer training is used as the input of the next RBM visible layer. In this way, the optimal RBM of each layer is achieved. To ensure the overall optimality of the DBN prediction structure, BP algorithm is used to predict the extracted depth features. The network parameters are adjusted based on the prediction error to realize the parameter optimization of each RBM layer of the network. In addition, the particle swarm optimization algorithm is used to jointly optimize the number of neurons in the hidden layer of the RBM. As shown in Figure 3, it includes the following steps.
(1) The number of hidden layer neurons of each RBM to be optimized is
(2) The inverse of the mean squared error (MSE) of the model prediction is used as the fitness function.
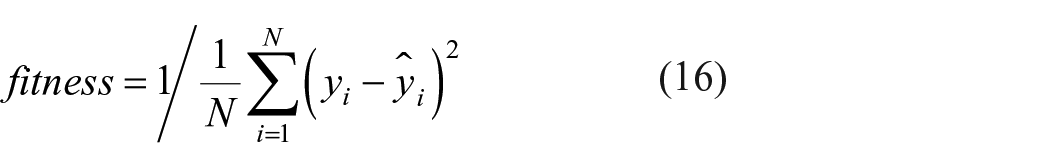
where,
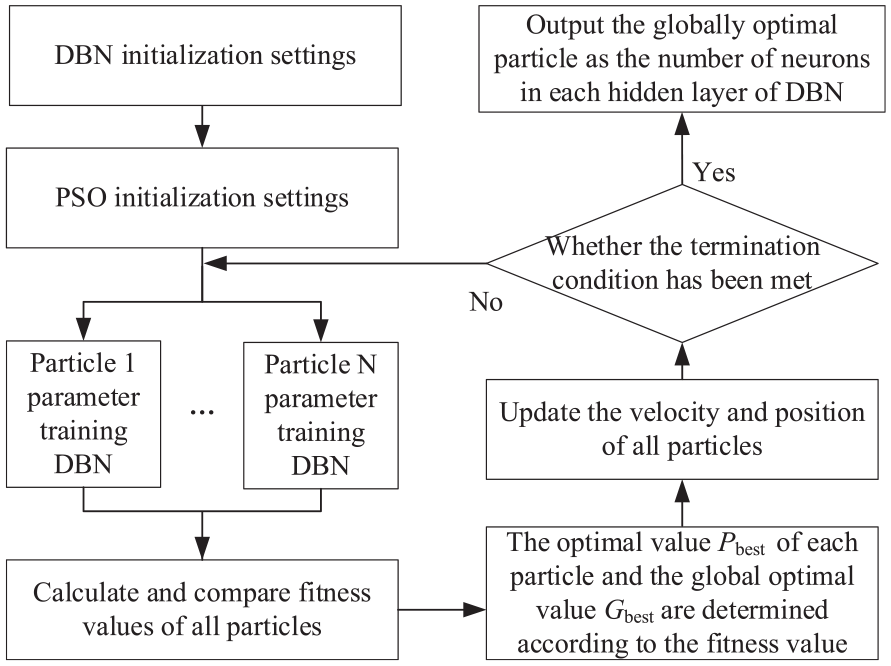
Deep belief network process based on particle swarm optimization.
The position of each particle
(3) Update the velocity and position of particles. In the process of particle searching for individual optimum and global optimum, the current fitness of the particle is constantly compared with the historical fitness value. Always follow the individual optimum and the global optimum to change its speed and position.
(4) When the fitness function reaches the maximum, the optimal combination of the number of neurons in the hidden layer of each RBM structure of the prediction model is obtained. Otherwise, go to step (3). After many iterations, the DBN prediction model is overall optimal. Based on this, the construction of an optimized deep belief network prediction model is realized.
Case study
In this section, a worsted spinning yarn production process case is used to validate the effectiveness of proposed quality prediction method. By analysis, there are 10 key influencing factors (KIFs) which should be jointly monitored to guarantee the CV value of yarn quality. In order to verify the prediction effect of the methods listed in this article, simulation experiments were conducted by analyzing the original 75 groups of samples from Xing, 39 as shown in Table 2.
Sample data for KIFs and CV value.

Correlation analysis of spinning quality with multi-correlation parameters
In order to mine the multi-correlated quality parameter data information, the correlation of 75 sets of multi-correlation quality parameter data is analyzed, and the principal component analysis algorithm is used for dimension reduction. Figure 4 shows the calculation results of variance contribution rate and cumulative contribution rate after correlation analysis. In this paper, the Gaussian kernel function is selected. After comparing the test results for many times, the parameter set is

Variance contribution rate and cumulative contribution rate after correlation analysis: (a) variance contribution rate and (b) cumulative contribution rate
Figure 4(a) and (b) show that the cumulative contribution rate of the first 6 principal components reaches 89.25%. Therefore, its principal component feature set is selected as the feature information of the original sample data to characterize the yarn quality. Based on this, the key feature subspace that affects the yarn quality is constructed, and the dimension reduction of the original feature is realized.
In order to compare the difference between PCA algorithm and KPCA algorithm, set a fixed threshold (cumulative contribution rate) ⩾0.85 to obtain the contribution rate and cumulative contribution rate of each principal component after dimensionality reduction, as shown in Figure 5, the first 6 principal components of the original data after dimension reduction by PCA algorithm account for 86.72% of the total data. The first 6 principal components of the data after dimension reduction by KPCA (Gaussian kernel function,

Comparison of Cumulative Contribution Rates between PCA and KPCA (Different Kernel Functions).
Prediction effect analysis
When modeling yarn quality predictions, the first 70 groups of principal feature samples in the subspace after dimension reduction are selected for the training of the yarn quality prediction model. At the same time, the following five sets of principal component features are used as test data sets to test the constructed yarn quality prediction model. The PSO algorithm is selected to jointly optimize the number of neuron nodes in the four-layer RBM structure required for modeling, which the relevant parameter settings is shown in Table 3.
Algorithm parameter settings when optimizing deep prediction models.
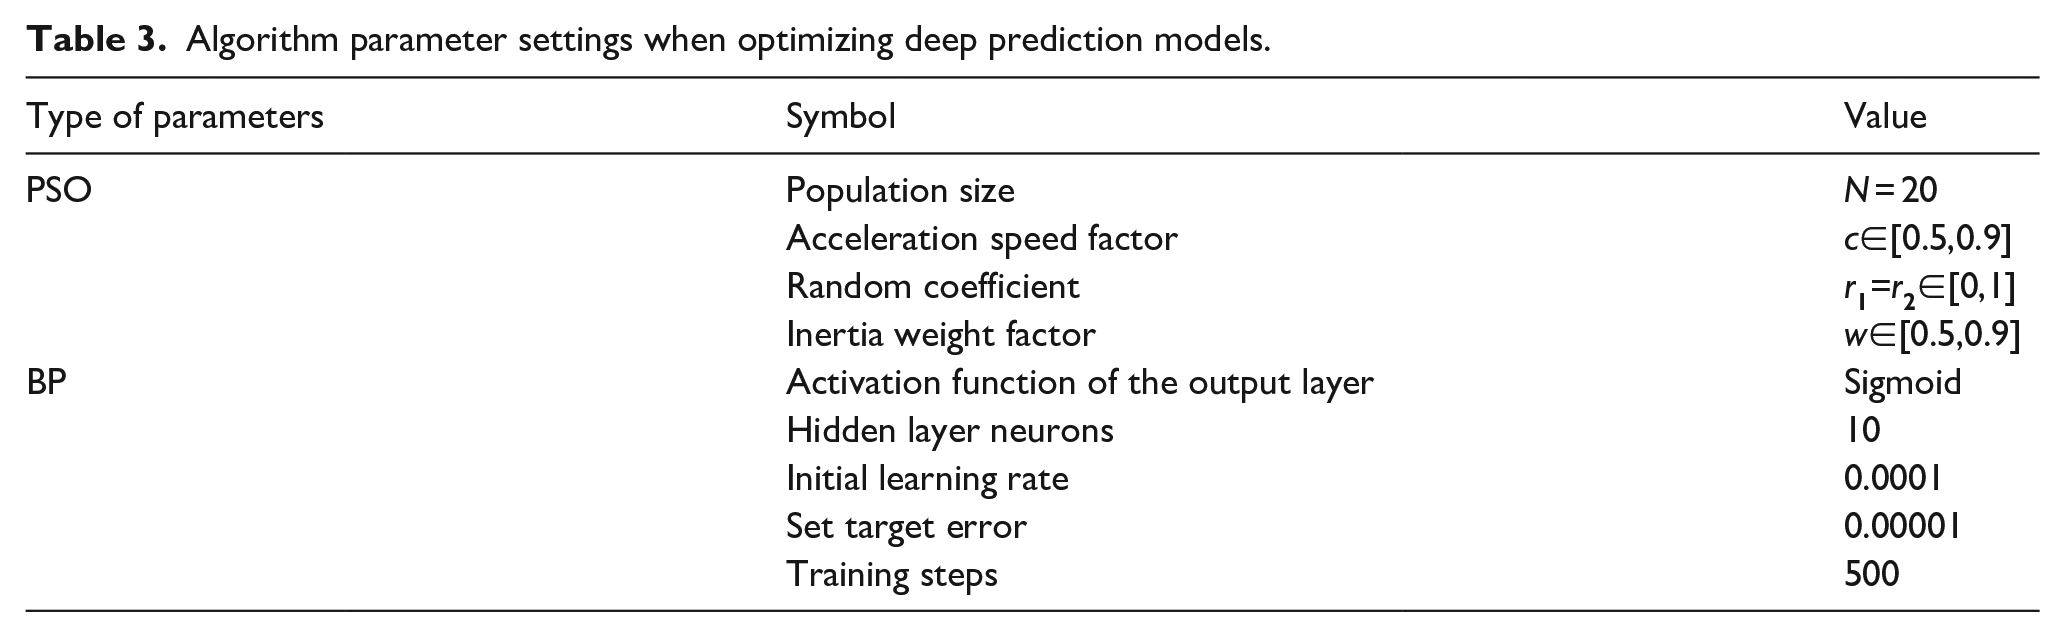
Figure 6 shows the fitness curve for the optimization of the number of RBM neuron nodes, it can be seen that the fitness value gradually increases from the first iteration, and no longer increases after 50 iterations. This shows that the constructed prediction algorithm can gradually converge to a stable value. At this time, the global optimal solution of the number of neurons in the DBN yarn quality prediction model are 31, 38, 26, and 35.

Optimal results of the number of RBM neuron nodes.
In order to further verify the effectiveness of the optimized deep belief network model constructed, the DBN model, PSO-DBN model and KPCA-DBN model were selected for comparison, which the same size training sample

Where
Table 4 shows the prediction error, correlation coefficient R, training accuracy, and testing accuracy of different structural models after multiple experiments. Compared with the actual value, the predicted value of a high-precision prediction usually has an error range of less than 5%, which indicates that the prediction is accurate. Therefore, this article selects a forecast with an allowable fluctuation range of less than 5%. The first 70 groups are training sets, and the last five groups are test sets. It can be seen the DBN and the PSO-DBN model do not consider the influence of multiple related quality parameters of yarn, its prediction results have a large deviation compared with the dimension reduction prediction models (KPCA-DBN and KPCA-PSO-DBN). However, after considering the related effects of multiple correlation parameters, the DBN prediction model optimized by PSO has a better hidden layer neuron parameter combination, the correlation coefficient R value of the proposed yarn quality predict model is close to 1, which shows a significant improvement effect than that of KPCA-DBN model.
Comparison of yarn quality prediction results for different structure models.

According to the optimization results of the deep belief network structure in the previous section, the optimized deep belief network model of dimension reduction is used to predict the yarn quality fluctuation on the test set. Figure 7 gives the comparison of the prediction effect between model output and true value, it shows that the yarn quality prediction result for constructed model are almost consistent with the true values. Furthermore, the change rate on prediction output relative to actual target output is shown in Figure 8, it can be seen that the correlation coefficient between model output and actual output is 0.988, which demonstrates a better prediction performance.

Comparison of the prediction effect.

Change rate on predicted output relative to actual output.
Conclusions and future works
This study proposes a feature subspace-based deep belief network to predict the spinning quality fluctuation. It contains feature subspace modeling based on multi-related parameters and spinning quality fluctuation prediction based on deep believe network, which is summarized as follows.
(1) Feature subspace modeling based on multi-related parameters. In the actual spinning production process, the quality characteristics fluctuate dynamically with the change of the influence parameters due to the many and interrelated quality influence parameters. The feature subspace modeling algorithm based on multiple associated parameters, it can effectively map the high-dimensional space of the original multi-dimensional related parameters to the low-dimensional feature subspace that is not related to each other and can represent the original features, thus making the production process quality multi-associated parameter dimension reduction.
(2) Spinning quality fluctuation prediction based on deep believe network. The deep belief network solves the problem that it is difficult to establish the nonlinear mapping relationship between the characteristic subspace of multiple associated parameters and the quality characteristic index value in the quality prediction model. A case of spinning spun yarn process data is used to validate the effectiveness of the proposed method, that the constructed optimized deep belief network algorithm has obvious improvement effect in prediction accuracy compared with shallow neural network, which provides theoretical support for spinning production quality fluctuation abnormal warning.
The results show that the prediction of yarn quality based on the depth confidence network of feature subspaces with multiple related parameters has a correlation of 98.8% with the actual situation, indicating that the established yarn prediction model has good accuracy, and this method shows good prediction effect in the process of spinning quality control. Therefore, there may be some guidance for the application of this method. First of all, we need to establish the prediction model of spinning process quality fluctuation in different environments to ensure the accuracy of stability analysis. In addition, the quantity and mode type of multimodal data determine the effect of process stability analysis, which makes it a promising tool for state-based quality stability analysis under manufacturing big data.
Future works mainly focus on how to analyze the abnormal quality fluctuation warning mechanism on the basis of considering the influence of multi-correlation parameters. Specifically, a heuristic quality fluctuation anomaly early warning scheme that integrates the abnormal fluctuation generation, abnormal detection and abnormal identification is try to be established. These works will be further conducted in future research.
Footnotes
Declaration of conflicting interests
The author(s) declared no potential conflicts of interest with respect to the research, authorship, and/or publication of this article.
Funding
The author(s) disclosed receipt of the following financial support for the research, authorship, and/or publication of this article: The research work presented in this paper is supported by the National Natural Science Foundation of China (72001166), the Natural Science Foundation of Shaanxi Province(2022JQ-721) and the Scientific Research Program funded by the China National Textile and Apparel Council (2020112).