
Abstract
Compared to other textiles, socks are made at the lowest cost and have the highest consumption rate, making them one of the least-lasting fabric goods in the clothing industry. Socks are available in a wide range of fibers blends, that is, cotton, wool, nylon, acrylic, polyester, olefin, spandex, etc. As an element of footwear, socks act in tandem with the foot and shoe, influencing the temperature and moisture levels of the feet. The comfort of clothing next to the skin in terms of temperature and moisture is gaining more and more attention. Pilling is a serious issue with wool items, and less pilling is required since it negatively impacts the esthetic, comfort, and longevity of the fabric. This research has investigated socks pilling tendency and thermo-physiological comfort properties, that is, air permeability and thermal resistance made by wool/polypropylene blend yarn. Three different combinations of wool/polypropylene yarns on the main and platting side of the socks were used at two different tightness levels. Polyurethane finish has been applied to check the socks’ behavior after the finish application. Statistical analysis showed that finished samples knitted with wool/polypropylene as a main yarn offer the best results against the pilling test while sample code ANL, an unfinished sample, offers the best results regarding air permeability, thermal resistance, and overall moisture management capacity.
Introduction
Customers are more likely to be satisfied with clothing if they feel comfortable. An individual’s reaction is influenced by a variety of factors, including the wearer’s psychological state and the environment in which the garment is worn.1 –3 Temperature, moisture, and airflow from the skin are all factors in thermo-physiological comfort. Depending on the intended use, several fiber blends have been created. Consumers are well-informed about their needs and actively seek products that meet those needs while being innovative and of high quality. 4 Thermal insulation of knits is essential for skin comfort in sports wearers and is also related to fabric air permeability. Socks are footwear that covers the foot and are used with shoes. 5 When worn properly, socks offer both comfort and protection for the wearer. The socks heel, sole, and toe are the most common areas to suffer from pilling. 6 If the socks are rubbing against anything, it could be in shoes, slippers, or even on the floor. The degradation affects the mechanical properties and quality, causing a shorter useful life. 7 In terms of sustainability, wool is an excellent choice. Wool’s structure and chemical composition set it apart from other fibers. It offers a range of unique comfort and thermal resistance properties that no other natural or synthetic fiber can match. 8 The fact that socks and shoes have fewer air circulation options than other areas of the body means that they must be more comfortable than any other item of clothing. Water-vapor transport or the capacity of textile materials to enhance evaporation are key factors in the comfort of textile materials. 9 Wool socks are better at insulating feet from the cold, and they can reduce the risk of frostbite in the winter. 10 Hao et al. 10 used wool blend yarns to study skin hydration and differences in sweat at the foot of socks, concluding that socks with a PP/wool blend give better comfort. According to research, there are conflicting data on the impact of sock structure on foot comfort. The material and weave of five different commercially available socks affected perspiration collection and foot temperature while running. 11
After a few wears, tiny bubbles appear on the surface of wool socks, depending on the intensity of abrasion. During the abrasion of wool products, short or broken fibers from the surface begin to intertwine and form small knots. 12 The degree to which pilling produced and wear-off determined by the physical properties of the fiber, yarn, and fabric structure. 13 Pill formation rates have been affected by fiber characteristics such as kind, strength, diameter, length, and curvature. The most important parameters affecting pilling are yarn liner density, TPI, twist type, and yarn hairiness. 14 On a single jersey structure, less pilling has been generated than on rib or interlock, and natural yarns tend to pill more than synthetic yarns. Another research explains the impact of open-end and ring-spun yarn processes on the pilling of a weft-knitted garment. Lacoste structures manufactured with open-end yarn have a decreased tendency to pill than single jersey plain structure. 15 Additionally, the knitted structure is vital in pilling and abrasion resistance. As tuck stitch materials have the lowest abrasion resistance among knit fabrics, increasing the number of tuck stitches reduces pilling and abrasion resistance. Pilling is less likely to occur in structures with a smaller operating area, and less pilling occurs in 2 × 2 ribbed textiles than in 1 × 1 or plain knitted ones. Polyurethane thread woven with polyester produces greater pilling than Polyurethane thread knitted with 100% cotton or PES.16,17
In addition to their greater strength, lighter weight, and more comfortable feel, wool blends are becoming more popular because of their lower cost, improved strength, and washability. Their small weight, cheap cost, and superior resistance to friction make them popular. It is critical to focus on reducing pilling in wool blend socks while maintaining their warmth and softness. 18 Socks with inside terry loops are more common in the winter season, which means that they are exposed to the outside environment for longer periods, increasing the risk of pilling. 19 Prior research has focused extensively on the effectiveness of plain knitted and rib structures in mitigating pilling tendencies, but there has been no such in-depth investigation on the effectiveness and convenience of sandwich terry knitted structures. Thermo-physiological comfort and physical features of wool/polypropylene (60:40) blend sandwich terry socks are investigated in the research, together with the effects of material type, structural tightness, and finishing process. The pilling characteristics of the manufactured socks are also evaluated in this study. Features like air permeability, OMMC (overall moisture management capacity), and heat resistance contributing toward thermo-physiological comfort are also evaluated. The findings of this study will be helpful for textile technologies and designers to develop socks with better comfort and thermal properties with improved pilling performance for winter wear.
Materials and methods
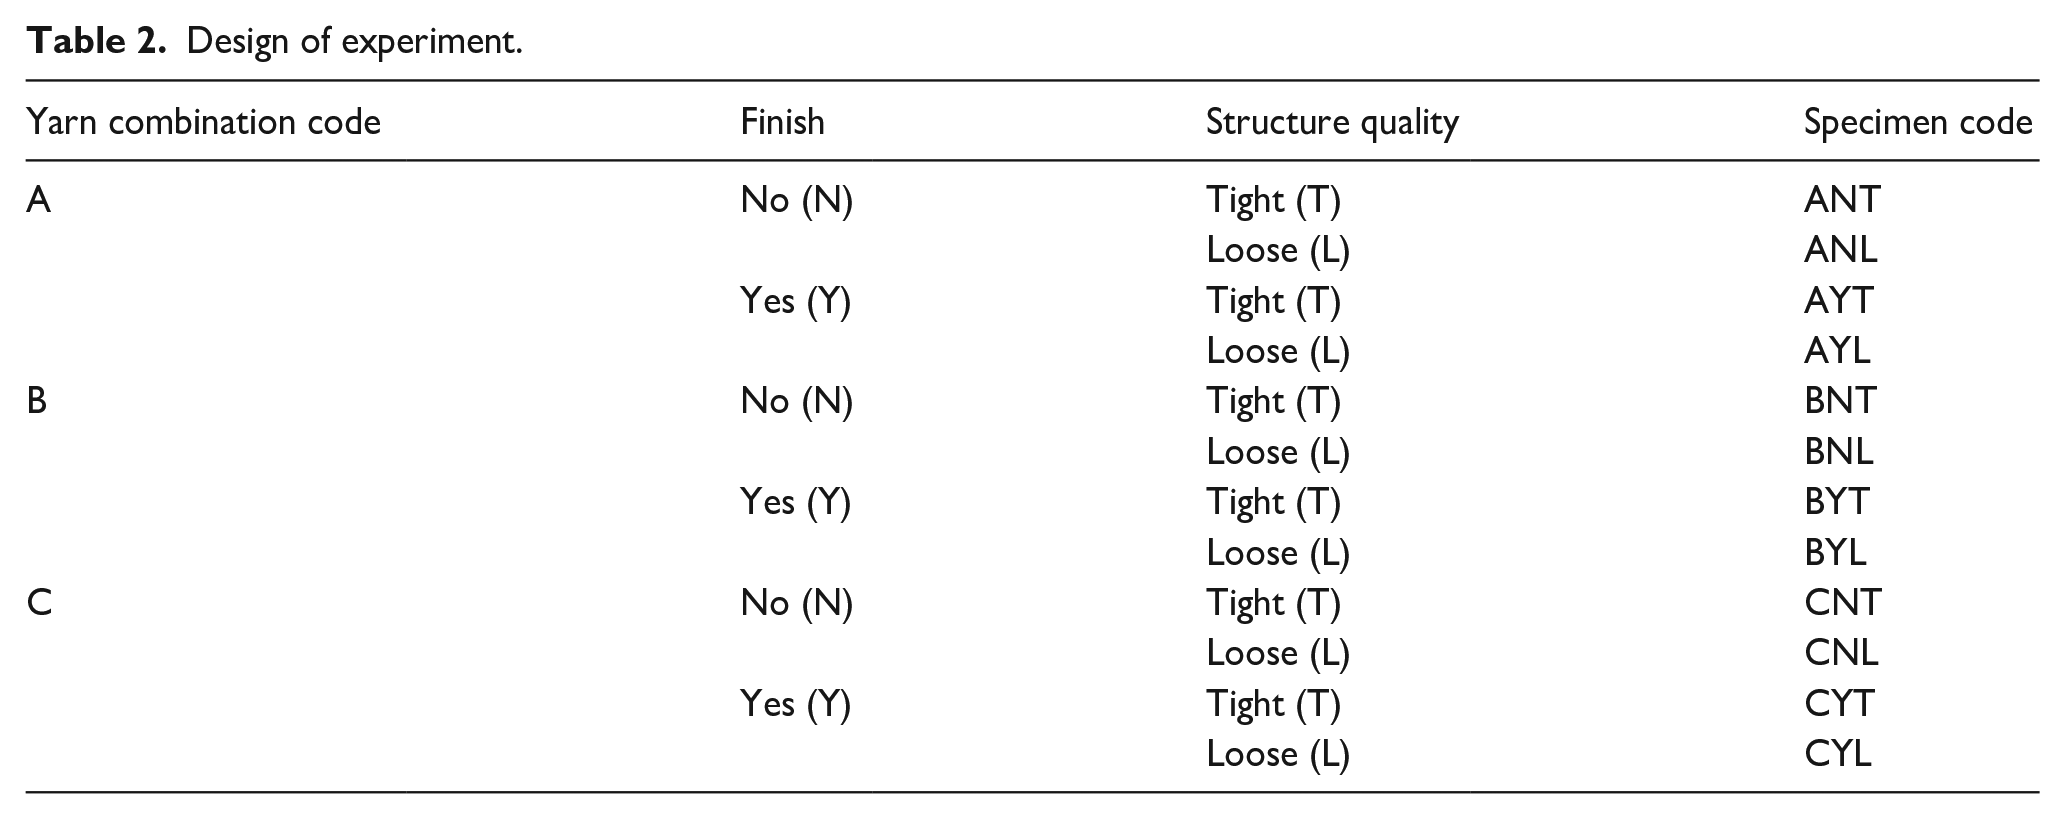
In this study, the 28 Ne combed blend of wool/polypropylene (PP) 60:40 and 20 denier Lycra single covered by 75 Denier Polyester in 5:95 ratio, was used as the main and platting yarns respectively (Table 1). Crew Socks (Figure 1) having sandwich terry structure were produced on (Lonati GL-544 socks knitting machine with 144 needles, 12 Gauge, and 4-inch Dia). All the knitting parameters, like the number of courses for each part, cylinder height, yarn tension, etc., were kept constant during the knitting. Sandwich terry structures comprise of terry loops hanging on backside of fabrics, in sandwich terry socks main and terry loops are formed with same yarn while the second yarn is employed for plaiting purpose. Sandwich terry structure (Figure 2) was produced by feeding two yarns simultaneously at different feeding positions from different fingers of the machine, terry loops were produced using both yarns. Yarn provided by the earlier finger goes on the front side of produced socks and is named as main yarn (Figure 3). Plating yarn is provided to the needle during its descending movement by lateral fingers. Samples were made at two different tightness levels: Tight (T) and loose (L). The loose or tight structure was achieved by varying different cylinder heights of the socks knitting machine. Total of nine specimens were produced using these experimental factors. The detail of the design of the experiment is given in Table 2.
Material combination used for main and platting yarns.


(a) Actual pictures of sample and (b) virtual image of sock made on APEX III (SHIMA SEKI design system).

(a) Single covered yarn used in platting, (b) sandwich terry structure (fabric view), and (c) sandwich terry structure (animated view).

Loop diagram of platted fabric: (a) front side, (b) back side and virtual image of platted fabric: (c) front side and (d) back side.
Design of experiment.
Application of finish
Stabiflex 65 is a polyurethane emulsion applied in an aqueous solution as a finishing material for socks. Through the exhaust process at 350°C, the coating was prepared at its 3% concentration, pH of 5.5 was, and the process was carried out for 20 min. A soft layer was formed on the fabric surface, reducing friction and the tendency of pills formation. 20
Characterization
Yarn lea strength, that is, CLSP, was checked using ASTM D2256, and twist per inch (TPI) for wool/Polypropylene yarn was found using ASTM D1423 standard. Single yarn strength (Tenacity) and elongation percentage were found using ASTM D2256, and other physical properties for wool/Polypropylene yarn were investigated using Uster tester five according to ASTM D1425 standard. The detail of the physical parameters of yarn is given in Table 3. Martindale abrasion tester was used to determine socks’ abrasion and pilling resistance according to ISO 12945-2. Specimen of predetermined dimensions, that is, 140 mm diameter, rubbed against each other for 5000 cycles. The amount of abrasion or pilling is compared visually against a given standard Air permeability of fabric is calculated as per ASTM D737-18. This test measures the rate of airflow perpendicular through the fabric under prescribed air pressure. It is an essential feature of the fabric’s breathability and is measured in mm/s. The fabric was placed in the circular test area of 20 cm2 at an air pressure of 100 Pa. The thermal insulation test is performed according to ISO-11092 standard using the sweating guard hot plate. Specimen of 10/10 inches’ dimensions of the fabric placed in the chamber. The temperature and humidity of the air are 20°C, and 65 ± 2%. The airspeed is specified at 1 m/s at a point 15 mm above the center of the plate surface. The air velocity coefficient of variation due to turbulence is between 5% and 10%. The amount of heat that passes through the specimen is used to calculate the conductivity/insulation value of the specimen is measured. Liquid moisture management of samples was analyzed on Moisture Management Tester (SDL-ATLAS, M-290) against standard AATCC 195-2011. The overall moisture management capacities (OMMC) of all samples were compared.
Physical properties of yarns.

Each test was performed three times, and the average value was taken. Specimen for testing were taken from the leg portion according to the dimensions of each test Table 4 and Figure 4.
Testing performed against standards.


Specimens during characterization.
Results and discussion
Physical parameters
The physical properties of knitted socks are given in Table 5, which includes measurement at different parts indicating the length of welt, leg, foot, wales per inch (WPI), courses per inch (CPI), and stitch length (SL) measured after relaxing the knitted socks. A variation in physical characteristics is due to each specimen’s loose and tight structures and different relaxation behavior because of different combinations of materials.21,22 The recorded testing responses are given in Table 6.
Physical properties of socks.

Response of different tests on socks.

Pilling resistance
Pilled specimens were compared against a standard, and the results are presented in Figure 5. After the application of finish pilling reduced significantly in AYT and AYL specimens up to 4.5 grade. In “A” category yarn, main yarn was wool/PP single ply yarn, because of which there is less “operated surface area” as compared to double ply yarn, and so less pilling takes place. 23 A similar trend of pilling was observed in the B category of yarn in which finish was applied, that is, BYT and BYL show a 4.5 pilling grade. A combination of wool/PP and Polyester covered Lycra was used on the main yarn of the B type category. Polyester from “Polyester covered Lycra” from the main yarn is used in filament form and will not cause any pilling. Only wool/PP abrasion from the main yarn will cause the pilling. Both A and B categories have wool/PP yarn as the main yarn, and it is only pilled during abrasion, and both categories of the specimen have the same grade of pilling. In both A and B types of yarn categories, four grade of pilling was observed when no finish application was used, which shows the effect of finish on pilling was good.

Pilling grade of socks.
No significant effect of the loose and tight structure was found in the first two yarn categories A and B. In C type category, 2-ply wool/PP yarn was provided to the feeder as the main yarn. Poor pilling grade, that is, 2.5, was observed in loose structure and without the application of finish. Feeding two yarns of wool/PP as the main yarn results in a structure with a greater GSM, greater density of wool/PP, and a “large operated surface area,” which ultimately results in increased pilling. 13 3.5 grade pilling was observed in the C category specimen on the application of finish with tight structure, and the grade is improved to four using both finish and tight structure. In this category, a significant effect of structure and finish application is observed, unlike A and B category yarn, in which only a considerable effect of finish was observed.
Spun yarn is the primary source of pilling and that pilling will be exacerbated by increasing the density of spun yarn. Polyurethane finish significantly reduces the pilling from 0.5 to 1 grade when used. It makes the fiber surface smooth by causing protruding fibers to stay along their fiber axis and by forming a smooth, thin film on the surface of the yarn, causing a reduction in protrusion. 24 The main effect plot also shows the same effect’s trends of yarn combination, structure tightness and chemical finish on socks’ pilling properties (Figure 6).

Main effect plot of pilling.
Thermal resistance
Thermal insulation test results are given in Figure 7 and present the amount of resistance to thermal conductivity. Air is a better insulator and has the least thermal conductivity value, that is, 0.0262. Thermal conductivity values for wool, PP, Polyester, and Lycra are 0.07, 0.1, 0.05, and 0.03 measured in m2.K/W. Since air has a lower thermal conductivity, if more air entraps in a textile structure, its thermal conductivity will decrease, and vice versa. Loose structures are more porous and trap more air between yarn gaps. The loose specimen shows more thermal resistance than tight specimens. 25 In C category of yarn, the density of yarn increases owing to the use of 2-ply yarn on both main and platting, compared with the A and B category of material combinations. More GSM will eventually minimize air gaps between yarns, resulting in either an increase in heat conductivity or a reduction in thermal insulation. In A and B category, material B has less thermal insulation value due to polyester-covered Lycra on the main yarn. The main yarn has more stitch length, that is, greater in %age than the plaiting yarn, which will cause a reduction in wool percentage as compared with the A category specimen. The thermal insulation of wool fiber is high due to scales present on its surface and entrapped air between these scales. A decrease in wool percentage will ultimately cause a reduction in thermal insulation. An increase in GSM will relate to increasing structure density, and it causes to decrease in air spaces due to which the B category will conduct more heat, and its thermal insulation value will decrease. 26 “A” material category causes more air spaces in its structure due to its greater porosity.

The thermal resistance of socks.
Polyurethane finish was applied on specimens to reduce the surface friction and create an even surface to reduce pilling, causing a decrease in thermal insulation. Polyurethane finish makes the surface smooth by protruding stick fiber along the fiber axis. 20 Due to this wool surface becomes smooth and scales present on its surface stick along fiber axis. It causes decreased air spaces between yarn, and ultimately fiber friction decreases, but thermal insulation also decreases. In all specimens, thermal insulation was reduced when finish applied. Better thermal insulation can be achieved by feeding single-ply yarn at the main and 2-plies at plaiting yarn. Making structures loose will also cause increased air space between them. The effect of yarn combination, structure of socks and Finishing on the thermal resistance can be checked through the main effect plot of thermal resistance (Figure 8).

Main effect plot of thermal resistance.
Air permeability
Results in Figure 9 present the air permeability values of all specimens measured from both the front and back sides. Explaining air permeability results from the front and back sides requires explaining terry structure behavior when air pressure is applied. Terry loops are loose, like towels, held with the main knitted structure. When air pressure applied to them from the front side, it causes them to pull out from the structure on the backside and move them away from the main knitted structure by the pressure of air, which causes to increase porosity due to which more air is allowed to pass from the backside. But when air pressure applied from the backside, that is, the terry loops side, it causes the loops to be stuck with a main knitted structure more tightly, making them move closer to the main structure and occupy the already present spaces of the knitted structure. It causes to reduce the porosity of the specimen, due to which less air is allowed to pass from the backside to the front. 27 In all tested specimens, less air permeability was observed when tested from the backside. Now air permeability and thermal insulation have direct relation up to a limit, and more air permeability will cause more porosity and ultimately more thermal insulation as air present between pores of socks behave as an insulator.

Air permeability result of socks.
All loosely knitted structure shows more air permeability due to greater porosity in knitted structure. “A” category of material, have more porosity in a knitted specimen, and more air will pass through the knitted specimen, giving higher air permeability results. 28 In contrast, the C category of the combination of materials shows the least air permeability value due to increased structure density and GSM. Increasing GSM and structure density causes reduced porosity or air spaces, and less air passes through the specimen. B category shows an intermediate range of air permeability results due to having less porosity than A and greater porosity than the C category of material. Application of finish on the specimen cause to reduction in the porosity of knitted socks as it creates a film of polyurethane on its surface and covers the surface of the specimen. When the finish application is made, their air permeability is reduced on all specimens. The effect of yarn combination, structure of socks and finishing on the air permeability of socks can be checked through the main effect plot of air permeability (Figure 10).

Main effect plot of air permeability.
Overall moisture management capacity (OMMC)
Moisture plays an important role in the cooling mechanism of the human. Transferring moisture from the skin’s surface to the atmosphere is an important property for next-to-skin use. 29 OMMC shows the overall management performance of liquid moisture of fabric, and the higher this value, the better the liquid transport performance of the fabric. The one-way transport capability property denotes the ability of the fabric to transfer liquid moisture from one side of the fabric to the other side. In other words, a higher one-way transport capability means sweat can easily and quickly transfer from the skin to the outer. Loose structures are more porous, and their moisture management properties are better due to the availability of spaces. 30 Loose specimen shows better OMMC value than the tight specimens. In C category of yarn, the density of yarn increases, compared with the A and B category of material combinations. More GSM will eventually minimize air gaps between yarns, decreasing the OMMC in A and B categories. In B and A category of yarn with loose structures shows better results of OMMC 0.006, 0.007 and 0.007, 0.008, respectively. The application of finish also affects the OMMC value directly. Application of finish makes the fiber surface smooth by causing protruding fibers to stay along their fiber axis and by forming a smooth, thin film on the surface of the yarn, causing a reduction in protrusion. From Figure 11, unfinished samples, regardless of their yarn type and loose or tight structures, give the best value of OMMC than finished samples. Statistical analysis with the help of main effect plot Figure 12 shows that unfinished crew socks produced from yarn combination A with lose loose structure gives the best results of OMMC.

OMMC of socks.

Main effect plot of OMMC.
Analysis of variance (ANOVA)
In the multi-response model, an analysis of variance technique is used to identify the most important process parameter. The significance of model phrases is determined in terms of F-value or p-value. The F-value is the ratio of the factor mean square to the mean square error. Usually, a factor with a larger F-value has a significant effect on the dependent. The significance of the model parameters can also be identified using a p-value, which is less than the α level of significance (5% theoretically). ANOVA is employed to the values of input parameters to identify the significant influence on all the dependent parameters of thermo-physiological comfort for which the p-value is less than level of significance, 5% in this study. The statistical analysis of data was carried out using Minitab 17 software. p-Value (Table 7) shows whether the effect of the input factor on responses is significant or not. It ranges from 0 to 1, and its lower value suggests that the effect of input on output is more significant. Any term with p > 0.05 shows a lack of significance at a confidence level of 95%. Pilling resistance w.r.t Yarn combination and finishing give a p-value of 0.003 and 0.006 respectively. Hence, yarn combination and finish significantly affect the pilling resistance of socks. In contrast, the structure effect has a p-value of 0.142 and is an insignificant factor for the pilling properties of socks. Thermal resistance w.r.t Yarn combination and finishing give a p-value of 0.001 and 0.009, respectively. Yarn combination and finish have a significant effect on the thermal resistance of socks. In comparison, the structure effect has a p-value of 0.283 and is an insignificant factor for the thermal properties of socks. Air permeability of socks w.r.t Yarn combination, finishing, and sock’s structure gives a p-value of 0.00787, 0.128, and 0.213, respectively. From the p-values, yarn combination, finish, and sock structure are insignificant factors for the air permeability properties of developed socks.
p-values of significant factors for different response variables.

Regression analysis
Regression analysis is a statistical method used in statistical modeling to estimate the associations of relationship between two sets of variables called as dependent and independent variables. Independent variables are the input factors considered during experimentation, and dependent variables are the desired outputs whose analysis is required. 31 Adequate regression analysis requires numeric input variables; hence, for regression analysis finish factor was converted into finish concentration having two levels of 0% and 3%. Tight structure was proclaimed the stitch length of 0.22 cm and loose was of 0.30 cm. However, yarn combination was kept as it was making it a categorical variable. Modified experimental factors and levels for regression analysis have been presented in Table 8. Three different regression equations were achieved for each characterization keeping three categorical yarn combinations. Table 9 highlights the regression equations of response variables. R-square percentage values achieved in acceptable limits make the regression model adequate for this study and for future predictions also.
Experimental factors for regression analysis.

Regression equations.

Contour plots
Contour plot is a method of displaying a three-dimensional surface in a two-dimensional space by use of the charting of constant z slices. So, if one knows the value of Z line/contour between the points (X,Y) can be drawn that correspond to that value of Z. Trends of response variables can be examined w.r.t any of two desired independent variables. Figure 13 shows the contour plot analysis of pilling performance with input variables. Increasing finish percentage at loose structure tightness exhibits the highest pilling performance of >4.6; however, least performance of <3.00 was observed for tight structure and least finish percentages. Pilling performance was also higher for tight structure and highest finish percentage, and an optimum performance was experienced on adequate finish percentage and structure tightness.

Contour plots: Pilling performance.
Thermal resistance contour plot analysis reveals an increasing thermal resistance trend with least finish percentage and tight structure holding the yarn combination A (Figure 14). However, for yarn combination B, thermal resistance was optimum at high finish percentage and loose structure, while the highest values were experienced at least finish percentage and loose structure, and the similar trend could be seen in yarn combination C. Figure 15 entails the air permeability trends w.r.t changing finish percentage and structure tightness. Almost similar trend was exhibited by each yarn combination. Increasing finish percentage decreased air permeability, while the highest air permeability values were experienced at tight and medium stitch length, and least finish percentage. The OMMC index also followed same trend of decreasing overall moisture management capability with increasing finish percentage and tightness of structure (Figure 16).

Contour plots: Thermal resistance.

Contour plots: Air permeability.

Contour plots: OMMC index.
Conclusion
Temperature, moisture, and skin airflow affect thermo-physiological comfort. This study investigated the pilling and comfort aspects of sandwich terry crew socks, as well as the effects of different materials, structure, and polyurethane finish. Single-ply wool/PP yarn has the best pilling, air permeability, thermal resistance, and OMMC characteristics.
When the operated area is less in yarn combination “A,” less pilling is noticed, and when it’s greater in (B and C), more pilling occurs. No influence of loose or tight structure was detected. A polyurethane finish reduces pilling by 0.5–1 grade creating a thin, smooth coating on the yarn to smoothen.
C-category yarns are denser than A and B. Increasing GSM reduces air gaps between strands, reducing thermal insulation. Loose structures trap more air between yarn gaps, increasing heat resistance. Polyurethane coating reduces surface friction and thermal insulation to prevent pilling.
Because of large porosity, loose knitted structures were more air permeable. Material combination “A” has higher porosity in a knitted specimen, enabling more air to travel through, whereas B and C have the least due to increased structural density and GSM. As the finish generates a coating on the sample, it reduces the porosity of knitted socks.
Loose structures are more porous, and their moisture management properties are better due to the availability of spaces. Unfinished samples, regardless of their yarn type and loose or tight structures provided the best value of OMMC than finished samples.
Therefore, it is concluded that material combination “A” having a loose structure can prevent the pilling of wool/polypropylene knitted socks while maintaining the good comfort attributes of the latter. The use of a finish enhanced the pilling performance at the expense of the comfort characteristics. For maximum ease and minimum pilling, it requires careful engineering and selection of optimal parameters.
Footnotes
Declaration of conflicting interests
The author(s) declared no potential conflicts of interest with respect to the research, authorship, and/or publication of this article.
Funding
The author(s) received no financial support for the research, authorship, and/or publication of this article.