
Abstract
This article focus on derive the process-structure-property relationship of Poly(
Introduction
Poly(
It is well known, a variety of filament and nonwoven structures of PLLA fibers can be manufactured by means of traditional and novel spinning techniques include melt spinning,13,15 –19 solvent spinning,20,21 and electrospinning.22 –24 Among them, the melt spinning is a well-established technology for preparing PLLA filaments. It has been developed since the 1960s with a high productivity and output of fibers caused by the high throughputs and take-up speeds during process. 15 All these characteristics make melt spinning be the most widely used way to produce large quantities and commercial PLLA fibers industrially. In addition, melt spinning is solvent-free, which is healthy for operating personnel and beneficial to the environment. There are two typical technological processes in melt spinning: high-speed spinning16,25 and two-step spinning.26,27 Different from the high-speed spinning, two-step spinning process is more stable and commonly used for producing PLLA fibers in recent years. The detailed operation procedure is described as follow 28 : PLLA chips are firstly heated in the extruder at the temperature above the melting point. Then the melt is extruded through the spinneret, a die with several holes, and cooling in the air to produce the multifilament accompanied with the take-up process by the winding device. The filaments prepared during this process are called as-spun fiber. Finally the as-spun fibers are drawn to a certain ratio at the temperature above PLLA’s glass-transition temperature (hot drawing process) and become the final fibers.
The complex technological parameters, including spinning temperature (T spinning ), spinning rate, drawing temperature (T drawing ) and draw ratio have a complicated influence on the structure and properties of PLLA fibers. The studies presented by Mezghani and Spruiell 16 show that the crystallinity and the crystalline orientation of PLLA fibers increase as the spinning rate increases (<2000 m/min). At the same time, fibers’ yield strength grows as spinning rate added. The effect of drawing temperature on PLLA fibers is explored by Okuzaki et al. 29 In their work, a weak enhancement on the Young’s modulus and tensile strength of PLLA fibers is obtained by improving the drawing temperature. Cicero et al.27,30 prepared PLLA fibers by two-step melt spinning and made a detailed research on the supramolecular morphology, and mechanical properties of PLLA fibers with the variation of draw ratio. Similarly, Persson et al. 13 investigated the effect of drawing process variables on the physical properties (such as crystallinity, mechanical property, and ductility) of PLLA fibers with different molecular weight and explored the relevance of the fiber formation, solid-state drawing and drawing temperatures. According to the previous research, the influence of the parameter changes in melt spinning or hot drawing stage on the crystallization behavior becomes the main concern to modify PLLA fiber. However, the correlations among the process condition, structure and property for PLLA fibers are seldom reported. Given the industrialized and technical importance, systematic studies on the dominant role for the enhancement of PLLA fibers are of great interest.
In order to give a more clear understanding for the relationship of process-structure-properties of PLLA fibers, the effects of melt-spinning parameters on the crystallization behavior and mechanical properties of PLLA fibers were researched. The relevance of the crystallinity, lamellar orientation, strength and Young’s modulus is probed simultaneously and a nearly linear tensile strength-Herman’s orientation parameter relationship has been revealed in this paper, which shows that the orientation structure plays a dominant role to enhance PLLA fibers. The results provide a guideline for the performance regulation of PLLA fiber during melt-spinning process.
Experimental section
Materials
Commercially available PLLA (Nature Works® 4032D) was used for fiber preparation. The number-molecular weights (Mn) and weight-average molecular weights (Mw) of PLLA are 1.1 and 1.7 × 10⁵ g/mol, respectively. The content of
Fiber preparation
After drying in the vacuum oven at 60°C for 12 h, commercial PLLA was extruded by twin-screw extruder (TSSJ-25) and cut to chips to obtain the excellent product feeding during spinning. The temperatures from feed zone to nozzle zone were set from 160°C to 190°C and a screw speed of 120 rpm was applied during extrusion process. Then PLLA chips were dried under vacuum at 60°C for 24 h and the granulate PLLA were fed into before melt spinning. To investigate the effects of spinning temperature and spinning rate on PLLA fibers, four temperatures (Tspinning = 190°C, 200°C, 210°C, and 220°C) equipped with three winding speeds (v = 140, 280, and 400 m/min) were chosen during spinning, respectively (see Tables 1 and 2). Meanwhile, all take-up godet rollers were heated to 80°C to insure the macromolecular mobility of PLLA.
The temperatures for different heating zones during spinning.

The speeds for different godet rollers during spinning.

Then hot drawing was carried out by passing as-spun fibers through the heat zones and a difference in the speed of two godet rollers was controlled for setting draw ratio. In practice, it is found that when T drawing is too low, the fibers will broke or whitened, while they will be burn out at too high T drawing . Based on it, two adequate drawing temperatures (Tdrawing = 90°C and 100°C) were chosen in case of bad drawing process. A constant entrance rate was using for take-up godet roller and PLLA as-spun fibers were drawn up to different levels by fast roller and three draw ratios (1, 1.5, 2)were selected to match with the T drawing . For example, a draw ratio of 2 would represent that the fibers have been drawn to twice their original length. The detailed experiment parameters were shown in Table 3.
The experiment parameters during drawing.

M-N is used to refer to the drawing conditions. For example, 100-1 means the drawing temperature is 100°C and the draw ratio is 1. To realize the dimensional stability of fibers, all of the PLLA fibers which have been treated at different conditions were annealed at 110°C for 10 min. The melt spinning process and equipment diagram was shown in Figure 1.

Schematic representation of melt spinning setup: (1) distributor and spinneret; (2) take-up godet roller; (3) roller 1; (4) roller 2; (5) roller 3; (6) heater; (7) fast roller; and (8) winder.
Differential scanning calorimetry (DSC)
PerkinElmer pyris-1 DSC (USA) was employed for thermal analysis. PLLA fibers were cut into powder and heated from 30°C to 200°C at a rate of 10°C/min under the nitrogen atmosphere. Formula (1) was quoted to calculate the crystallinity (

Where ∆Hm and ∆Hcc represent the experimental melting enthalpy and cold crystallization enthalpy respectively; and ∆H0m is defined as theoretical value of melting enthalpy for 100% crystallization of PLLA.
Two-dimensional wide-angle X-ray diffraction (2D-WAXD)
2D-WAXD experiments were accomplished on a Bruker D8 Discover X-ray diffractometer which was equipped with a Vantec 500 detector. A bundle of PLLA fibers, which have been assembled in order, were placed 8.3 cm away from the detector and perpendicular to the beam. The following equations (2) and (3) were used to calculate the Herman’s orientation parameter (f).


The angle between the normal of a given crystal plane and the fibers’ direction was defined as φ; I represents the corresponding integral intensity.
Scanning electronic microscopy (SEM)
Then the surface and section morphologies of PLLA fiber were observed by the field-emission SEM (FEI Company, USA) with an accelerated voltage of 10 kV. The fiber bundle was rapidly cut at room temperature and the fiber section was therefore formed for SEM testing. Gold spray treatment was applied on fibers before testing.
Mechanical properties
The mechanical properties of the single fiber were evaluated by an YG001A electronic monofilament strength tester (Textile Instruments Factory, China). The environmental conditions of tensile experiment were set at 23°C and 40% for relative humidity. The experiments were performed with a crosshead speed of 20 mm/min and at least 30 fibers for each sample were test and the average values were reported.
Results and discussion
Spinnability and morphology
Polymer spinnabiliy during melt spinning is of considerable importance in relation to fiber formation and good spinnabiliy of PLLA melt is the basis on which our experiments can be carried out. The pictures obtained during spinning for PLLA at different spinning temperatures are shown in Supplemental Figure S1. When spinning temperature is 180°C, PLLA melt doesn’t form fibers after extruding along with serious melt rupture phenomenon (Figure S1a) during cooling. Then a higher temperature is chosen to improve the flowability of PLLA melt. When spinning temperature is set at 190°C, 200°C, 210°C, and 220°C separately, all batch fibers have been spun smoothly and few broken threads happen during spinning (Supplemental Figure S1(b)). However, the spinnability of PLLA melt gets worse when spinning temperature raises over 220°C. It can be seen from Supplemental Figure S1(c), a certain degree of droplet has formed around the edge of orifices. At the same time, the winding process is interrupted frequently due to the filament break, which is ascribed to an undesired thermal degradation in PLLA molecular weight at high temperature (230°C). 31 Based on this, a temperature interval (190–220°C) is chosen for PLLA spinning in order to avoid notable thermal degradation and ensure a stable formation of as-spun fibers in this work.
Meanwhile, the effect of spinning rate on fiber morphology was evaluated by SEM. The cross sections of PLLA fibers spun at 190°C with different spinning rate exhibit subcircular or non-circular as shown in Figure 2. It is because that the fibers cut at room temperature were deformed. SEM test is also applied on fibers’ surface topography and a smoother morphology is found at the fibers with the faster spinning rate (Figure 2(c)). Another significant change in size is found within expectations that the spinning rate increases and the size decreases. Satisfactorily, it can be seen that the dimensional homogeneity is good in all of the samples.
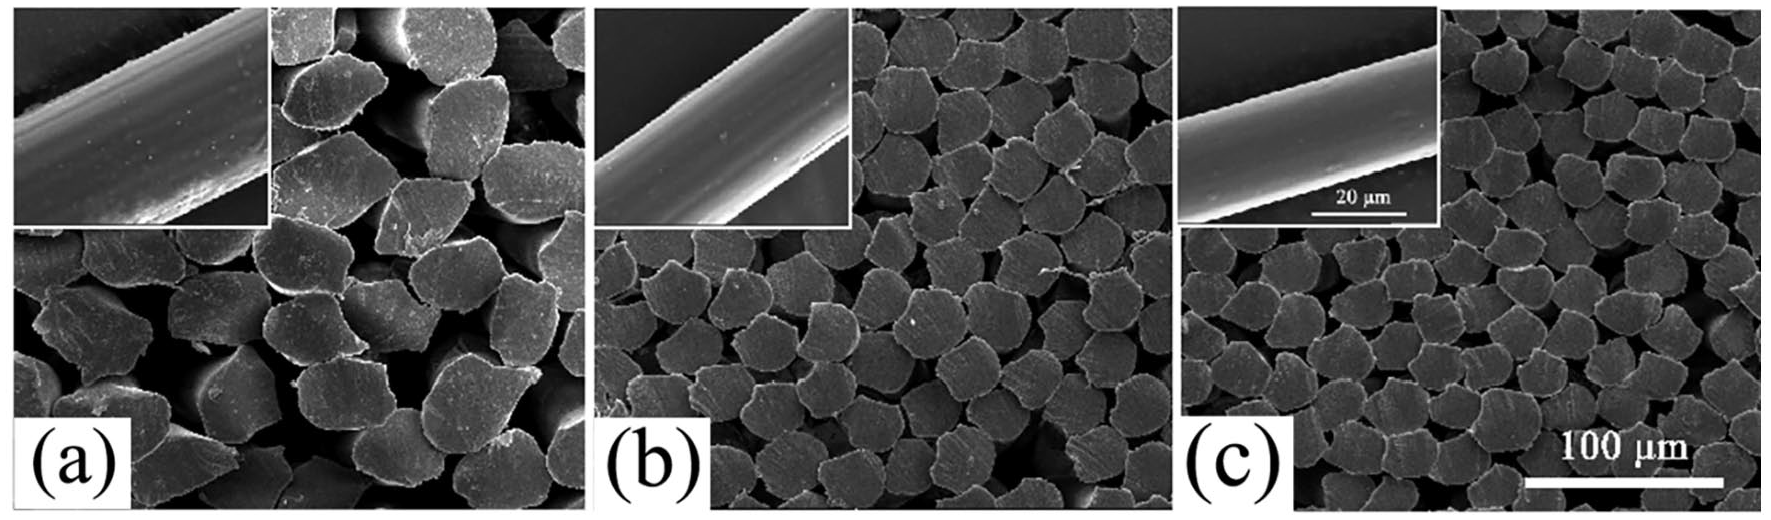
SEMimages of as-spun fibers spun at different speed: (a) v = 140 m/min, (b) v = 280 m/min, (c) v = 400 m/min.
Correlations between the mechanical properties and process condition
Figure 3 summarize the tensile strength of PLLA final fibers. Obviously to see, spinning and hot-drawing parameters make a striking influence on fibers’ strength. PLLA fibers spun at lower temperature and faster winding speed present a higher tensile strength after hot drawing at the same condition, which can be seen in each individual image of Figure 3. On the other hand, increasing T drawing and draw ratio also bring a distinct growth on fibers’ tensile strength. Seen from Figure 3(a) and (e), it reveal an elevation in tensile strength of PLLA fibers (Tspinning = 190°C and v = 280 m/min) from 296 to 499 MPa after drawing at 90-1 and 100-2, respectively. Fibers spun at 220°C exhibit poor performance in tensile strength, which is less than 100 MPa for most samples regardless of the spinning or drawing conditions. There is only a higher value of 237 MPa of tensile strength reached when PLLA fibers are winded at 400 m/min and drawn at 100-2 (Figure 3(e)).

The tensile strength of PLLA fibers drawn at different condition: (a) 90-1, (b) 90-1.5 (c) 100-1, (d) 100-1.5, and (e) 100-2.
The Young’s modulus data have also been obtained from the tensile experiment. It can be seen from Figure 4, the influence of spinning and drawing conditions on Young’s modulus is similar to that on the tensile strength. A lower T spinning and a higher winding speed in spinning process as well as a higher T drawing and draw ratio in drawing process are led to an increase in Young’s modulus of PLLA fiber. It’s worth noting that the effect of spinning rate on both the tensile strength and Young’s modulus becomes weak when the winding speed exceeds 280 m/min, especially when T spinning is 190°C. Beyond that, the extremely high spinning rate brings unstable case during winding process. Comprehensively considering the stability of spinning process and mechanical properties of fibers, the optimal implementation conditions for PLLA fibers are described as follow: the spinning temperature is 190°C and the winding speed is 280 m/min as well as drawing at 100°C for two times. The tensile strength and Young’s modulus of the PLLA fibers spun at this condition are 499 MPa and 5.30 GPa, which are suitable for use in garment industries.

The Young’s Modulus of PLLA fibers drawn at different condition: (a) 90-1, (b) 90-1.5, (c) 100-1, (d) 100-1.5, and (e) 100-2.
Correlations between the structure and process condition
To have a more unambiguously and scientific view of the effect of spinning process conditions on thermal and structural features of PLLA fibers, DSC and WAXD tests are used for PLLA fiber samples spun at various conditions. The DSC first heating run curves of PLLA as-spun fibers are shown in Figure 5. The cold-crystallization peak in each curve is probably caused by the imperfect crystallization during spinning. Clearly, the cold-crystallization peak tends to a higher temperature with the increment of spinning temperature, which is due to an evident difference of the crystallization rate of PLLA caused by a large supercooling during cooling process. This can be compensated by adjusting the cooling atmosphere in the spinning process. In order to ensure the comparability of experimental data, the same natural cooling temperature is chosen in our work. In addition, the cold-crystallization peaks gradually move to the colder zone and weaken with the increase of winding speed. It could be attributed to the orientation of molecules associated with crystallization during the stronger elongational field and more complete crystallization is formed. 32 The data of the crystallinity estimated by DSC curves are shown in Supplemental Figure S2. It shows that the lower T spinning and higher spinning rate are beneficial to improve the crystallinity of PLLA as-spun fibers. The degrees of crystallinity up to 34% and 10% are respectively obtained for as-spun fibers of 190–400 (Tspinning = 190°C and v = 400 m/min) and 220–140 (Tspinning = 220°C and v = 140 m/min).

DSC first heating run curves of PLLA as-spun fibers spun at different spinning temperatures and winding speeds.
The crystalline structure in as-spun fibers will be further improved after hot drawing treatment and more elaborative research are imposed on final fibers. The thermal data of PLLA final fibers obtained from DSC first heating run curves are shown in Figure 6. It shows that the cold crystallization peaks in most heating curves disappear, which suggests that a more perfect crystalline structure has been formed in fibers. However, when drawing temperature cannot reach the cold-crystallization temperature of as-spun fibers, there is still a cold-crystallization peak in the heating curve (consider the blue curve in Figure 6(a) ).

DSC first heating run curves of PLLA fibers drawn at different conditions: (a) 90-1, (b) 90-1.5, (c) 100-1, (d) 100-1.5, and (e) 100-2.
The crystallinity results are shown in Figure 7, which are performed by enthalpy measurement of the heating curves corresponded to Figure 6. Easy to see, the crystallization behavior of PLLA fibers is enhanced with the improvement of drawing temperature and draw ratio. Moreover, the drawing temperature over the as-spun fiber’s cold-crystallization peak can endow fibers a stronger crystallization behavior than that below the cold-crystallization temperature. This should be attributed to the more active movement of PLLA molecular chains when fibers subjected to a tension field.

The crystallinity (%) as determined by DSC of final fibers in Figure 6: (a) 90-1, (b) 90-1.5, (c) 100-1, (d) 100-1.5, and (e) 100-2
It is interesting to note that the increasing trend in fibers’ crystallinity is gradually slowing down with a further increase of drawing temperature and draw ratio. As shown in Figure 7(d) and (e), the crystallinity of some batches are almost the same regardless the spinning and drawing conditions. The relative increase of the degree of crystallinity (R) is calculated by the equation (4) and illustrated in Figure 8.
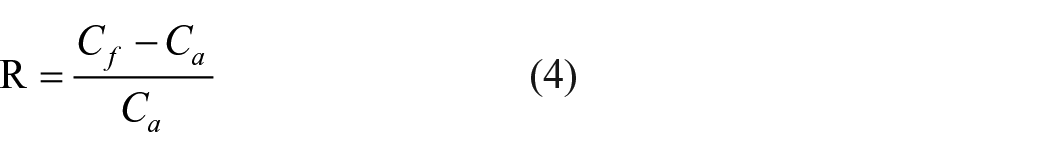
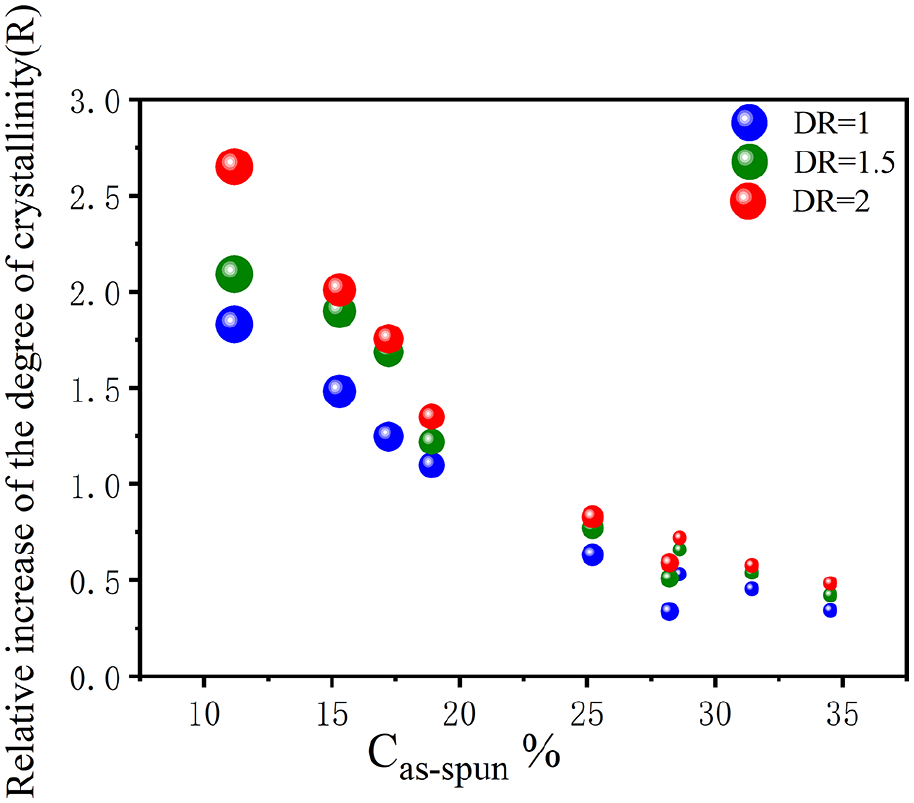
The relative increase of the degree of crystallinity (R) versus the crystallinity of as-spun fibers (
Where
Figure 9 compares the crystal orientation of fibers drawn at 100-2 with different spinning conditions as evaluated by 2D-WAXD measurements. In most cases, the scattering arcs of crystal planes (1 1 0) of α crystal are distributed symmetrically in the meridional direction, which indicates the oriented structure of PLLA lamellae along the axial direction of fibers. However, the dissimilar pattern, a Debye-Scherrer ring, appears in Figure 9(d) and (h), which manifests a weaker oriented structure in PLLA fibers spun at 220°C with a winding speed of 140 and 280 m/min. It indicates that almost no oriented crystal structure has been formed in the PLLA fibers spun at these conditions.

2D WAXD patterns of some representatives: drawing condition is 100-2: (a) Tspinning=190°C,v = 140 m/min,(b) Tspinning=200°C,v = 140 m/min, (c) Tspinning=210°C,v = 140 m/min, (d) Tspinning=220°C,v = 140 m/min,(e) Tspinning=190°C,v = 280 m/min, (f) Tspinning=200°C,v = 280 m/min, (g) Tspinning=210°C,v = 280 m/min, (h) Tspinning=220°C,v = 280 m/min, (i) Tspinning=190°C,v = 400 m/min, (j) Tspinning=200°C,v = 400 m/min, (k) Tspinning=210°C,v = 400 m/min, and (l) Tspinning=220°C,v = 400 m/min.
For direct comparison of the orientation degree, the Herman’s orientation parameter (f) is calculated from the 2D-WAXD data and illustrated in Figure 10. As a whole, the orientation degree of PLLA fibers represented by f becomes higher with the increase of spinning rate as well as the reduction of spinning temperature when the drawing condition is settled at 100-2 (Figure 10(a)). It is worth noting that when spinning temperature is 190°C, the orientation degree of as-spun fibers winded at 280 m/min is unexpectedly higher than that achieved at 400 m/min after drawing at 100-2 condition. It is generally believed, a higher spinning rate can endow a stronger elongation filed on polymer melt and promote more molecular chains to disentangle and stretch. However, the molecular orientation occurred during hot-drawing is mainly via destroying the lamellar crystalline phase by pulling chains out from the crystals in as-spun fibers. 33 The stress induced crystallization and orientation during hot-drawing is in analogy with the recrystallization process. It is difficult for as-spun fibers with extremely high crystallinity to recrystallization during this drawing condition (100-2) and more structure defect will form caused by the crystal broken and lamellar slip, which leads to a weak oriented structure in PLLA fibers. In the actual process of drawing, the rupture and instability problems are obvious in the filament winded at 400 m/min. It’s believed a higher drawing temperature is needed to disorient the chains in original crystallization regions for fibers with high crystallinity. While PLLA fibers will be scalded at excessive drawing temperature due to their poor heat resistance. Combine the crystallization data above, the difference in orientation of PLLA fibers is largely related to as-spun fibers’ crystallization behavior. It demonstrates namely that the orientation of final fibers could be influenced by adjusting the spinning parameters, include but not limited to the spinning temperature and winding speed.

Herman’s orientation parameter of: (a) PLLA fibers via different spinning conditions after drawing at 100-2 and (b) PLLA fibers via different drawing conditions after spinning at 190°C with a spinning speed of 280 m/min.
The Herman’s orientation parameters of PLLA fibers with the same spinning process (Tspinning = 190°C and v = 280 m/min) but different hot-drawing conditions are presented in Figure 10(b). It should be point out that the maximum draw ratio during hot drawing varies with the T drawing . When Tdrawing = 90°C, the value is 1.5 times while two times can be obtained when the drawing temperature rises to 100°C. Not only that, but the fibers exhibit worse when drawn at 90°C than at 100°C, such as more broken threads happen. It can be observed from Figure 10(b) that the orientation degree is improved as the T drawing and draw ratio increase. It indicates that a higher drawing temperature can increase the molecular chains’ mobility of PLLA fibers and benefit to achieve a higher draw ratio, which can impose stronger force field on fibers during drawing. And then the oriented structure can be enhanced effectively. However, to keep fibers from fusing, the drawing temperature can’t be further increased limited by the equipment conditions.
The reported melt-spinning process parameters and properties of PLLA final fibers are compared with the results in this work and summarized in Supplemental Table S1. The PLLA used here has a low MW and contains
Correlations between the mechanical properties and structure
Combine the results in 3.2 and 3.3, a conjecture is come up that there is a strong correlation between the structure features and mechanical properties of PLLA fibers. The crystallinity, orientation degree, tensile strength as well as Young’s modulus data are summarized and the relationship between them is established in Figures 11 and 12. Firstly, the samples whose crystallinity difference is less than 3% are chosen to depict the tensile strength dependence of the Herman’s orientation parameters. The data are linear fitted by computer and the degree of fitting (R2) for green line is 0.94 (Figure 11(a)). It can be observed that the tensile strength of PLLA fibers is improved lineally with the increase of Herman’s orientation parameters (f = 0.08–0.18). Namely, it means that the growth trend in fiber tensile strength caused by orientation degree has negligible relation with fiber crystallinity in a certain range. Then tensile strength data of PLLA fibers with nearly the same orientation (f < 0.02) is plotted against the crystallinity data (Figure 11(b)). It can be seen that the effect of crystallinity on tensile strength is complex. The tensile strength by and large increases with the change of crystallinity data. But there are some outlier spots against the trend, which causes a failure to obtain a standard and accurate curve by linear fitting.

(a) The f dependence of tensile strength. The solid line shows the fitting curves of tensile strength and the crystallinity difference of samples is less than 3%. (b) The crystallinity dependence of tensile strength. The orientation difference of samples is less than 0.02.

(a) The f dependence of Young’s modulus. The dotted line shows the fitting curves of data and the crystallinity difference of samples is less than 3%. (b) The crystallinity dependence of Young’s modulus. The orientation difference of samples is less than 0.02.
The f and crystallinity dependence of Young’s modulus are manipulated in the same way. Unlike tensile strength data, the Young’s modulus shows a nonlinear increasing trend with the change of orientation degree and a dotted blue line is obtained by Boltzmann fitting as shown in Figure 12(a). The Young’s modulus increases slowly for Herman’s orientation parameter below 0.12 and a rapid growth trend of Young’s modulus appears when f above 0.12. A reasonable explanation is put forward as follow. The superstructure evolution of PLLA contains the transformation of crystalline and amorphous phase during spinning process. The amorphous orientation is poor in PLLA fibers with low orientation degree. The weak van der Waals interaction force between crystallite lamella becomes the main force to be overcome during tensile experiment, which causes a low value of Young’s modulus. However, more orderly and perfect lamellae orientation of PLLA has formed and the orientation of molecular chain in amorphous region is also improved along with the increase of f value. Therefore, the Young’s modulus value of fiber is greatly improved. The Young’s modulus of PLLA fibers with nearly the same orientation (f < 0.02) is plotted against the crystallinity data (Figure 12(b)). As same as the result in Figure 11(b), the Young’s modulus of some samples increases gradually with the enhancement of crystallinity but there is no obvious increasing relationship between them. More elaborative and detailed research pertinent to the enhancement mechanism between the structure and mechanical properties of PLLA fibers will be carried out in our further study.
The crystallinity as a function of Herman’s orientation parameter is shown in Supplemental Figure S3. A nearly monotone growth appears between the crystallinity and orientation degree of PLLA fiber. The elongational fields during spinning and drawing process accelerate the alignment of molecular chains, which is beneficial to form thicker and more perfect PLLA lamellae. 36 Similar to Figures 11 and 12, there are some points that deviate from the growth trend in Supplemental Figure S3. It is inferred to the unstable performance of spinning and drawing equipment, which will be avoided as much as possible in future studies.
Conclusion
In summary, we have demonstrated that the crystalline behavior and mechanical properties of PLLA fibers depend very much on the spinning parameters. Under the premise of well spinnability of PLLA melt and desired stabilization of spinning process, PLLA fibers spun at a lower spinning temperature and higher winding speed as well as drawn at higher temperature for a bigger ratio prone to higher tensile strength and Young’s modulus. The crystallization analysis demonstrated that crystallinity of fibers is improved as spinning temperature drops lower and spinning rate rises. The crystalline behavior of fibers can be further enhanced and a value of about 50% in the crystallinity is obtained for most final fibers after drawing treatment eventually. However, there is no more obvious improvement can be obtained for the crystallinity of PLLA fibers by adjusting the spinning and drawing conditions, which can be due to the 2%
Supplemental Material
sj-docx-1-jef-10.1177_15589250221148850 – Supplemental material for The study of correlations among the process condition, structure and property for poly(l-lactide) fibers
Supplemental material, sj-docx-1-jef-10.1177_15589250221148850 for The study of correlations among the process condition, structure and property for poly(l-lactide) fibers by Huixian Zhang, Hongwei Bai, Nan Wang, Qin Zhang and Qiang Fu in Journal of Engineered Fibers and Fabrics
Footnotes
Declaration of conflicting interests
The author(s) declared no potential conflicts of interest with respect to the research, authorship, and/or publication of this article.
Funding
The author(s) disclosed receipt of the following financial support for the research, authorship, and/or publication of this article: This work was financially supported by National Natural Science Foundation of China (Nos. 51673133 & 52103038).
Supplemental material
Supplemental material for this article is available online.
References
Supplementary Material
Please find the following supplemental material available below.
For Open Access articles published under a Creative Commons License, all supplemental material carries the same license as the article it is associated with.
For non-Open Access articles published, all supplemental material carries a non-exclusive license, and permission requests for re-use of supplemental material or any part of supplemental material shall be sent directly to the copyright owner as specified in the copyright notice associated with the article.