
Abstract
Wool fabrics are preferred over synthetic and cellulosic fibers by consumers because of their good elasticity, warmth, and high moisture sorption. How to use new materials and new methods to break the bottleneck of high pollution and high energy consumption in wool dyeing and finishing, and develop new functional wool materials has become an urgent need of wool development. In this paper, wool is colored and functionalized with antistatic properties using one-step ecofriendly process by superfine graphene oxide (GO). The results of the assembly mechanism show that the adsorption thermodynamic behavior of GO on wool is more consistent with Langmuir model and the process is exothermic similar to the adsorption of conventional acid dyes on wool fibers. The kinetic behavior results indicated that adsorption behavior of GO on wool was identified, and the phenomenon was more in line with the quasi-secondary dynamics model. The antistatic test results showed that the antistatic performance of the wool fabric that was colored by GO was obviously improved and the half-life of the GO colored wool fabric could be as low as 0.17. The strategy of colored fabrics with GO and imparting additional functionality can provide a basis for the ecological processing and formation of wool fabrics with designed functions.
Introduction
Wool is one of the most prominent protein fibers known for its good hand, excellent moisture absorption, breathability, comfort and other properties. Natural wool comes in a few limited colors and hence wool fibers are dyed using dyestuffs, and primarily acid dyes. Although acid dyes form an ionic bond and/or hydrogen bonds with wool and provide good performance, the amount of dye in the waste water is of concern. In addition to the dye, wool dyeing waste water contains benzene, heavy metals, and other chemicals which are found to release formaldehyde, ammonia, and polybenzenes that cause pollution and affect human health. Some acid dyes also contain azo groups which are considered as carcinogenic and also lead to sensitization of the skin. 1 To regulate the potential risks associated with wool dyes, Oeko-Tex standard 100 and REACH regulations are followed. Considerable research is also being done to develop new and modified environmentally friendly wool coloration method. 2
In addition, traditional wool processing needs to go through multiple processes such as dyeing and finishing one by one (see Figure 1). The lengthy process is not only time-consuming, but also energy-intensive because almost every process requires high temperatures. Under the great pressure of carbon emission pressure, it is urgent to explore more energy saving and clean wool dyeing and finishing methods. Therefore, how to make effective use of new environment-friendly materials and design efficient short processing methods that can dye and function finish wool in one bath will become the focus of the development of fabric preparation.

Comparison between the traditional dyeing-finishing process and GO coloration process.
Graphene is a honeycomb material which is tightly stacked by a single layer of carbon atoms. It has the advantages of high strength, large specific surface area, good heat transfer performance, 3 and strong electrical conductivity.4,5 Graphene is widely used in biomedicine, 6 energy storage, 7 composite, 8 aerospace, and for other applications. 9 Efforts have also been made to use graphene in the field of fiber and textiles,10 –12 mainly by padding, coating, or self-assembly processes to improve performance properties of materials.13,14 In such an application, multiwall carbon nanotubes and reduced GO, were partially vacuum-filtrated directly onto Ni-coated cotton fabrics for supercapacitor applications. The composite fabric electrodes displayed typical electrical double layer capacitor behavior and reached an ultrahigh areal capacitance up to 6.2 F/cm2 at a high areal current density of 20 mA/cm2. 15 Kou et al.’s group developed yarn supercapacitors which were prepared by polyelectrolyte-wrapped, carbon nanomaterial core-sheath fibers. The solid-state flexible two-ply yarn displayed a capacitance and energy density of 158 F/cm3 and 3.5 mW/h/cm3, respectively. 16 Ouadil et al. 17 coated GO, graphene, and graphene/silver nano composites on the surface of polyester fabrics, resulting in the improved mechanical and UV protection. In the preceding examples, graphene was applied on the surface of the fibers/yarns by dip-drying or wrapping. In this approach, there was physical trapping of the graphene and no chemical bonding between the fibers and graphene. Also, the graphene which was more than 2 microns was unable to penetrate inside the fibers. During practical applications, most of the graphene is released from the surface and hence the performance of the textiles was not satisfactory. Also, the treated materials could not be washed as most of the graphene would be released. Unlike graphene, GO has many polar groups, such as carboxyl groups, hydroxyl groups, epoxy groups, etc., which can provide strong interactions with the fibers.18,19 The structure of GO is a two-dimensional sheet, and such macromolecular structure exhibits strong intermolecular attraction with the fiber, leading to higher adsorption capacity and better coloration performance. The strong chemical interactions and potential for high sorption makes GO an ideal solution for improving the coloration and performance of textile materials.
Xu et al. 20 carried out a study on dyeing wool with GO, and the wool obtained had stable conductivity and sensitivity, which laid a foundation for using GO to finish wool. However, there are few studies on GO finishing wool in this field. Moreover, there is still a lack of systematic research on the adsorption mechanism of GO on wool surface and the arrangement of graphene on wool, which has formed a certain obstacle to promoting the research and development of new wool materials based on GO finishing.
Previous studies have demonstrated the influence of tris(2-carboxyethyl) phosphine on the dyeing of wool with natural dyes and investigated the kinetics and thermodynamics of the dyeing process. 21 Moreover, the diffusion coefficient of dyes were increased while the dyeing entropy and enthalpy decreased in the presence of tris (2-carboxyethyl) phosphine. We have also successfully fabricated flexible conductive devices through the layer-by-layer assembly of GO on the surface of viscose fibers followed by the reduction of GO to graphene. 22 In addition, we also assembled and reduced GO on the surface of viscose yarns and later developed knitted and woven fabrics. The results provided a theoretical basis for the design and preparation of flexible conductive devices with potential applications in energy storage/conversion, wearable sensors, transparent conducting films, flexible cells, and so on. 23
The main purpose of this paper is to explore the application potential of GO in wool dyeing and finishing, thus providing a basis for the development of new wool materials based on GO finishing. Therefore, the dyeing of wool with traditional dyes was taken as a reference in order to achieve a comprehensive evaluation of the color and function of the wool after GO finishing.
The superfine GO is assembled onto wool fabric by dip-dyeing process and the surface and internal morphology of the colored fibers were analyzed, and the assembled kinetic and thermodynamic analysis was investigated. In addition, the electrical properties of colored fabrics were tested and analyzed, which provided a basis for the design and preparation of new environmentally friendly functional fabrics. As shown in Figure 1, since GO is the main material in our system and there are no other harmful substances used, the residue can be recovered by simple processes such as filtration and evaporation with recovery rate as high as 60%–70%. Besides, compared with the traditional dyeing-antistatic finishing processes, coloration by GO eliminated the need for antistatic finishing process of wool fabrics and hence saved about 30% energy and 30%–40% water.
Experiment section
Materials
100% wool woven fabric (Double layer weave, 540 g/m2), graphite powder (particle size < 30 μm) were purchased from Sinopharm Chemical Reagent Co. Ltd., China. Other reagents, including sulfuric acid (H2SO4, 98%), hydrochloric acid (HCl), hydrogen peroxide (H2O2, 30%), hydrazine hydrate (N2H4·H2O), Sodium acetate (CH3COONa), sodium nitrate (NaNO3), and potassium permanganate (KMnO4), were supplied by the Sinopharm Chemical Reagent Co. Ltd., Shanghai, China. The water used in this experiment was deionized water.
Preparation of GO
GO was prepared using the modified Hummers method. 24 The preparation process is as follows: 230 mL of concentrated sulfuric acid and 5 g of sodium nitrate, 10 g of graphite powder, and 30 g of potassium permanganate are added to the beaker and after being uniformly mixed, the reaction is stirred at low temperature for about 1 h to obtain a graphite intercalation composite; then it is heated up to 45°C and continues to react for 30 min, then add 460 mL deionized water, and let it react for 30 min; then add 1400 mL deionized water and 50 ml 30% H2O2. The solution will turn from brick red to yellow after the H2O2 is added indicating that the oxidization has taken place. To ensure that the product is fully formed, the reaction continues for 15 min. The mixture is then washed three times with 3% diluted HCl. Then, it is washed with deionized water several times and ultra-sonicated for 4 h to obtain GO.
Dipping-coloration of wool fabric
Pretreatment of wool fabric: using wool degreaser, the wool fabrics were washed at 50°C for 30 min and the fabrics were subsequently washed with water and then dried.
Coloration prescription
The wool fabric was dipped using a bath ratio of 1:30 and a dyeing time of 30 min. Acetic acid and sodium acetate were used as a buffer solution. Using a specified amount of GO dispersion, coloration conditions such as set temperature, pH value, GO concentration were varied. After the dipping process, a hydration hydrazine reduction was done at a hold temperature of 80°C for 4 h. Later, the treated fabrics were washed with cold water and the residual liquid was collected to, measure the absorbance. The specific coloration process is shown in Figure 2.

The curve of coloration process.
Determination of the standard work curve
Prepare 0.05 g/L of GO stock dispersion, take 1, 2, 3, 4, 5,and 6 mL in a 50 mL volumetric flask then determine the absorbance at the maximum absorption wavelength (242 nm) after constant volume and draw a standard curve as shown in Figure 3.

The standard curve of GO dispersion.
Assemble thermodynamics
In this paper, the Langmuir model and the Freundlich model were used to study the assembling mechanism of GO on wool.
The Langmuir type adsorption isotherms are commonly described by equation (1):

Where qɛ represents the amount of adsorption on the fiber during assemble equilibrium, mg/g; Cε represents the GO concentration in the solution at the assemble equilibrium, mg/mL; Q represents the equilibrium of the GO on the surface of the fiber to form a complete monolayer adsorption amount, mg/g; b represents the constant associated with the localization adsorption.
By doing a 1/qε-1/Cε plot, a straight line can be obtained and Q and b can be calculated using the slope and intercept. The degree of conformity of the experimental data to the model was evaluated by the regression coefficient R 2 .
The kinetic parameters such as Gibbs free energy ΔG°, coloration heat ΔH°, and coloration entropy ΔS° can be calculated according to formulas (2)–(4).


The Freundlich type adsorption model can be expressed by the formula (5).

In the formula, Qf can roughly indicate the fiber-to-dye capacity, mg/g; 1/n represents the adsorption density; Qf and n can be obtained by the intercept and slope of the lnqε-lnCε line, respectively.
Assemble dynamics
In order to analyze the assembling mechanism of GO on wool fiber more accurately, the (6) Lagergren first-order rate equation and the (7) quasi-second-order kinetic model were used.


Where: qɛ is the equilibrium adsorption amount of the GO on the fiber, mg/g; qt is the GO content on the fiber at the time of coloration t, mg/g; k1 is the first-order adsorption rate constant; and k2 represents the secondary adsorption rate constant.
A straight line graph can be obtained by plotting ln(qε-qt). Comparing the regression coefficient R 2 obtained by linear fitting, it can be seen that the degree of first-order reaction kinetics is consistent and k1 can pass through a straight line. The slope is found similarly, by t/qt plotting t and a line graph is obtained, and the degree of conformity to the second-order adsorption kinetic model was judged by linearly fitting the regression coefficient R 2 .
Characterization of colored wool fabrics
The samples was analyzed by SEM (Apreo 2, FEI, 2.0 kV). The cross section of the colored wool fabrics was measured by TEM (Titan G2 60-300, FEI) using 200.0 kV. An X-ray photoelectron spectroscopy (K-Alpha, Thermo Fisher Scientific) was employed to analyze the samples using an Al Ka X-ray source (1486.68 eV of photons) and calibrated by setting the C1s peak to 284.80 eV. The K/S value of the colored fabric was measured by Spectrophotometric colorimeter (Color i7, X-Rite) with 7 mm aperture, D65 light source; the fabric inductive static electricity (China LFY-401, Shandong Textile Research Institute) was used to test the antistatic properties of the wool fabric according to GB/T 12703.1-2008. The washing color fastness, rubbing fastness, light fastness, and perspiration color fastness were tested based on AATCC 61-2013, AATCC 8-2007, ISO 105-B-02, and AATCC 15-2013 respectively.
Results and discussion
Characterization of GO sheets
The morphology and dimensional characteristics of the prepared GO samples were characterized by SEM, as shown in Figure 4. It can be clearly seen from the figure that the GO has a two-dimensional sheet structure (Figure 4(a)). The average particle size was 363 nm (calculated by Nano Measurer, Figure 4(b)). Small size of GO suggested that it can form a more dense blanket over the wool scales. Furthermore, the smaller particle size allows for a higher density of chemical groups on the surface, which is very beneficial for the adhesion of GO to the wool surface and the bonding with other GO sheets during the reduction process.

SEM image of GO: (a) the morphology of GO and (b) the particle size distribution of GO.
The GO sheets were tested by XPS to study the carboxyl group content on their surface and the results are shown in Figure 5. By quantitative analysis of the spectrum, it can be seen that the carboxyl group (–COOH) content on the surface of the GO is 32.9%, which makes it easier for adsorption on the wool fiber in relative to the acid dye (the content of the carboxyl group in most carboxylic acid dyes is about 14%). A large number of polar groups surround the GO lamella, which makes it have good water dispersibility, which further promotes the adsorption of GO on the surface of wool. At the same time, the presence of these groups can accelerate the later reduction and help the GO lamella to bond with each other, which plays a crucial role in the firm fixation of GO on the wool surface.

Chemical structure and XPS spectrum of GO: (a) chemical structure, (b) typical XPS spectrum, and (c) the content of each group in the XPS spectrum.
Dipping-coloration process of wool fabric
PH effect
The effect of pH on the coloration of reduced graphene oxide on wool fabric is shown in Figure 6. It can be seen from the figure that the effect of pH on the coloration of reduced graphene oxide on wool fabric is mainly reflected in the color depth of the fabric. In acidic conditions, the coloration of the fabric is the darkest, followed by neutral, while in alkaline conditions, the color is lighter, especially at pH = 8, it is the lightest.

Coloration effect of fabrics at different pH values: pH = X (2.0, 3.0, 4.0, 5.0, 6.0, 7.0, 8.0, and 9.0) is the pH value of a solution that wool fabric samples are colored in.
The K/S value of the wool fabric was used to characterize the amount of reduced graphene oxide, and the results are shown in Table 1. It can be seen from the table that there is no linear relationship between the change of pH and the K/S value of the colored fabric. Under acidic conditions, the K/S value of the fabric is the highest whereas the value is considerably lower under the neutral and alkaline conditions. According to the analysis, under acidic conditions, Zeta potential of GO is negative in a wide range of pH values, and increases with decreasing of pH. 24 For wool, when pH value decreases gradually, its negative charge gradually decreases, and even becomes positive when it is lower than its isoelectric point (about 5). 25 Therefore, the electrostatic repulsion between GO and wool will gradually weaken, and finally convert into electrostatic attraction below the isoelectric point of wool. So, the coloration of wool gradually increases with the decrease of pH value. When the pH value is 2, the K/S value reaches the maximum of 9.2. Under alkaline conditions, the pH value is regulated by sodium bicarbonate, the wool fiber is negatively charged and the GO is also negatively charged, there will be a stronger electrostatic repulsion between them than under acidic conditions. Which hinders the adsorption of GO on wool fabrics. This in turn leads to a reduction in the K/S value. When the pH value is 7, the solubility of GO increases due to the absence of weak acid or weak base salts, mainly caused by the salting out effect, 24 which increases the amount of GO adsorption on wool fibers, thereby increasing the K/S value (see Table 1). It can be concluded that acidic conditions are more favorable to color GO onto wool fabrics.
The K/S values of wool fabrics with different pH values.

Temperature effect
According to the results of the TEM, samples prepared at pH values of 3 and 7 were used to further characterize the effect of temperature on the coloration and the results are shown in Table 2. It can be seen from the table that when the pH value is 3, as the coloration temperature increases (70–90°C), the K/S value of the samples obtained after coloration slightly increases. Because of the elevated temperature, the molecular motion of GO is increased. According to the characteristics of Brownian motion, the higher the temperature, the more intense the Brownian motion and the molecular kinetic energy and diffusion rate of the micro sheets of GO are improved. Making the GO more easily overcome the energy barrier of coloration and they are capable of diffusing into the interior of the fiber, in line with the Arrhenius equation. Moreover, the elevated temperature is beneficial to the softening of the scale layer on the surface of the wool fiber. 26 Increased swelling of the fiber allows GO to easily be inserted inside the fiber. This is the main reason why the K/S value of the wool fabric is slightly increased at 90°C.
The K/S values of wool fabric at different temperatures.
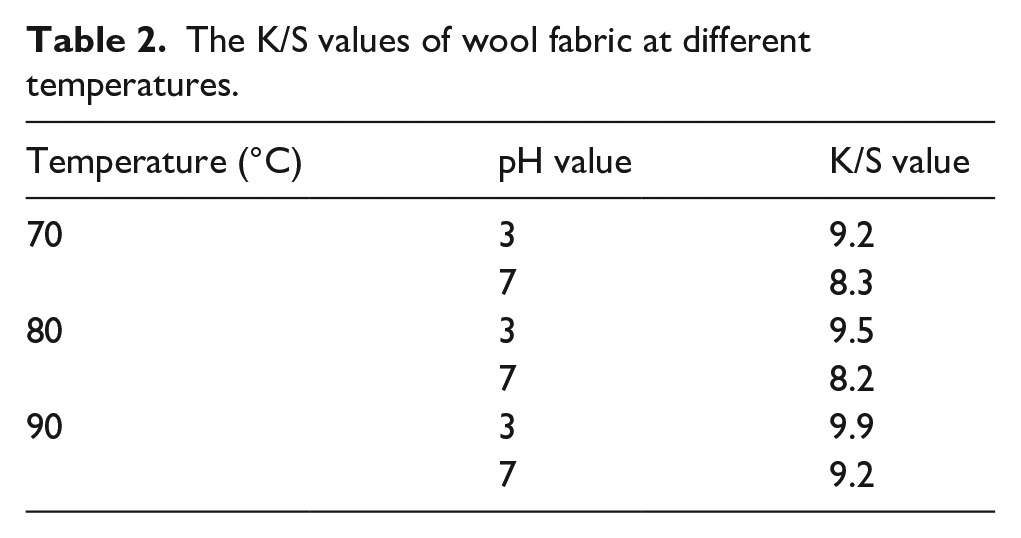
When the pH value is 7, the K/S value of the wool fabric after coloration also shows a slight increase with the increase of temperature, showing a similar law to the pH value of 3, which confirms the previous results. Considering that the temperature is too high, the structure of the wool fabric may be damaged and the low-temperature coloration is energy-saving and environmentally friendly. Therefore, the temperature of 70°C and the pH value of 3 are used to study the effect of GO concentration on the wool fabric.
GO concentration effect
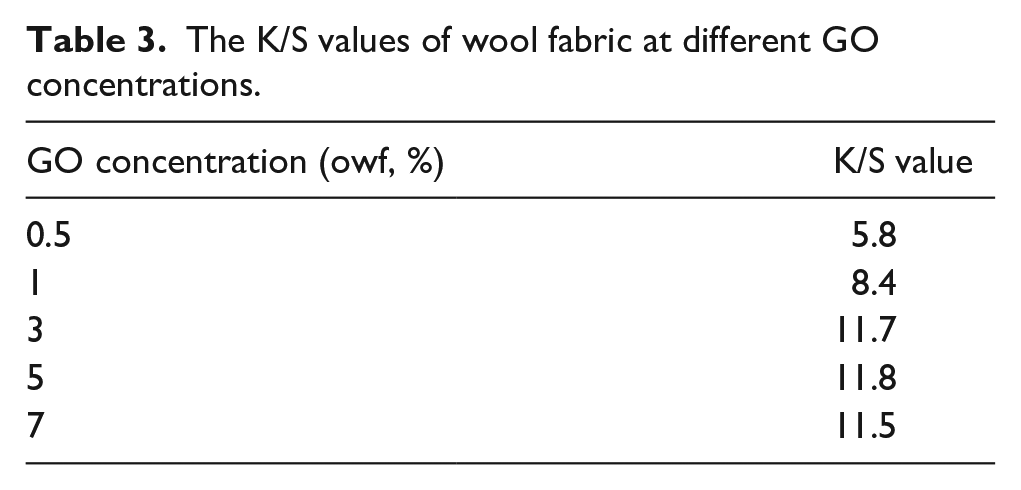
In addition to the temperature influence, the influence of the GO concentration on the coloration effect was also characterized, and the results are shown in Table 3. It can be seen from the table that as the concentration of GO increases, the K/S value of the colored fabric increases. Especially when the concentration is changed from 0.5% to 3%, the K/S increase was very significant and the value reached 11.7. When the concentration of GO is higher than 3%, the K/S value does not change significantly compared with 3%, which indicates that there is a saturated adsorption amount of GO during the coloration process. With the increase of the amount of GO, the coloration position of wool fiber is gradually reduced. When the saturated adsorption amount is reached, even if the amount of GO is increased, it is difficult to increase the adsorption rate.
The K/S values of wool fabric at different GO concentrations.
Characterization of wool surface
TEM
In order to further characterize the attached status of the reduced graphene oxide on the wool fabric, it was tested by TEM (Figure 7). It can be seen from the figure that the wool fabric treated with water in the same way as GO clearly shows a continuous interstitial layer and penetrates between cortical cells (Figure 7(a)). For fabrics finished with GO when the pH value was 4, reduced graphene oxide is inserted into the surface layer of wool fibers through a gap under the upturned flake layer (Figure 7(b)), and presents a light and more uniform gray surrounding the lighter surface of the wool fibers (Figure 7(c)). The small pieces of reduced graphene oxide that enter the gap between the scales will further bind to the large piece of reduced graphene oxide through similar compatibility affinity, helping the large piece of reduced graphene oxide to stick firmly to the surface of the wool fiber (Figure 7(d)). This anchoring greatly improves the fastness of large scale of reduced graphene oxide, which plays a key role in the coloring and electrical properties of wool fibers.

TEM images of different wool fabric samples: (a) the wool fabric treated with water in same way as GO, (b) the smaller-scale reduced graphene oxide below the upturned layer of scale, (c) the reduced graphene oxide on surface layer of wool fibers, and (d) the bigger-scale reduced graphene oxide on the surface of wool fibers.
XPS
Figure 8 shows the XPS spectrum of wool fibers treated with different conditions. By comparing Figure 8(a) and (b), it can be found that the content of C = O on the surface of wool fiber is significantly increased after GO treatment, which is obviously due to the abundant –COOH in GO, and also indicates that a significant amount of GO is adsorbed on wool fiber. By comparing Figure 8(b) and (c), it is found that the content of C = O is significantly reduced after reduction treatment, which is due to the full reduction of the –COOH of GO.

XPS spectrum of wool samples: (a) untreated wool fibers, (b) wool fibers treated with GO, and (c) reduced graphene oxide wool fibers.
SEM
Figure 9 shows the SEM of wool fibers. As can be seen from the figure, compared with untreated wool, it can be observed from the photos of different magnifications that wool fibers after GO finishing and reduced graphene oxide finishing are respectively attached to a layer of GO and reduced graphene oxide, and the morphologies of GO and reduced graphene oxide attached to wool fibers can be clearly observed from Figure 9(6) and 9(9), respectively. In addition, by observing 5 and 8, it can be found that GO and reduced graphene oxide are more distributed at the boundary of the scale layer. These GO and reduced graphene oxide filled the boundary of the scale layer to a certain extent, which reduced the bulge of the observed scale layer. This can also be obviously observed after comparing Figure 9(4) and 9(7) with 1. In conclusion, it can be proved that GO can form a significant amount of adsorption on the wool fiber surface after finishing, which provides a structural basis for giving certain electrical properties to wool. Moreover, this adsorption mostly occurs at the junction between the scale layer and the wool fiber, which is helpful for the adhesion fastness of reduced graphene oxide on the wool fiber.

SEM of wool samples: 1–3 represents different magnification untreated wool fibers, 4–6 represents wool fibers treated with GO, and 7–9 represents reduced graphene oxide wool fibers.
Assembly mechanism analysis
Assemble thermodynamics
Figure 10 is a thermodynamic curve of adsorption of GO on wool fabrics. Figures 11 and 12 show the results obtained by fitting the thermal thermodynamic model of Langmuir model and Freundlich model, respectively. Table 4 shows the calculated data for the two models. It can be seen from Figure 10 that there is significant adsorption equilibrium of GO on wool fibers, and the temperature has a significant influence on the adsorption equilibrium law.
The fitting data of thermodynamic model.

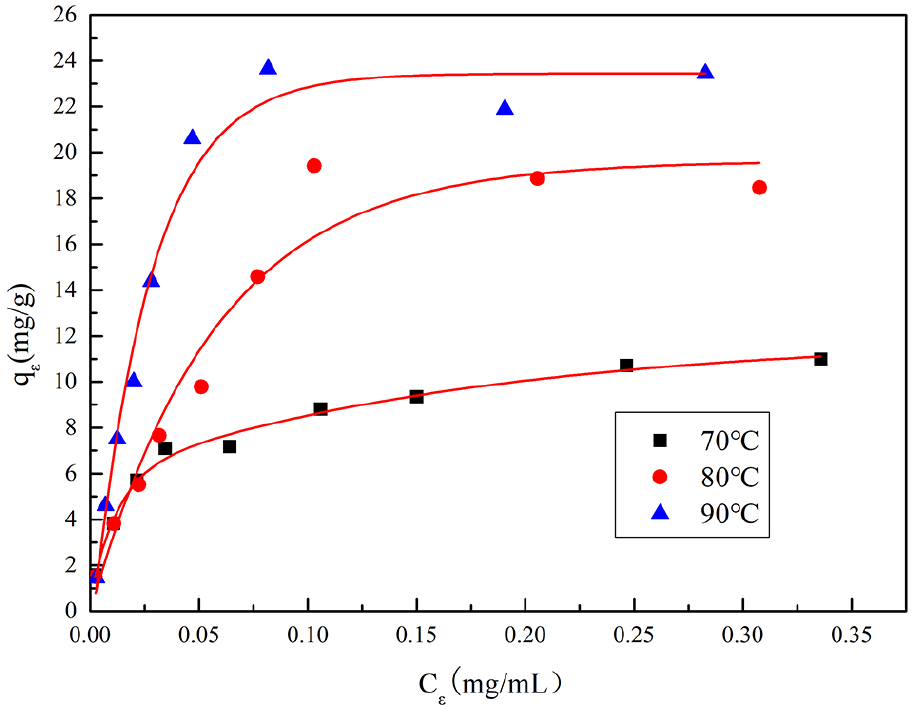
The adsorption isotherms curves.

The Langmuir model.
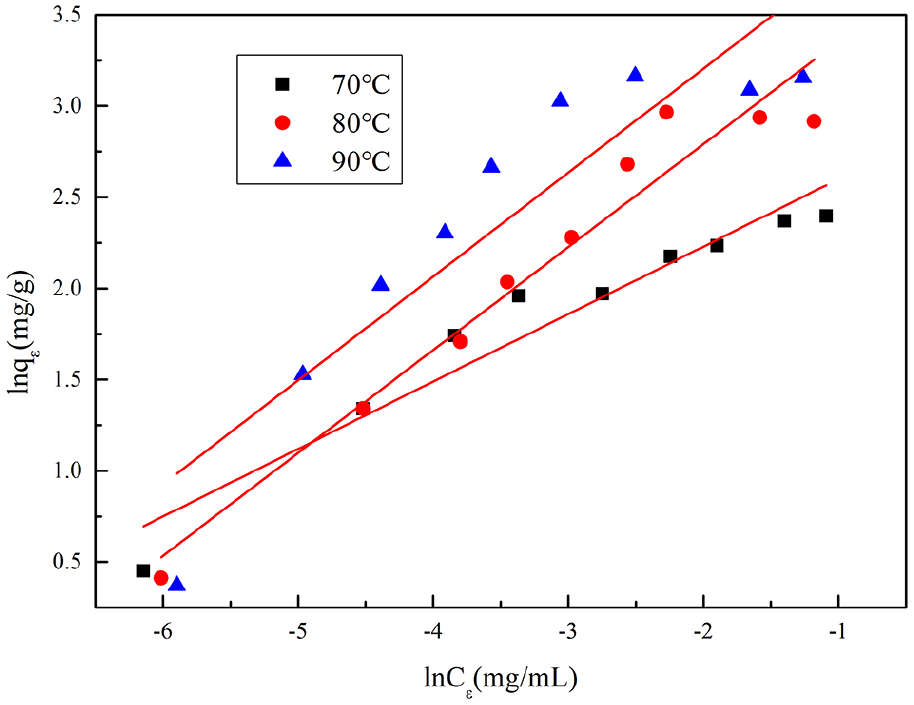
The Freundlich model.
It can be seen from Table 4, that the standard deviation R 2 obtained by fitting the Langmuir model at the same temperature is higher than that of the Freundlich model, indicating that the adsorption of GO on wool fibers is more in line with the Langmuir model (Figure 11). There is a more obvious phenomenon of localized adsorption. In addition, comparing the saturated adsorption QL value, it can be seen that the ability to adsorb and contain GO on wool is significantly improved with the increase of temperature, which further confirms the previous analysis results.18,19
Moreover, it can be seen from the calculation results in Table 5, that Gibbs free energy ΔG0 value is a negative, indicating that the adsorption of GO on wool fabrics is spontaneous. 27 The negative value of ΔH0 indicates that the adsorption of GO on wool is an exothermic reaction, which is consistent with the adsorption of dyes on fibers.20,27 ΔS0 is the change of the entropy value of GO after it is transferred from the liquid phase to the wool fiber. The data in the table is negative, which indicates that the GO is transferred from its liquid phase to the wool and its arrangement state is more regular, which is beneficial for achieving good electrical conductivity.
Gibbs free energy calculation at different temperatures.

Assemble dynamics
In order to further explore the assemble mechanism of GO on wool fabrics and establish a suitable coloration kinetics model, we studied the adsorption of GO on wool fabrics at different temperatures. The results are shown in Figure 13. It can be seen from the figure that as the temperature increases, the adsorption rate and saturated adsorption amount of GO on wool are significantly improved.
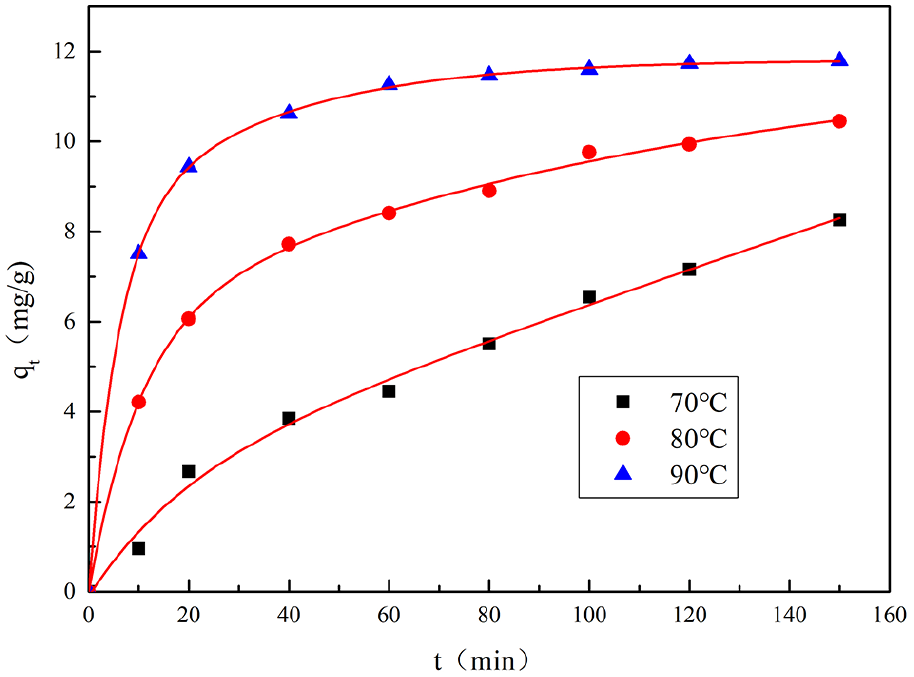
The adsorption kinetics curves.
Figures 14 and 15 are the fitting curves of first-order adsorption kinetics and the second-order adsorption kinetics of GO on wool, respectively, and the calculation results are shown in Table 6. It can be seen from the table that the second-order kinetic fitting regression coefficient R 2 is higher than the first-order kinetics at the same temperature, indicating that the adsorption of GO on wool is more in line with the quasi-second-order kinetic model, 28 which is based on the hypothesis that the adsorption rate is controlled by chemical reaction and the electron transfer is present in the adsorption process. 27 At pH 3, the wool is positively charged and the GO is negatively charged. 23 At this situation, the adsorption between GO and wool is mainly characterized by the locating adsorption of GO carboxyl group (−) and wool amino group (+). With the increase of temperature, the regression coefficient R 2 of quasi-secondary dynamics fitting is gradually increased, indicating that the adsorption of GO on wool fabrics is more in line with the positioning adsorption mechanism, which further proves that increasing the temperature reduces the obstructive effect of GO entering wool fiber.
The fitting data of dynamic model.


The pseudo-first order model.

The pseudo-second order model.
At the same time, it can be seen that with the increase of temperature, qε gradually increases, indicating that the equilibrium adsorption amount of GO on wool fiber is significantly improved. As described in 3.2.2, the increase in temperature increases the Brownian motion of the GO molecule and improves its diffusion capacity and broadens the diffusion channel of GO in the wool, and reduces the barrier function inside the wool, resulting in the improvement of the adsorption amount.
Antistatic properties of the colored fabric
The antistatic properties of the finished wool fabric are shown in Table 7. For unfinished wool fabrics, the half-life is infinite and cannot be measured. It can be seen from Table 7 that the half-life of the finished wool fabric decreases with the increase of the concentration of GO. When the concentration changes from 0.5% to 3%, the half-life of the wool fabric is abruptly changed and the antistatic property is obviously improved. It is about 15 times higher and has a half-life of 0.17 s, which is equivalent to the half-life of stainless steel fiber blend fabric, 29 and is higher than a fabric finished with graphene (1.9 s), 30 which can meet the optimal grade (A level ) (⩽2 s) required by GB/T 12703.1-2008. When the amount of GO exceeds 3%, the antistatic property does not change much, which is consistent with the equilibrium adsorption of GO on wool fiber.
Antistatic property of wool fabric colored with reduced graphene oxide.

The antistatic-washability properties of colored fabrics were also characterized and the results were shown in Table 8. As shown in the figure, the antistatic property of colored fabrics was decreased after being put in the preliminary stage of the washing process, mainly resulting from the falling of reduced graphene oxide on the surface of the fibers. However, after washing five times, the antistatic value of colored fabrics remained unchanged, indicating that the strategy of finishing is beneficial for the improvement of fixation stability of reduced graphene oxide on fabrics. In addition, it is worthy to notice that the value of half-life was less than 1 s, which still could reach the grade A antistatic requirement of different areas, for example, oil, gas, electronics industry, and so on.
Antistatic-washability property of wool fabric colored with reduced graphene oxide (GO 3% o.w.f).

Color fastness of reduced graphene oxide and Lanaset black B
The washing color fastness, rubbing fastness, light fastness and perspiration color fastness of reduced graphene oxide colored wool fabrics were tested and the results were shown in Table 9. As shown in table, the washing color fastness and rubbing fastness of reduced graphene oxide colored wool fabrics were similar with that of Lanaset black B, and importantly, the reduced graphene oxide colored wool fabrics exhibited better light fastness and perspiration color fastness compared with the controlled wool fabrics, resulting from the excellent UV absorption and hydrophobicity of reduced graphene oxide. We believe that the reduced graphene oxide colored wool fabrics have better applications for textile industry.
Color fastness of wool fabric finished with GO (3% o.w.f).

Conclusions
The GO-finished wool has stable electrical conductivity and can meet the needs of antistatic fabrics. However, the coloration conditions such as pH, temperature and concentration of GO play a significant role in determining the amount of reduced graphene oxide colored onto the fabrics. Acidic conditions were favorable for absorption of GO rather than neutral and alkaline conditions. The shade depth (K/S value) varied from 5.7 to 9.2 suitable for commercial applications. The GO was able to be attached to the surface of the fiber and the gap between the scales. In terms of coloration thermodynamics, the coloration process of GO on wool fiber is more consistent with Langmuir model and there is obvious adsorption equilibrium phenomenon, which is consistent with the adsorption of conventional acid dye on wool fiber. The results of kinetics shows that GO are adsorbed on wool fabrics which are more in line with the quasi-secondary kinetic model. GO finished wool fabric has strong antistatic-washing properties. Using GO to color wool fabrics provides an economically and environmentally alternative to wool fibers.
Footnotes
Declaration of conflicting interests
The author(s) declared no potential conflicts of interest with respect to the research, authorship, and/or publication of this article.
Funding
The author(s) disclosed receipt of the following financial support for the research, authorship, and/or publication of this article: We gratefully acknowledge the financial support from Natural Science Foundation of Zhejiang Province (LY21E030018), Jiaxing Public Welfare Fund (2022AY10007 and 2022AD10031), the Open Project Program of Key Laboratory of Yarn Materials Forming and Composite Processing Technology of Zhejiang Province (No. MTC-2022-04), and the National Training Programs of Innovation and Entrepreneurship for Undergraduates (02010354006, 202113291004 and 202113291018) and General Scientific Research Projects of Zhejiang Education Department (Y201738106).