
Abstract
Reduced graphene oxide/cerium dioxide (is synthesized by a simple sonochemical route. The morphology and chemical structure of the nanocomposites are characterized by scanning electron microscopy, energy disperse spectroscopy, insitu infrared spectroscopy, and X-ray diffraction. The electrochemical properties of a fabricat reduced graphene oxide/cerium dioxide2 nanocomposite electrode examined by cyclic voltammetry, galvanostatic charge/discharge, and electrochemical impedance spectroscopy. The results indicate that the reduced graphene oxide can prevent the aggregation of cerium dioxide nanoparticles; meanwhile, the reduced graphene oxide/cerium dioxide-3 nanocomposite electrode exhibits excellent electrochemical performance with a high specific capacitance of 185 F·g−1 at 0.5 A·g−1, a high rate capability, and good reversibility, which results from the synergism and coupling between reduced graphene oxide nanosheets and cerium dioxide nanoparticles.

Introduction
Supercapacitors have developed into very promising electric energy storage devices,1,2 with two main energy storage mechanisms being demonstrated: electric double-layer capacitance, and pseudo capacitance.3–5 The former mainly uses carbon-based materials as electrode materials, while the latter uses noble metals (Ag, Au), transition metal oxides (RuO2, MnO2, NiO, Co3O4, etc.) or conductive polymers (polyaniline, polypyrrole, polythiophene derivatives) as electrode materials. 6 Cerium oxide has been widely explored as an electroactive material for supercapacitors due to its excellent redox characteristics, environmental friendliness, low price, and abundance.7–10 However, it cannot be used as an electrode material alone because of its poor electrical conductivity, low cycle stability, and small specific surface area.11–16 Among carbon-based materials, graphene is considered to be a promising material because of its good chemical and thermal stability, excellent conductivity, and high specific surface area. Therefore, dispersing CeO2 nanoparticles on graphene might be an important solution for promoting the electrochemical performance of CeO2.17–25 However, the capacitive performance of graphene-supported CeO2 nanocomposites is not reported so far.
This paper describes the reduced graphene oxide/cerium dioxide (RGO/CeO2) nanocomposites prepared by a simple sonochemical method, which exhibit a greatly enhanced capacitive behavior when compared with their individual counterparts by cyclic voltammetry (CV), galvanostatic charge/discharge (GCD) and electrochemical impedance spectroscopy (EIS) measurements in 6 M KOH as the electrolyte.
Results and discussion
Materials and characterization
The graphene oxide (GO) was prepared by modified Hummers method, and the RGO/CeO2 nanocomposites prepared by a simple sonochemical method. The images of the RGO, CeO2, RGO/CeO2 nanocomposites are shown in Figure 1. It can be clearly seen that the RGO nanosheets form with a wrinkled and folded smooth large-sized surface Figure 1(a). A plenty of CeO2 nanoparticles can be observed in Figure 1(b). The CeO2 nanoparticles are distributed uniformly with an average size of 10–20 nm. The morphology and structure of the RGO/CeO2 nanocomposite are shown in Figure 1(c). It can be clearly observed that the surface of the RGO nanosheets is homogeneously decorated with ultrafine CeO2 nanoparticles. In addition, the prepared RGO/CeO2 composites are analyzed from their energy spectra in Figure 2. As shown, cerium, oxygen, and carbon exist in the composite nanomaterials, which confirms that the RGO/CeO2 composites have been successfully prepared.

SEM images of (a) RGO, (b) CeO2 and (c) RGO/CeO2 nanocomposites.

EDS analyses of (a) RGO, (b) CeO2 and (c) RGO/CeO2 nanocomposites.
The Fourier transform infrared (FTIR) patterns of GO, RGO, CeO2 and RGO/CeO2 are shown in Figure 3. It can be seen from the figure that the absorption vibration peaks of GO at 1738 cm−1 and 1050 cm−1 are the contraction vibration peaks of C-O and C-OH in the -COOH functional groups. The bands at 3400 cm−1 and 1397 cm−1 are attributed to the –OH stretching and deformation vibrations, respectively. The characteristic peak of graphene (C=C) appears at 1578 cm−1 for GO and RGO. The FT-IR spectra of RGO and the RGO/CeO2 composite disappears at 1738 cm−1, indicating that the oxygen-containing functional groups are removed during the reduction of hydrazine hydrate. The band at 508 cm−1 in the infrared spectrum of CeO2 is the Ce-O vibration peak of the CeO2 crystal. In the FT-IR spectra of the RGO/CeO2 nanocomposite, the characteristic bands representing graphene and CeO2 appear at 1578 cm−1 and 508 cm−1 at the same time.
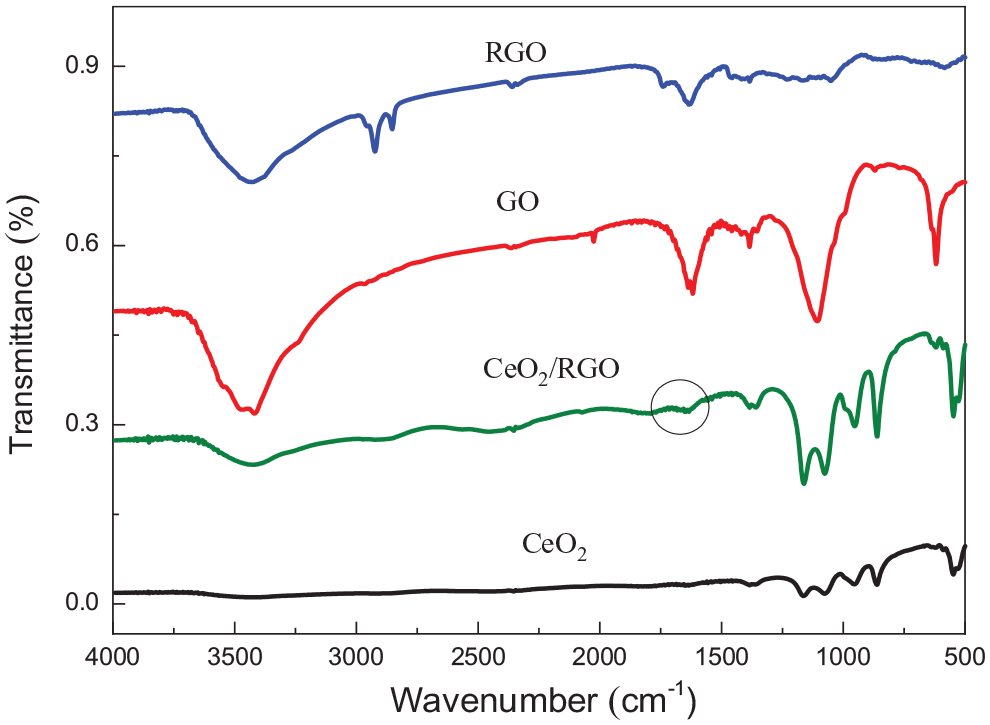
FTIR patterns of RGO, GO, CeO2 and the RGO/CeO2 nanocomposite.
The X-ray diffraction (XRD) patterns of GO, RGO, CeO2 and the RGO/CeO2 composite are shown in Figure 4. The XRD pattern of graphene oxide exhibits a strong and sharp peak at 2θ of about 10.8°, which can be assigned to the (001) crystal plane of graphene oxide. The interlayer spacing of graphene oxide increases more remarkably than the graphite raw material (diffraction peak 26.7°).26,27 It is considered that a large number of oxygen-containing functional groups such as hydroxy (-OH), carboxy (-COOH) and carbonyl (C=O) occur on the graphite lamella during the oxidation process. The diffraction peak at 10.8 ° disappears for RGO reduced by hydrazine hydrate, and two new diffraction peaks appear at 25 ° and 43 °, corresponding to the (002) and (100) characteristic diffraction peaks of the graphite like structure. In the XRD pattern of CeO2 nanoparticles, the diffraction peaks with angles of 28.3°, 32.9°, 47.3°, 56.2° and 69.8° correspond to the (111), (200), (220), (311) and (400) crystal planes of cubic CeO2, respectively. This corresponds to the CeO2 standard pdf card (JCPDS 34-0394). The XRD pattern of the RGO/CeO2 nanocomposite can be well indexed to the cubic fluorite structure of CeO2 (JCPDS 34-0394), and the prominent diffraction peaks at 28.3°, 32.9°, 47.3°and 56.2° originate from the (111), (200), (220) and (311) crystal planes, respectively. The disappearance of the typical diffraction peak of graphene oxide indicates that graphene oxide in RGO/CeO2 nanocomposites has been efficiently flaked and/or reduced.
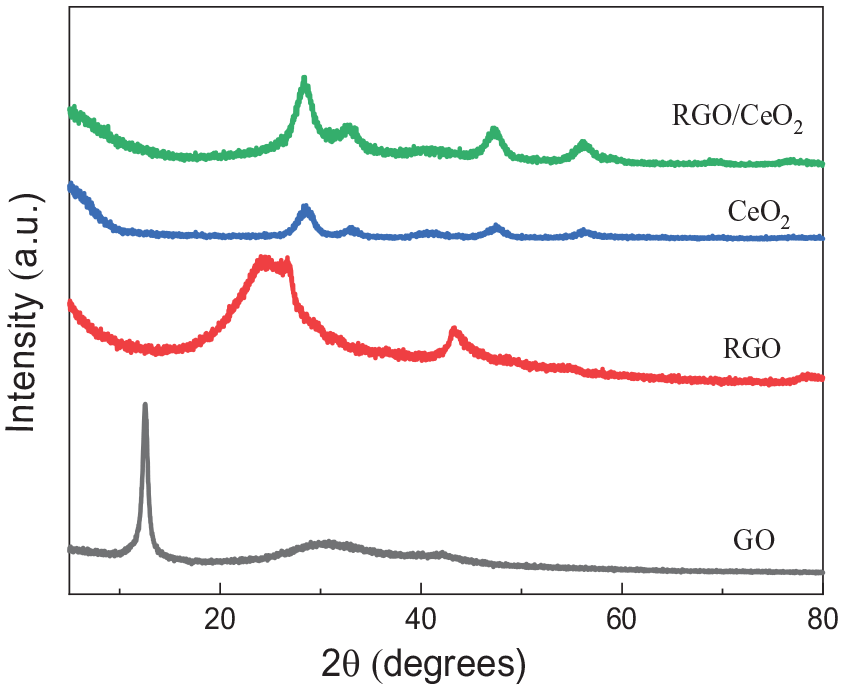
X-ray diffraction patterns of RGO, CeO2, and RGO/CeO2 nanocomposites.
Electrochemical properties
Figure 5(a)–(c) show the CV curves of CeO2, RGO, and RGO/CeO2 electrodes in 6 M KOH aqueous solution at different scan rates of 5, 10, 20, 50, 100 and 200 mV/s, respectively. Figure 5(d) shows the CVs of pure CeO2, RGO, and RGO/CeO2 composite electrodes at a scan rate of 5 mV s−1 in 6 M KOH as the electrolyte. In Figure 5(a), all the CV curves display clear redox features with well-defined peaks, implying a pseudo-capacitive behavior. These redox peaks derive from conversion between the Ce3+ and Ce4+ states. It is clearly observed that the CV curves are rectangular-shaped in Figure 5(b), which is a typical electric double-layer capacitance behavior. The CV curves of the composite nanomaterial in Figure 5(c) have both pseudo-capacitance and electric double-layer capacitance. In Figure 5(d), the CV curves of pure CeO2, and RGO electrodes measured under the same conditions show that the current is smaller than that of the RGO/CeO2 electrode. In the RGO/CeO2 nanocomposite, a synergistic effect is observed on combining CeO2 and RGO, reasonably resulting from the uniform dispersion of CeO2 nanocrystals onto the surface of the RGO sheets and the better electronic conductivity of the RGO.

(a) CVs of the CeO2 electrode at different scan rates of 5, 10, 20, 50, 100 and 200 mV s−1; (b) CVs of the RGO electrode at scan rates of 5, 10, 20, 50, 100 and 200 mV s−1; (c) CVs of the RGO/CeO2 electrode at scan rates of 5, 10, 20, 50, 100 and 200 mV s−1s; and (d) CVs of pure CeO2, RGO, and the RGO/CeO2 composite electrode at a scan rate of 5 mV s−1 in 6 M KOH as the electrolyte.
Figure 6(a)–(c) show the chronopotentiogram curves of CeO2, RGO, and the RGO/CeO2 nanocomposite electrodes at different current densities of 0.5, 1, 2, 5 and 10A g−1, respectively. Figure 6(d) GCD shows the chronopotentiogram curves of CeO2, RGO, and the RGO/CeO2 composite electrodes at a constant current density of 0.5 A g−1 in 6 M KOH electrolyte. It is clearly observed that all the chronopotentiograms of the RGO/CeO2 nanocomposite exhibit an equilateral triangle shape, indicating a good reversibility and ideal capacitive behavior during the charge/discharge processes.
(a) GCD curves of the CeO2 electrode at different constant current densities of 0.5, 1, 2, 5, and 10 A g−1; (b) GCD curves of the RGO electrode at constant current densities of 0.5, 1, 2, 5, and 10 A g−1; (c) GCD curves of the RGO/ CeO2 electrode at constant current densities of 0.5, 1, 2, 5, and 10 A g−1; and (d) GCD curves of the CeO2, RGO, and RGO/CeO2 composite electrodes at a constant current density of 0.5 A g−1 in 6 M KOH as the electrolyte.
The RGO/CeO2 nanocomposites with different CeO2 loading amounts were prepared by simply varying the feeding amount of Ce (NO3)·6H2O with other experimental conditions unchanged. RGO/CeO2-1, RGO/CeO2-2 and RGO/CeO2-3 three composite materials has prepared, and it corresponding the mass ratios of cerium dioxide to graphene oxide were 1:1, 2:1, and 3:1, respectively. Figure 7 shows the CV curves of the RGO/CeO2 composites with different mass ratios at different scanning speeds. It can be clearly seen that the RGO/CeO2 electrodes show greatly enhanced specific capacitance compared with the RGO and CeO2 electrodes, which probably originates from the following factors. First, the RGO support with a large surface area allows more dispersed CeO2 nanoparticles, which makes the CeO2 nanoparticles effectively accessible by electrolyte ions and achieves better material utilization for capacitance generation. Second, the overall high electrical conductivity of the RGO nanosheets can be maintained in the RGO/CeO2 nanocomposites, which can improve the charge transfer and charge transport necessary for relevant redox reactions. Thus, the structural features of the RGO/CeO2 nanocomposites can promote both the electrochemical utilization of CeO2 nanoparticles and the electrical conductivity of the composite electrode. Moreover, a suitable loading amount of CeO2 on RGO nanosheets is also crucial to optimizing the performance. The CV curves of the composite materials (RGO/CeO2-3) in which the ratio of cerium dioxide to graphene oxide is 3:1, have more obvious humps, and show the highest peak current and the largest integral area, which indicates that among the three composites, the composite with a ratio of cerium dioxide to graphene oxide is 3:1 displays the best electrochemical performance.

CV Curves of RGO/CeO2 composites with different mass ratios at different scanning speeds (a) CV curves of the RGO/CeO2-1 electrode at scan rates of 5, 10, 20, 50, 100 and 200 mV s−1; (b) CV curves of the RGO/CeO2-2 electrode at scan rates of 5, 10, 20, 50, 100 and 200 mV s−1; (c) CV curves of the RGO/CeO2-3electrode at scan rates of 5, 10, 20, 50,100 and 200 mV s−1; and (d) CVs of the RGO/CeO2-1, RGO/CeO2-2, RGO/CeO2-3 electrodes at a scan rate of 200 mV s−1 in 6 M KOH as the electrolyte.
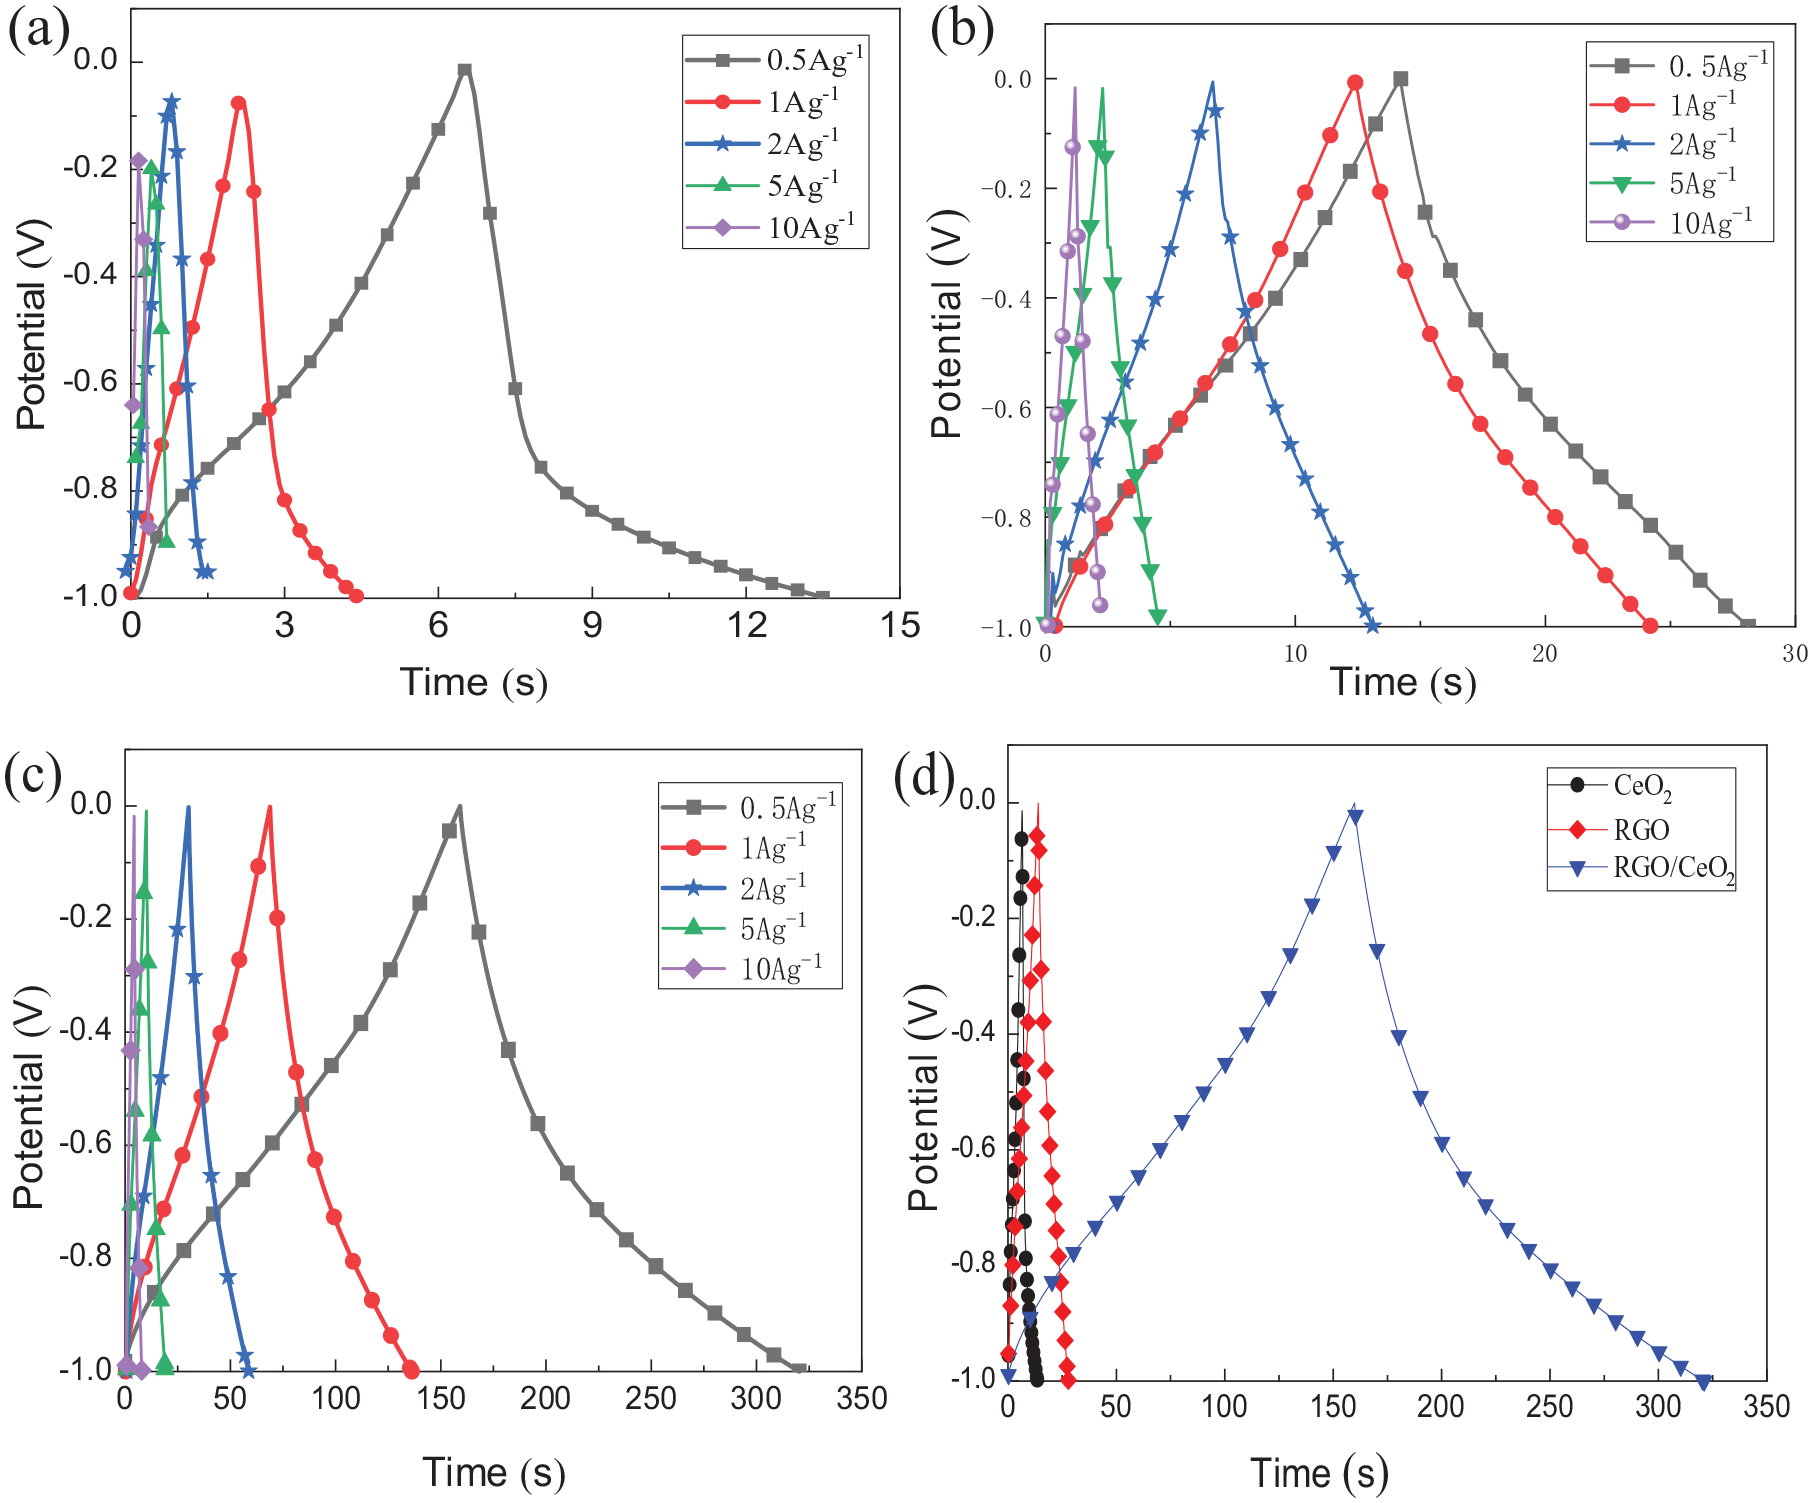
Figure 8 shows the define curves of the RGO/CeO2 composites with different mass ratios at different constant current densities. The charge–discharge time decreases on increasing the current density. The charge–discharge curves under different current densities maintain almost the same shape, showing good symmetry, and indicating the sustainability of the RGO/CeO2 electrodes over a wide current range. It can be seen that the electrode charge–discharge time increases with an increase of the cerium dioxide ratio in the material. The RGO/CeO2 nanocomposite shows a higher specific capacitance than CeO2 and RGO, as shown in Figure 9. In this study, the RGO/CeO2-3 electrode exhibits a maximum specific capacitance of 185 F·g−1 at 0.5 A·g−1. The good capacitive behavior of the electrode materials can be attributed to the following features: (1) the RGO has good electrical conductivity and reduced internal resistance of CeO2 nanoparticles and the uniform distribution of CeO2 nanoparticles on the surface of RGO facilitates the charge transport from CeO2, leading to rapid redox reactions.

GCD curves of the CeO2/RGO composites with different mass ratios at different constant current densities. (a) GCD curves of the RGO/CeO2-1 electrode at constant current densities of 0.5, 1, 2, 5, and 10 A g−1; (b) GCD curves of the RGO/CeO2-2 electrode at constant current densities of 0.5, 1, 2, 5, and 10 A g−1; (c) GCD curves of the RGO/CeO2-3 electrode at different constant current densities of 0.5, 1, 2, 5, and 10 A g−1; and (d) GCD curves of the RGO/CeO2-1, RGO/CeO2-2 and RGO/CeO2-3 composite electrodes at a constant current densities of 0.5 A g−1 in 6 M KOH as the electrolyte.

Specific capacitances of RGO, CeO2, and the RGO/CeO2-1, RGO/CeO2-2 and RGO/CeO2-3 nanocomposites at different current densities.
Figure 10 shows the impedance spectra of RGO, CeO2 and RGO/CeO2 in the frequency range of 10–2 to 105 Hz in 6 mol/L KOH as the electrolyte. The semicircle diameter of the high-frequency region in the figure represents the charge transfer resistance between the electrode and the electrolyte. Through comparison, it can be observed that the charge transfer resistance of RGO/CeO2 is the smallest, which indicates that electrons can enter the interior of the material quickly and easily. The oblique line in the low-frequency region reflects the Warburg impedance caused by the diffusion of ions in the solid active material. It is characterized by the impedance value decreasing with the increase of the slope. In other words, the larger the slope gradient is, the more conducive it is to the diffusion and migration of ions in the active material; the smaller the slope gradient is, the greater the resistance to ion migration is. As can be seen from the figure, the slope of the RGO/CeO2 composite material is the largest in the low frequency curve, indicating that the ion diffusion rate is faster when the redox reaction occurs in the electrolyte, and it has higher capacitance performance. In contrast, RGO/CeO2 composites show the best capacitive performance, which is consistent with the CV and GCD test results.

Impedance spectra of the RGO/CeO2 nanocomposites.
Conclusions
In summary, RGO/CeO2 nanocomposites have been successfully prepared by a self-assembly approach. The RGO nanosheets not only effectively inhibit the aggregation of bare CeO2 nanocrystals after they are incorporated into the composite materials, but also significantly improve the capacitance performance of CeO2. The RGO/CeO2-3 nanocomposite electrode delivers a specific capacitance of 185 F·g−1 at 0.5 A·g−1 and shows excellent cycling stability. The enhanced electrochemical activity is ascribed to the synergistic effects between RGO and CeO2. These results highlight the exciting potentials of the RGO/CeO2 nanocomposites as high performance supercapacitors.
Experimental
Synthesis of GO
The graphene oxide (GO) was prepared by a modified Hummers method. The process for the preparation of graphene oxide is mainly divided into three stages: (1) The low temperature stage during which of 21 mL of H2SO4 and 2.3 mL of H3PO4 were added to a with the stirring and the mixture was kept below 0 °C using an ice bath and (2) The intermediate temperature stage in which 1g of graphite powder was slowly added with vigorous stirring. Next, 3 g of KMnO4 were added to the mixture slowly under stirring and the system temperature was kept at 20 °C for 2 h, and then it was moved to a 35 °C water bath for 30 min. (3) The high temperature stage in which 46 mL of deionized water was added to the suspension while maintaining the temperature below 98 °C. Subsequently, 10 mL of H2O2 (30%) was added into the suspension during which the dark brown solution turned to bright yellow. The resulting solid product was isolated by centrifugation and washed thoroughly with water. The GO of powder was obtained by ultrasonic exfoliation and drying in a vacuum oven at 80 °C for 24 h.
Synthesis of the RGO/CeO2 nanocomposites
A total of 0.152 g of Ce(NO3)·6H2O was dispersed in 30 mL of deionized water and 30 mL of NH3·H2O was added to the dispersion during ultrasound irradiation. Next, 30 mL of GO (1 mg/mL) was mixed with the above solution followed by continuous stirring and ultrasound for 30 min. After that, the mixture suspension was heated to 90 °C, and 3 mL of N2H4 was added. After stirring for 1 h, the resulting solid product was isolated by centrifugation, and washed thoroughly with water and ethanol, dried in a vacuum oven at 60 °C for 24 h, and then allowed to cool to room temperature. For comparison, pure CeO2 was also synthesized under the same conditions as the RGO/CeO2 nanocomposites. RGO/CeO2 nanocomposites with different CeO2 loading amounts were prepared by simply varying the feeding amount of Ce (NO3)·6H2O with the other experimental conditions remaining unchanged. The products were designated as RGO/CeO2-1, RGO/CeO2-2 and RGO/CeO2-3 for feeding amounts of 0.076 g, 0.152 g, and 0.228 g of Ce(NO3)·6H2O, respectively. RGO/CeO2-1, RGO/CeO2-2, and RGO/CeO2-3 denote that the mass ratios of cerium dioxide to graphene oxide were 1:1, 2:1, and 3:1, respectively.
Characterization
FTIR spectra (IR-Prestige-21, Shimadzu, Kyoto, Japan) were collected in the range of 4000–500 cm−1. The morphologies and compositions of the mate were determined by SEM (SIGMA300, CarlZeiss, German) equipped with a defin (Hitachi S-4300, Tokyo, Japan). XRD patterns were recorded using a Shimadzu diffractometer (Model 6000, Shimadzu, Kyoto, Japan) with Cu Kα radiation (40 kV and 30 mA) at a scanning rate of 2°/min from 5 °C to 90 °C.
Electrochemical test
The electrochemical tests were carried on an AUTOLAB PGSTAT302N with a three-electrode cell in a 6 M KOH aqueous solution. Using Hg/HgO and a Pt electrode as the reference electrode and counter electrode, respectively, the working electrode was fabricated as follows. The as-obtained electroactive materials, acetylene black, and polytetrafluoroethylene were mixed in a mass ratio of 8:1:1. The detained slurry was coated on a nickel foam substrate (0.9*0.9 cm2) and then dried at 60 °C for 24 h. Subsequently, the prepared electrode was pressed at 10 MPa for 10 s. The electrochemical performance was characterized by means of CV measurements. The CV measurements were performed in the potential range of −1 to 0 V at scan rates of 5, 10, 20, 50, 100, and 200 mV s−1. The GCD measurements were performed at constant current densities of 0.5, 1, 2, 5, and 10 A g−1.
Footnotes
Declaration of conflicting interests
The author(s) declared no potential conflicts of interest with respect to the research, authorship, and/or publication of this article.
Funding
The author(s) disclosed receipt of the following financial support for the research, authorship, and/or publication of this article: The authors acknowledge the financial support from the National Natural Science Foundation of China (No.52062047; No.21763029), the Shaanxi Province Education Department Key Scientific Research Project (21JS046; 21JS043), and the Industry University Research Cooperation Project of Yulin (Grants CXY-2020-006-06).