
Abstract
Currently, industrial winding processes are often optimized by trial and error. A digital twin of winding processes could be helpful in order to assist industry to optimize the winding processes. Formulating the kinematic equations that form the basis of such a simulation of the winding process is straightforward in principle. However, a major challenge is to model the increase of the package diameter as a function of time or length of wound up yarn, respectively. In this paper, a kinematic model for the winding process is first outlined. The focus of the paper is the description of a workflow in order to find a model for the package diameter increase dependent on the wound yarn length. For that purpose, a new image analysis method is presented to derive the general class of the model function for the diameter increase. Then, the measurement results of a series of experiments are analyzed to find a parameterization of the model function. Here, the input process parameters winding tension, cradle pressure, winding speed, and traverse ratio are varied at two levels. Finally, the linear regression model for the package diameter increase is presented.
Introduction
The winding process and the resulting quality of the package is of central importance for package dyeing. Of the total dyeing process, winding accounts for 5%−10% of the costs. However, the quality of the dye package has an effect of about 30% of the dyeing costs. 1 The quality of the package can influence the capacity of the dyeing machine, the consumption of dye and additives, the required contact time with the dye and the amount of re-dye. 1 Furthermore due to dyeing defects, the textile and clothing industry incurs considerable expenses. In 2019, approx. 290,000 t of fibers were processed in the clothing and home textiles sector in Germany. 2 It can be estimated that approx. 30% of these fibers are dyed on packages in Germany resulting in approx. 87,000 t of package dyed yarn per year. The reject rate of badly dyed packages according to industrial specifications is up to 2%, which is about 1740 t of yarn per year in Germany. The dyer suffers a loss of turnover due to complaints and rejects amounting between 1.5€ per kg of yarn and 6.5€ per kg of yarn depending on yarn and package quality. 1 The dyeing process represents a complex challenge due to the multitude of influencing factors. Besides material interaction between yarn, bobbin, and dye, the structure of the winding body is also of essential importance for the quality of the dyeing.3,4
In industry, the winding structure is often not analyzed in detail in order to guarantee a homogeneous dyeing. Instead it is assumed that the yarn package should have a uniform density. In order to guarantee a homogeneous density, mass-volume measurements are used. 5 With this method, the mass and volume of the finished package is determined and the package density is calculated. To test the variations in winding density in the bobbin, a certain amount of yarn is unwound and then the remaining volume and weight of the bobbin is measured. This process can then be repeated several times. In addition, there are systems for inspecting the final bobbin density by electrically testing the weight of the bobbin and measuring the outer diameter with the help of a camera. Insufficient coils can be sorted out in this way. 6 Furthermore, the iterative approximation to satisfactory winding process parameters by means of test dyeings is widely used. Hereby, the operator’s experience in designing the machine settings is decisive for the required set-up time.
However, this method is very time-consuming due to the iterative approach. Simulating the winding process could be helpful in order to optimize the homogeneity of the package.7,8 Mathematical models for the winding process are well-known 9 and a simulation tool for winding has already been established. 10 If we formulate the kinematic equations of winding we see that another model is needed, namely a model of the diameter increase of the winding package as a function of the yarn length. Therefore, the focus of this paper is on the analysis of the package diameter in winding processes. We present the experimental setup and the image analysis method that is used to map the yarn length to the diameter increase for step precision winding processes with cotton. Four types of fitting functions for modeling the diameter increase are compared. Finally, the measurement results of a series of experiments with a two level experimental design of four varying process parameters are used in order to parametrize the fitting function of the diameter increase dependent on yarn length.
Mathematical model of winding
In this paper we restrict ourselves to step precision winding with cylindrical bobbins. The bobbins forming the core of the yarn package are made from plastic or card. In Lawrence, 11 a kinematic model of the winding process is described. Hereby, the authors assume that the package diameter is fixed. Hence, the kinematic equations of the winding only holds for one single layer. We generalize the kinematic description and formulate a winding model.
If we are interested in a geometric model of the position of the yarn in the package, then we describe the wound yarn as a parametrized curve

Labels of the wound yarn: the position
The general expression for the position

with the cylindrical unit vectors
the increase
the winding speed
the traverse speed
Models for the winding and traverse speed of the yarn carrier are, for example, described in Lawrence. 11 In particular, the problem of hard edges is discussed there. Hard edges arise in random winding when the yarn traverse speed decreases to zero while the yarn carrier reaches the reversal point and accelerates back to normal speed after reversion. Due to the reduced speed more yarn is placed in the region around the reversal points.
Modeling the increase of the package diameter is a challenging problem, since it depends on winding tension, cradle pressure, winding speed, and traverse ratio. Hereto, Durur 12 used Linear Variable Differential Transformer (LVDT) measurements, while Kyosev et al. 13 measured the package diameter dependent on time with help of laser sensors. In the following, we present an analysis of the package diameter increase by image analysis.
Modeling the package diameter increase
In this section, we describe the experimental setup for estimating and modeling the package diameter increase as a function of yarn length. The increase of the package diameter is indirectly measured by analyzing video recordings of a winding process with image analysis. For this purpose, we present the image analysis workflow that is used to evaluate the package diameter. Then, we fit a model to the estimated data in order to describe quantitatively the package diameter increase.
Experimental setup
The growth of the package diameter can be measured by video recordings during the entire winding process. For this task, winding tests are carried out on an Autoconer 5 manufactured by Schlafhorst, a branch of Saurer Germany GmbH & Co. KG. It should be noted that this machine is a precision winder using a reciprocating yarn guide. However, it is also possible for this machine to carry out a random winding. Step precision winding is used in the experiment. It combines the advantages of random winding and precision winding. In the general principle of step precision winding, the traverse ratio is reduced in steps as the bobbin diameter increases. Thus the bobbin consists of several concentric layers, each with a different traverse ratio. Within the layers, the coil angle varies in a narrow range. The winding material used is cotton. The ring yarn utilized has a yarn count of Nm 34. The cylindrical bobbin onto which the yarn is wound has a diameter of 62 mm. The machine parameters that are varied and used later on to train the model are winding tension, cradle pressure, winding speed, and average traverse ratio. All pictures and measurements presented in this section show the so-called reference sample with winding tension 10 cN, cradle pressure 7 N, winding speed 865 m min−1, and traverse ratio is 2.
A Lumix DC-FZ82 camera from Panasonic Corporation, Kadoma, Japan, is used for the video recordings at 25 frames per second. It is placed on a tripod in front of the cross winder at a defined distance. In addition, markers are placed on the wall behind the cross winder to act as a reference point when evaluating the video recordings. Furthermore, the readout device of the cross winder is placed visible for the camera in order to be able to read off the current wound yarn length. The test setup is shown in Figure 2.

Experimental setup: cross winder with camcorder mounted on a tripod (left) and zoomed-in view (right).
In addition to the video recording, five manual measurements of the diameter are carried out. At four specified yarn lengths, the winding process is stopped and the diameter is measured by hand. The total yarn length needed to reach the prescribed final diameter is also recorded.
Image analysis for package diameter computation
The videos, which are recorded as described in the last paragraph, are used in order to compute the diameter of the yarn packages by image analysis. In a preprocessing step, the videos are converted to consecutive images called frames. For each frame an image processing algorithm is applied based on the idea that the edges of the yarn package are parallel and, hence, we need to find two parallel line segments in each of the frames. Then, one can compute the distance between the two lines in the image and calibrate these derived distances to the diameter of the real yarn package. Applying this algorithm for each frame yields the increase of the package diameter over time.
Because there are many parallel lines in the images, first we localize the bobbin (without yarn) in the image at the start of the process. Figure 3(a) is an image of the bobbin without yarn. This information is used to make a mask for the region of interest. For the bobbin localization the color information of the bobbin is used. We transform the color image from RGB to the Lab 14 color space. By using a simple segmentation algorithm, for example, Otsu’s thresholding method, 15 on the b-channel of Lab color space, we are able to segment the bobbin from the rest of image. Figure 3(c) shows negated Otsu’s thresholding method applied on Figure 3(b). After a successful segmentation of the bobbin, we then apply morphological dilation and erosion operation 16 to robustly detect the bobbin. Finally, an extended bounding box of the segmented bobbin gives the mask (see Figure 3(d)). Note, that this step is an initial step and should be done only for one image at the start.

(a) Bobbin without yarn, (b) b-channel of Lab color space, (c) negate of Otsu algorithm applied on b-chanel of Lab color space, and (d) visualization of extended bounding box of last image.
In the next step, all edges in the image are detected by a Canny edge detection algorithm (See Figure 5(b)). 17 Compared with common edge detection algorithms, in most cases the Canny algorithm has good performance. 18 By applying the mask generated from the initial step on the edge image, most of the unwanted edges are excluded.
The result of the last step is used to find the edge of the yarn package in the image. We apply the Hough transform for finding the line segment that bound the yarn package (See Figure 5(c)). The Hough transform was first introduced by Hough 19 for detecting complex patterns of points in binary image data. Later on, Duda and Hart 20 suggested to transform each point of a line into an equivalent parameter space. It should be noted that, the Hough transform is very similar to the Radon transform, and indeed, the Hough transform can be loosely defined as a discretized form of the Radon transform. 21
From now on, we denote this parameter space as Hough space. In other words, each point

Because the edges of the yarn package are almost horizontal, we find two local maxima near to

Geometric representation of relation between image space and Hough space.

(a) Input image, (b) negated canny edges, (c) negated Hough transform of image (b), and (d) visualization of two local maxima of Hough image with red lines. Note that, in our study no camera calibration is done. Therefore, for more precises measurement, one should consider an initial camera calibration step to estimates the parameters of a lens and image sensor of camera.
The algorithm for computing the diameter of the yarn package is developed using the software tool ToolIP. 22 This software package is designed for interactively programming image processing and analysis algorithms. Figure 6 shows the workflow of the algorithm for finding the diameter of the yarn package in ToolIP.

Graph representing the image processing workflow for finding the top and the bottom edge of the bobbin for each step. From left to right: after loading the image, the canny edge detector and bobbin detection are applied in parallel on the input image. By multiplying these two images, the yarn package is masked and this masked image is used for finding the top and bottom lines of the bobbin. Finally, the distance of the two lines is computed and also visualized.
Postprocessing of the image analysis data
With the image analysis method explained above, we compute for each frame the distance between the two parallel lines. Figure 7 exemplarily shows the raw data of the image analysis.
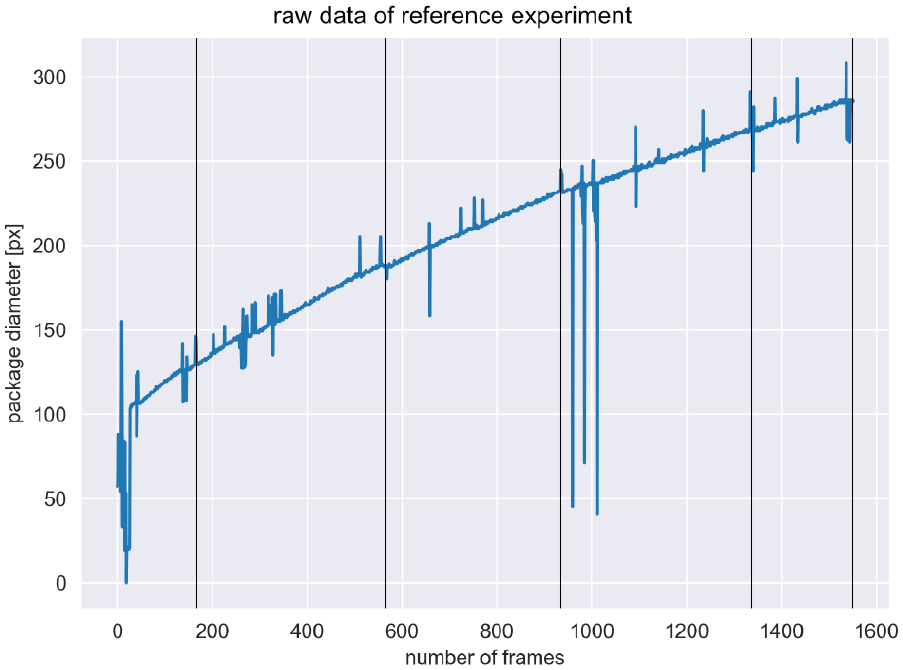
Raw data after image analysis: the distance between the two parallel lines in pixel is plotted for each consecutive frame. The vertical lines indicate the stopping of the winding process in order to perform the manual measurements of the package diameter.
Several outliers can be observed in Figure 7. Following the standards of cleaning data in machine learning projects for preprocessing the data, 23 we find that in most cases the winding process was stopped in order to fix yarn breakage or to perform a manual measurement of the package diameter. In a minor number of cases inspecting the outlier frames shows that the detection of the parallel lines has failed. Hence, the workflow of cleaning the data is split into two steps. First, the outliers that arise from the stopping of the winding process are removed from the data. This is important because later on the frame number is linked to time or yarn length, respectively. A stopped process would confound this mapping. In a second step, the slope of the lines is analyzed in each frame. If the slopes of both lines differ by more than 4° we classify the frame as faulty. For the reference sample, 0.6% of the frames with faulty detection of parallel lines are found. Next, sudden jumps of diameter values that lie outside a range of 10 pixels relative to their surrounding environment are classified as faulty as well. For the reference sample, the number of outliers due to this criterion is nearly 3.0%. Finally, the faulty classified frames are dropped. The cleaned and post-processed data for the exemplary reference sample is shown in Figure 8. Furthermore, the measured values of the package diameter are added to the plot. For this purpose, the pixels are mapped to real distances by comparing the virtual distances of the bobbin in the first image frame to the real dimensions of the bobbin. With increasing diameter of the package the recorded images slightly underestimate the measured diameter. Hence, we do not use them for absolute measurements of the diameter, but only for determining the model of the diameter increase function dependent of the yarn length.

Postprocessed data for the reference sample: the measured package diameter (mm) is compared to the virtual package diameter (px) after calibrating the pixel dimensions to the real dimensions by mapping the virtual and the real bobbin geometry.
Fitting the diameter as function of yarn length
The postprocessed image analysis data of the diameter is the starting point for fitting a model of the diameter

These model function depend on the unknown parameters
We fit the four model functions for the reference sample using a non-linear least-squares method. In Figure 9 a comparison of the four model functions for the reference sample is shown. Table 1 lists for each of the four model functions the resulting fitting parameters and their mean square errors MSE that is defined as follows:

Hereby, we denote with
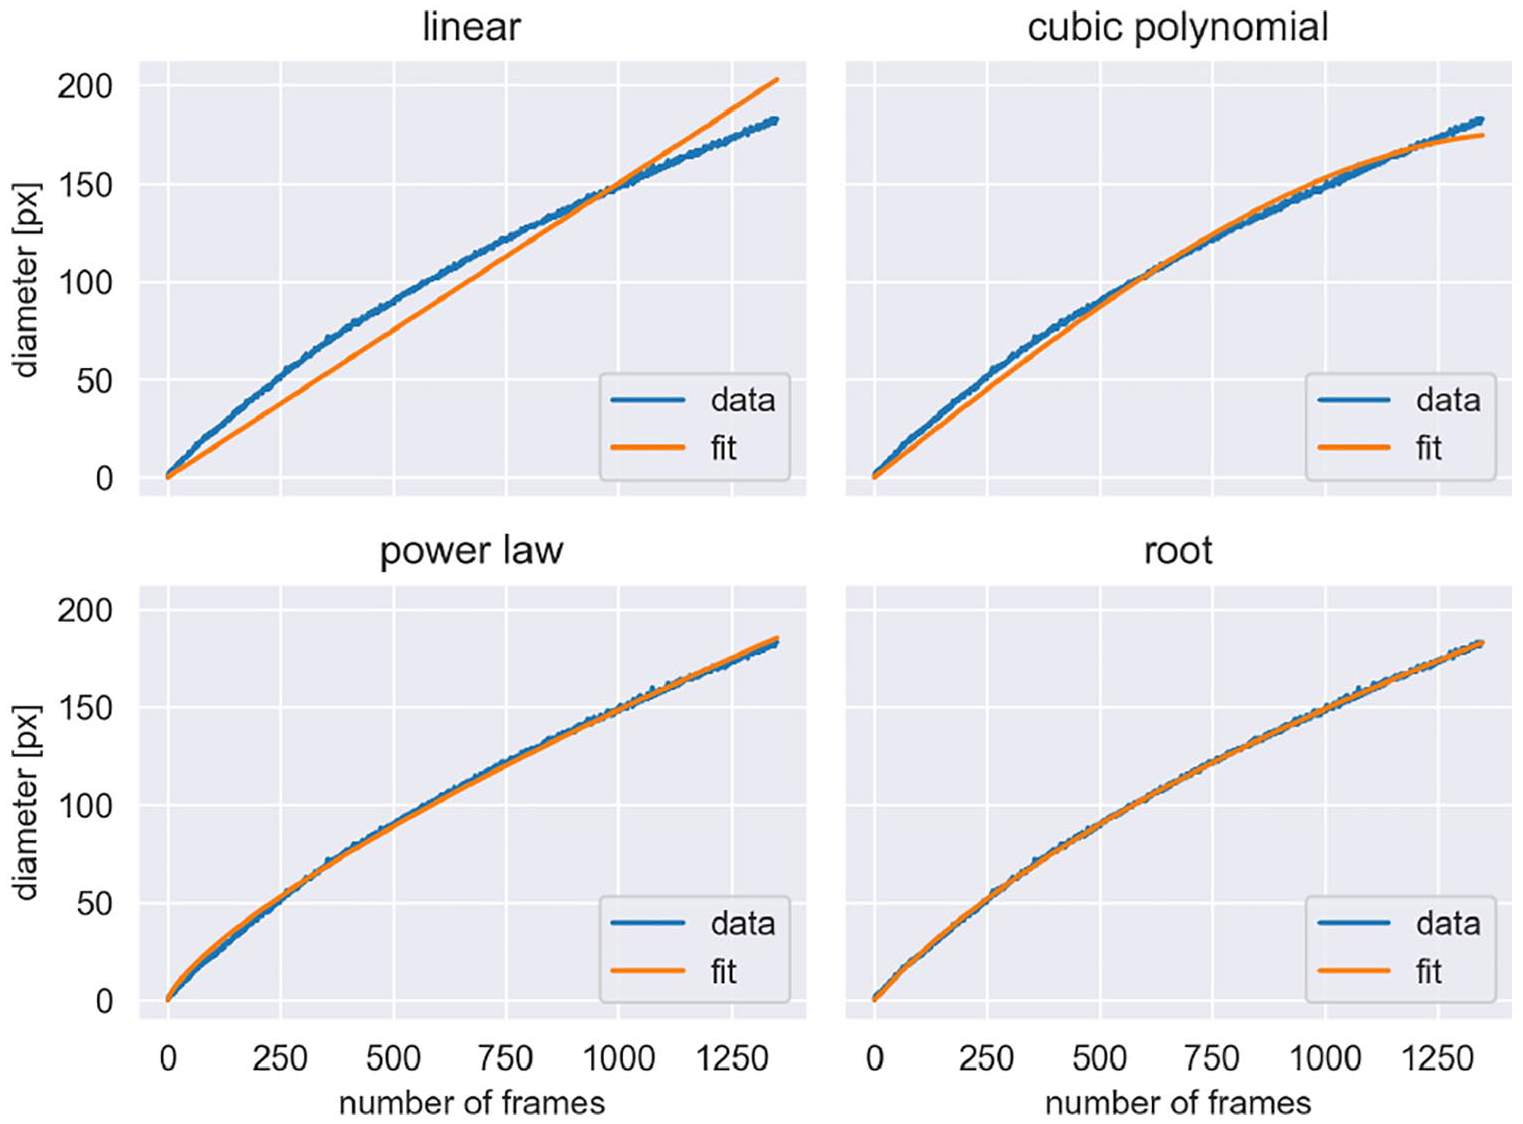
Comparison of the four kinds of fit functions in order to derive a model for the increase of the diameter by yarn length.
Estimated parameters

As seen in Table 1, the mean square error is minimal for the square root function. In all following considerations, the square root functions are used to fit the experimental data.
Training a model to predict the diameter parametrization dependent on the process parameters
According to Jansen and Gabald 24 and Finckh et al., 25 the package density changes depending on the selected process parameters, implying alterations of package diameter growth over time. The technological characteristics to consider are winding tension, cradle pressure, winding speed, and traverse ratio. The first three characteristics are self-explanatory. The traverse ratio describes the number of wraps of yarn wound within the double traverse length.
In order to analyze the influence of different process parameters onto the diameter increase we perform multiple experiments with varying process parameters. For the following experiments, cotton Nm 34 is used as material for step precision winding. Furthermore, the factors winding tension, cradle pressure, winding speed, and traverse ratio are varied at two levels due to Table 2. The machine parameter traverse ratio is an average value during bobbin production. The winding program “Middel Count,” which is standard on the Autoconer 5 winding machines, is selected for the variation of the traverse ratio of the step precision winding. The minimum and maximum values of the individual factors are chosen in such a way that the largest possible experimental space is covered and, at the same time, stable packages are created that prevent the thread layers from slipping due to small coil angles.
Two-level design with four factors. The used material is cotton with a yarn count of Nm 34. Each experiment is repeated twice.

The main goal of this section is to derive a linear regression model that interpolates the parameters of the fit function for each of the varying process parameters. Before such a model is presented, we analyze the main effects of the process parameters to the diameter increase.
Main effects
Studying the main effects of two level experiments gives us a first insight into the significance of the varying process parameters. For each input parameter combination we produce a wound package. The winder is set so that the winding process stops four times during the bobbin winding, depending on the weight of the thread wound on the winding machine. The wound thread weight correlates with the wound thread length measured by the winding machine. During the machine stops manual measurement of the package diameter are carried out by means of calipers. The final diameter of the wound package is pre-specified, so we record as fifth measurement the corresponding total yarn length of the fixed final diameter. In the following, the fourth measurement is used for the main effect analysis. Hereby, the main effect describes the change of the diameter dependent on one of the process parameters winding tension, cradle pressure, winding speed, and average traverse ratio. The diameters of the fourth measurement (with subtracted bobbin diameter) are averaged for all experiments, where the analyzed process parameters coincides with the low level. Second, the average of the diameter of all experiments is computed, where the process parameter takes the high level. From the main effects (see Figure 10), we conclude that increasing the winding tension, the cradle pressure, and the traverse ratio leads to a decreasing total diameter. Increasing the winding speed leads to an increase in total diameter. Usually, the total diameter is a given process parameter, that is, more yarn is needed to reach the final diameter and the density of the wound package is higher.

Main effect: the parameters winding tension and traverse ratio are most significant.
Linear regression model for parameterization
The simulation model of the winding process requires not only a mapping of the total yarn length to the final diameter, but the complete function. From the analysis of the reference experiment, we decided to use square root functions with two parameters in order to fit the diameter increase dependent on the yarn length. In the following, for each of the experiments corresponding to Table 2 the parameters
Computed parameters
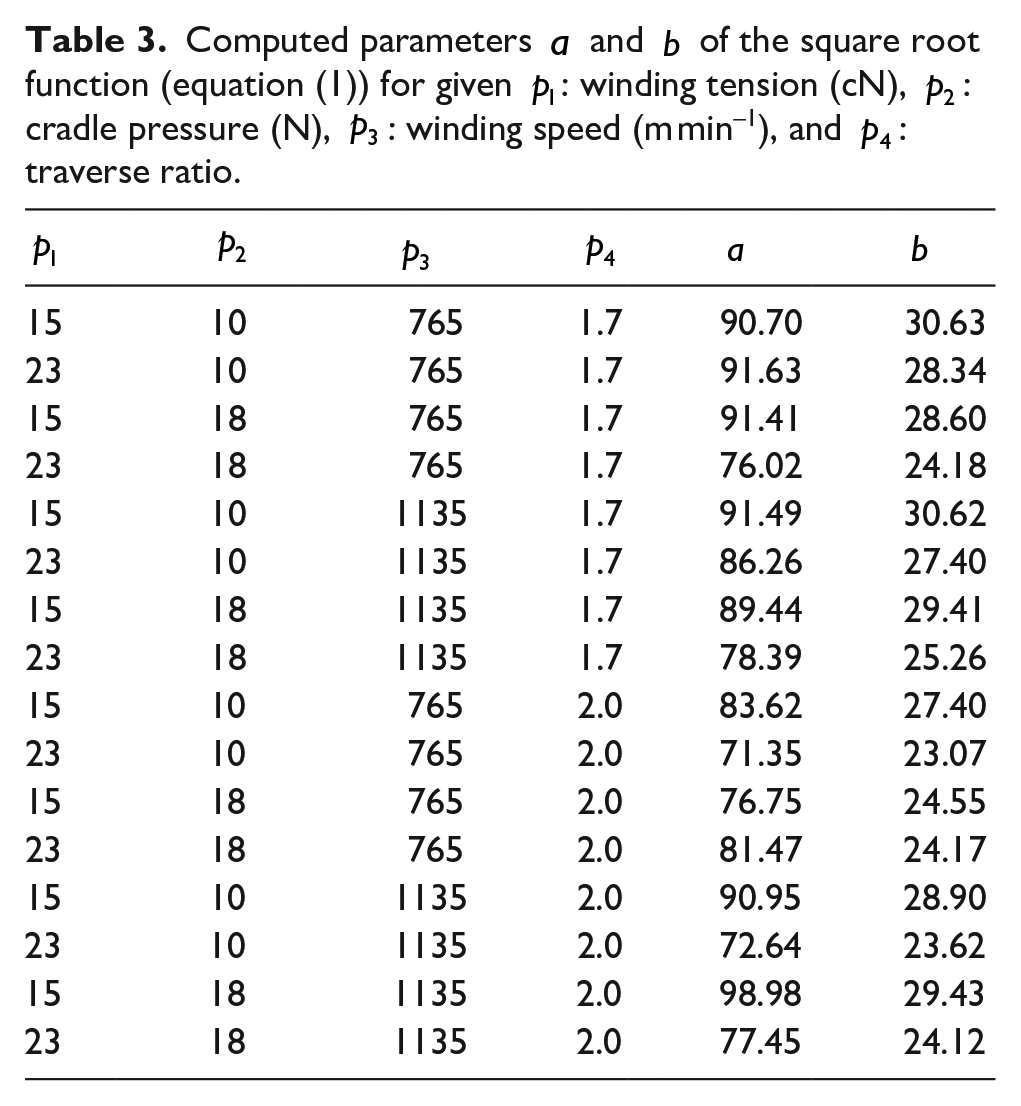
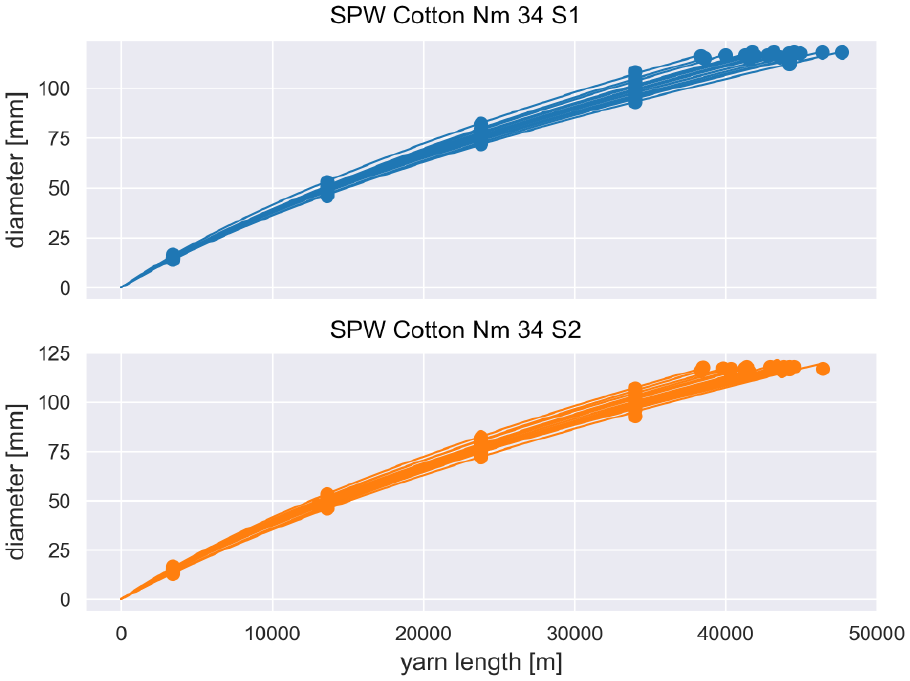
Measured and fitted data for 16 step precision winding experiments (SPW) used for the parameter computations listed in Table 3. Each experiment is repeated twice (blue series 1 and orange series 2).
From the last paragraph we found a fitting function of the diameter dependent on the yarn length. Now we train a simple model that links the process parameters of the experiments to the parameters of the fitting function.
For the training of this model, we use the open source tool scikit-learn.
26
First, we standardize the input data of the winding tension, cradle pressure, winding speed, and traverse ratio by a so-called MinMaxScaler. After applying the MinMaxScaler all input data are normalized to the range

with


Interpreting the coefficients, we observe that winding tension has the most significant influence on the diameter increase, while traverse ratio is second. The winding speed acts in the opposite direction.
Summary and outlook
The demand for a mathematical model that describes the diameter increase as a function of the yarn length in a winding process comes from the approach to model and optimize the winding process by simulations. In a first step, we perform video recordings during a winding process in order to determine the model function that principally describes the mapping of yarn length to diameter increase. The video recordings are analyzed using image analysis features of the software ToolIP. The result of this analysis is that diameter increase can be modeled as a square root function of the yarn length. The square root function itself must be parametrized with two parameters depending on the winding process.
Second, we perform a series of experiments varying the four input process parameters winding tension, cradle pressure, winding speed, and traverse ratio at two levels. From the experimental data the two parameters of the square root function are computed. Finally, a linear regression model is determined that gives us the parameterization of the square root model function dependent of winding tension, cradle pressure, winding speed, and traverse ratio.
In the experimental setup we studied only one material with a full-factorial design. In the future, the workflow implemented in this paper could be applied to further experiments in order to develop yarn length – diameter mappings for other kinds of materials and an extended range of process conditions.
Footnotes
Declaration of conflicting interests
The author(s) declared no potential conflicts of interest with respect to the research, authorship, and/or publication of this article.
Funding
The author(s) received no financial support for the research, authorship, and/or publication of this article.