
Abstract
The finishing of yarns by bobbin dyeing is of key importance in the value chain of home and apparel textiles. In the bobbin dyeing process, yarn bobbins are placed on dye spindles and passed through with dye liquor. If the winding process parameters are selected unfavorably, the density of the winding package is inhomogeneous. The inhomogeneous density distribution leads to an inhomogeneous flow of dye liquid through the package and, hence, to dyeing defects. In order to minimize dyeing defects and to reduce set-up times, we present a simulation-based parameter recommendation for cross-winding machines in this paper. We use a kinematic model of the winding process combined with an empirical model for the package diameter to optimize the package density distribution. We introduce a criterion to avoid patterning defects and adapt winding settings. For bobbins with Nm 34 Co yarn, the homogeneity of the density was improved and the color deviation was reduced by up to 50% due to these simulation-based setting suggestions.
In the textile industry, a large number of different dyeing processes are used. Dyeing can be carried out at different process steps of the textile process chain. The dyeing process used differs fundamentally depending on the material used and the form of presentation, whether fibre, strand, yarn or textile fabric. Yarn dyeing can be carried out by means of package dyeing, among other methods. The advantages of yarn dyeing compared with sliver dyeing are an increased dyeing rate and greater machine flexibility with regard to market requirements and throughput volume. 1 Results are affected by the production parameters of the package winding as well as the dyeing process. Production parameters of the fabric can also affect the properties of the final product.2,3
The principles of dyeing are described in Clark, 4 details for cotton yarn can be found in Dutta and Bansal. 5 In package dyeing, the yarn is first wound on perforated dye tubes to form cross-wound packages. The produced dye packages are then joined together to form package towers. The package towers are placed on dye spindles and fed to the dyeing apparatus. The dyeing is then carried out by a combination of chemicals, heat, pressure, and time. During the dyeing process, the dye liquor flows through the packages both from the inside to the outside and from the outside to the inside. Lewis reviewed the chemistry of reactive dyes and their impact on the textile industry. 6 Experimental optimization of the dyeing process was performed by Meraj et al. 7
The dyeing process aims at a high color accuracy, high process speed and a uniform dyeing-through (color evenness). 8 High color quality is expected from the individual packages and the entire package tower.
The dyeing results are subject to a multitude of influencing factors and their interactions.9,10 As a result of the work of Asian et al. 11 and Mueller, 12 we assume that the quality of the coloring is directly linked to a homogeneous density of the winding package. If the density is not homogeneous, the dye liquor takes the path of least resistance. 8 Not only the overall density, but mainly the local density distribution has the biggest impact on the flow of the dyeing liquid through the package. 13 Hereby, the density distribution itself depends on varying process parameters such as the yarn tension or yarn tension force, contact pressure of the winding framework, crossing angle, crossing ratio, and winding speed. Recent studies on the process parameters show the influence of the density of the package as well the dye absorption.14,15 Yarn tension is also an important parameter in unwinding. 16
For quality assurance of the cross-wound package design with regard to density, only mass-volume measurements are currently used. With this method, the mass and volume of the finished bobbin are determined and the bobbin density is calculated. Thus, the mean value of the density is determined, but not the local distribution of the density. In order iteratively to approximate satisfactory package parameters the procedure of test dyeing is widely used. However, this method is very time-consuming due to its iterative approach. Furthermore, the operator’s experience in configuring the machine settings is essential for the required set-up time. Controlling the quality of the dyeing process through simulations has been described by de Souza et al. 17 and Shamey and Zhao. 18 In recent developments, Zhang et al. have applied machine learning techniques to the problem of detecting defects in yarn-dyed fabrics. 19
An overview of simulation methods for package winding is given by Kyosev. 20 Different levels of detail can be considered. Geometrical models or string models describe the yarn as a one-dimensional curve and are useful at the meso-scale of the winding, whereas more detailed analysis can be performed by three-dimensional (3D) beam models, which remain restricted to short yarn lengths. Simulations of winding processes using the string model have been presented; for example in Quanjin et al. 21 Praček and colleagues used the string model for simulating the unwinding process.22,23 Li et al. proposed a finite element model for detailed simulation of the dynamics of yarn segments. 24 Liu et al. used finite element modeling to simulate the internal stress of the yarn due to yarn tension and winding speed. 25
Our approach is to use simulations to find improved process settings that lead to an optimized density distribution of the wound package. For industry this means that set-up times as well as the number of dyeing defects can be reduced and machine operators can be supported. The reduction of set-up times is particularly relevant for the current market development, towards ever smaller batch sizes and customer-specific products. When minimizing the number of dyeing errors, it should be noted that dyeing errors that occur during package dyeing usually only become visible during further processing of the textile fabric. This results in additional costs that far exceed the material value of the dye packages.
In this paper, we combine the geometric string model approach for simulating yarn at the layer level with an empirical model, based on experiments of the package diameter growth. With this approach we achieve a simulation of the density distribution of the full package, which we use as an optimization target for improving process parameter settings.
We first present an experimental study of different winding processes and the influence of their parameter settings on the density. Hereto, the wound packages are examined with different measuring methods (torsion needle measuring, high-speed video recordings, µCT-images) regarding yarn displacement and density distribution. Based on these data, a virtual package is created using simulations of the kinematics of the winding process. Furthermore, we present an efficient evaluation of the local density distribution of the simulated package. From this simulation model, an optimization algorithm is developed that calculates improved setting proposals for the cross-winding machine leading to packages with satisfactory dyeing results. Furthermore, new winding programs for step-precision winding have been developed to adapt the traverse ratio depending on the package diameter. To validate the produced packages, test dyeings are carried out and color deviations are evaluated using the CIEL*C*H* color space system. Finally, we analyse the validated results.
Experimental details
Material and machinery classification
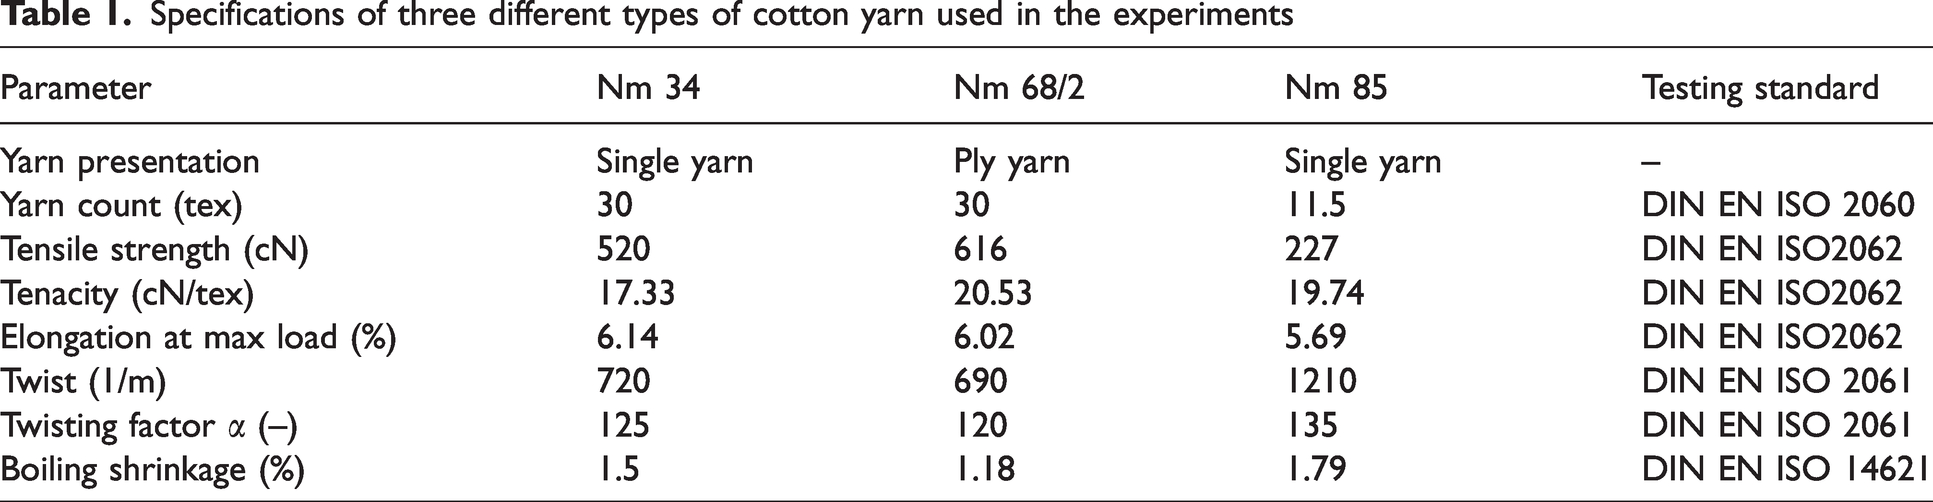
In this project, cotton yarns of different counts and forms of presentation were used as experimental materials. The yarns examined were untreated carded ring yarns. The yarn counts of Nm 34, Nm 85 and Nm 68/2 were used with material properties as given in Table 1.
Specifications of three different types of cotton yarn used in the experiments
The production of the cross-wound packages is carried out on an Autoconer X5 E-type automatic cone winder from the Schlafhorst branch of Saurer Germany GmbH & Co. KG, Übach-Palenberg, Germany. The test dyeing of the packages is realized with a laboratory dyeing machine type Eco-Bloc Q from the company Thies GmbH & Co. KG, Coesfeld, Germany. A reactive dyeing process is used with a blue target color chosen to make nuanced color variations readily apparent. Three packages are stacked together in a package tower for dyeing. In total 48 packages have been dyed.
Testing methods
Testing of the wound packages is done with two different test methods: torsion needle measuring and by evaluating µCT images. Furthermore, the winding process itself and in particular the increase of the package diameter with time/yarn length is documented by high-speed video recordings.
Torsion needle measuring
To determine the local density distribution, measurements were carried out using UNITORQ torsion measuring needles from Sensora Textile Measuring Instruments & Consulting, Liberec, Czech Republic. In this method, measuring needles are punctually inserted into the winding body. The needles are pierced into the package surface at different radial and axial positions. Subsequently, the maximum torque generated during the manual needle rotation is recorded. The maximum torque correlates with the density distribution in the package. 26 The maximum torsional moment is recorded in units of 10–3 Nm. The local density measurement by using a torsion measuring needle is carried out on the face of the package in the radial direction and on the outer surface in the axial direction. Eighty measuring points per cross-wound package are checked using torsion needle measurement.
μCT images
µCT images of the packages are taken to determine the local density distribution. Microfocus tubes are used in µCT systems so that a higher level of detail resolution can be achieved. The evaluation of the density distribution of the dyeing packages by means of µCT images is patented by SSM Schärer Schweiter Mettler AG, 27 but is only rarely used in the industry due to the high costs involved. The required µCT images are generated using the CT-Alpha System from the company ProCon X-Ray GmbH, Sarstedt, Germany.
High-speed video recordings
To be able to reproduce the kinematics of the yarn in the simulation, high-speed video recordings of the winding process are generated, see Figure 1. These are necessary because the set machine parameters do not exactly correspond to the yarn displacement during the winding process by means of single yarn guides. Here the effects of stroke breathing and drag error overlap. Stroke breathing is a common procedure to avoid hard package edges. The stroke width is changed periodically. Thus, the yarn displacement in the edge area is evened out. The exact values of the stroke change are internal knowledge of the winding machine manufacturers and are not available to us in this research project. In addition, a dragging error occurs due to the distance between the yarn guide and the package. The point at which the yarn is placed on the package lags behind the traversing movement of the yarn guide. 28 Therefore, the position of the yarn guide element does not correspond to the exact position of the yarn placement point on the package. The video recordings were made with a high-speed camera i-Speed 3 from Olympus K. K., Shinjuku, Tokyo, Japan. The recordings are made at 7500 fps. Analysis of the package diameter depending on process settings and yarn length is performed as described in Gramsch et al.: 29 the video frames are segmented to detect the package and machine display showing the current yarn length. Edge detection is performed to find the package size in image space, which is converted to the real diameter of the package using size reference markers. After filtering of processing artefacts, an ansatz function is fitted which maps the yarn length to the package diameter for the given settings of the winding unit.
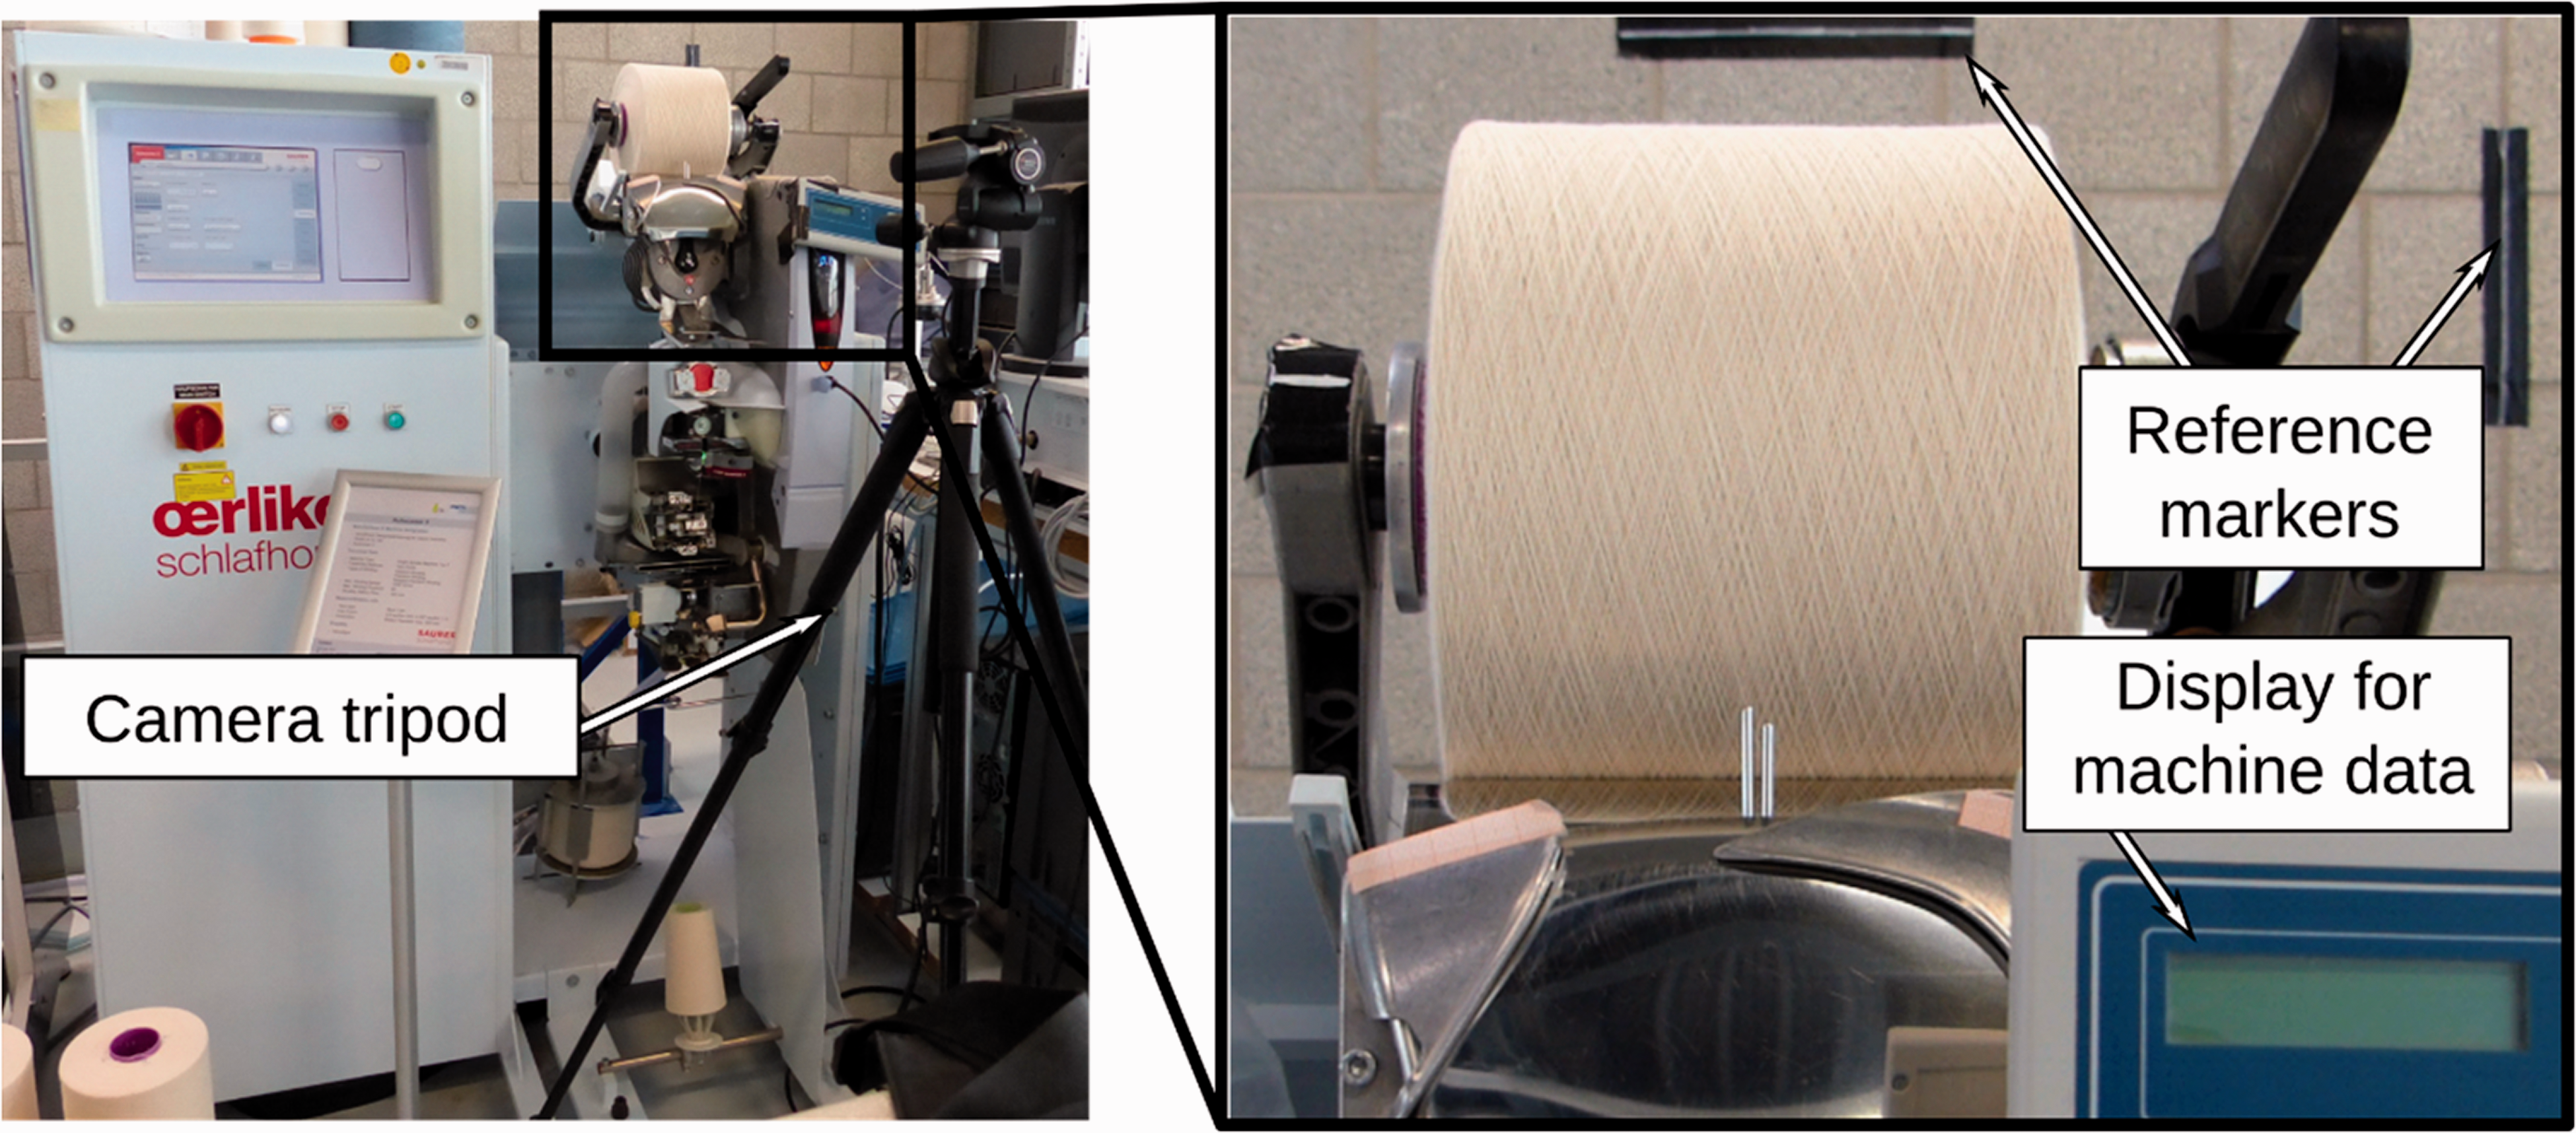
Experimental set-up for measuring the relation between package diameter and yarn length: camera mounted on a tripod, zoomed-in view including reference markers and machine display.
Color measurement
Three knitting samples from different areas of the winding body are produced per dye package, see Figure 2. Colors are measured and differences compared using two formulas: the CIE L*C*H* color scale and the DE CMC formula. In the CIE L*C*H* color scale, the value L describes the luminance, C describes the chroma and H the hue angle. The color difference 
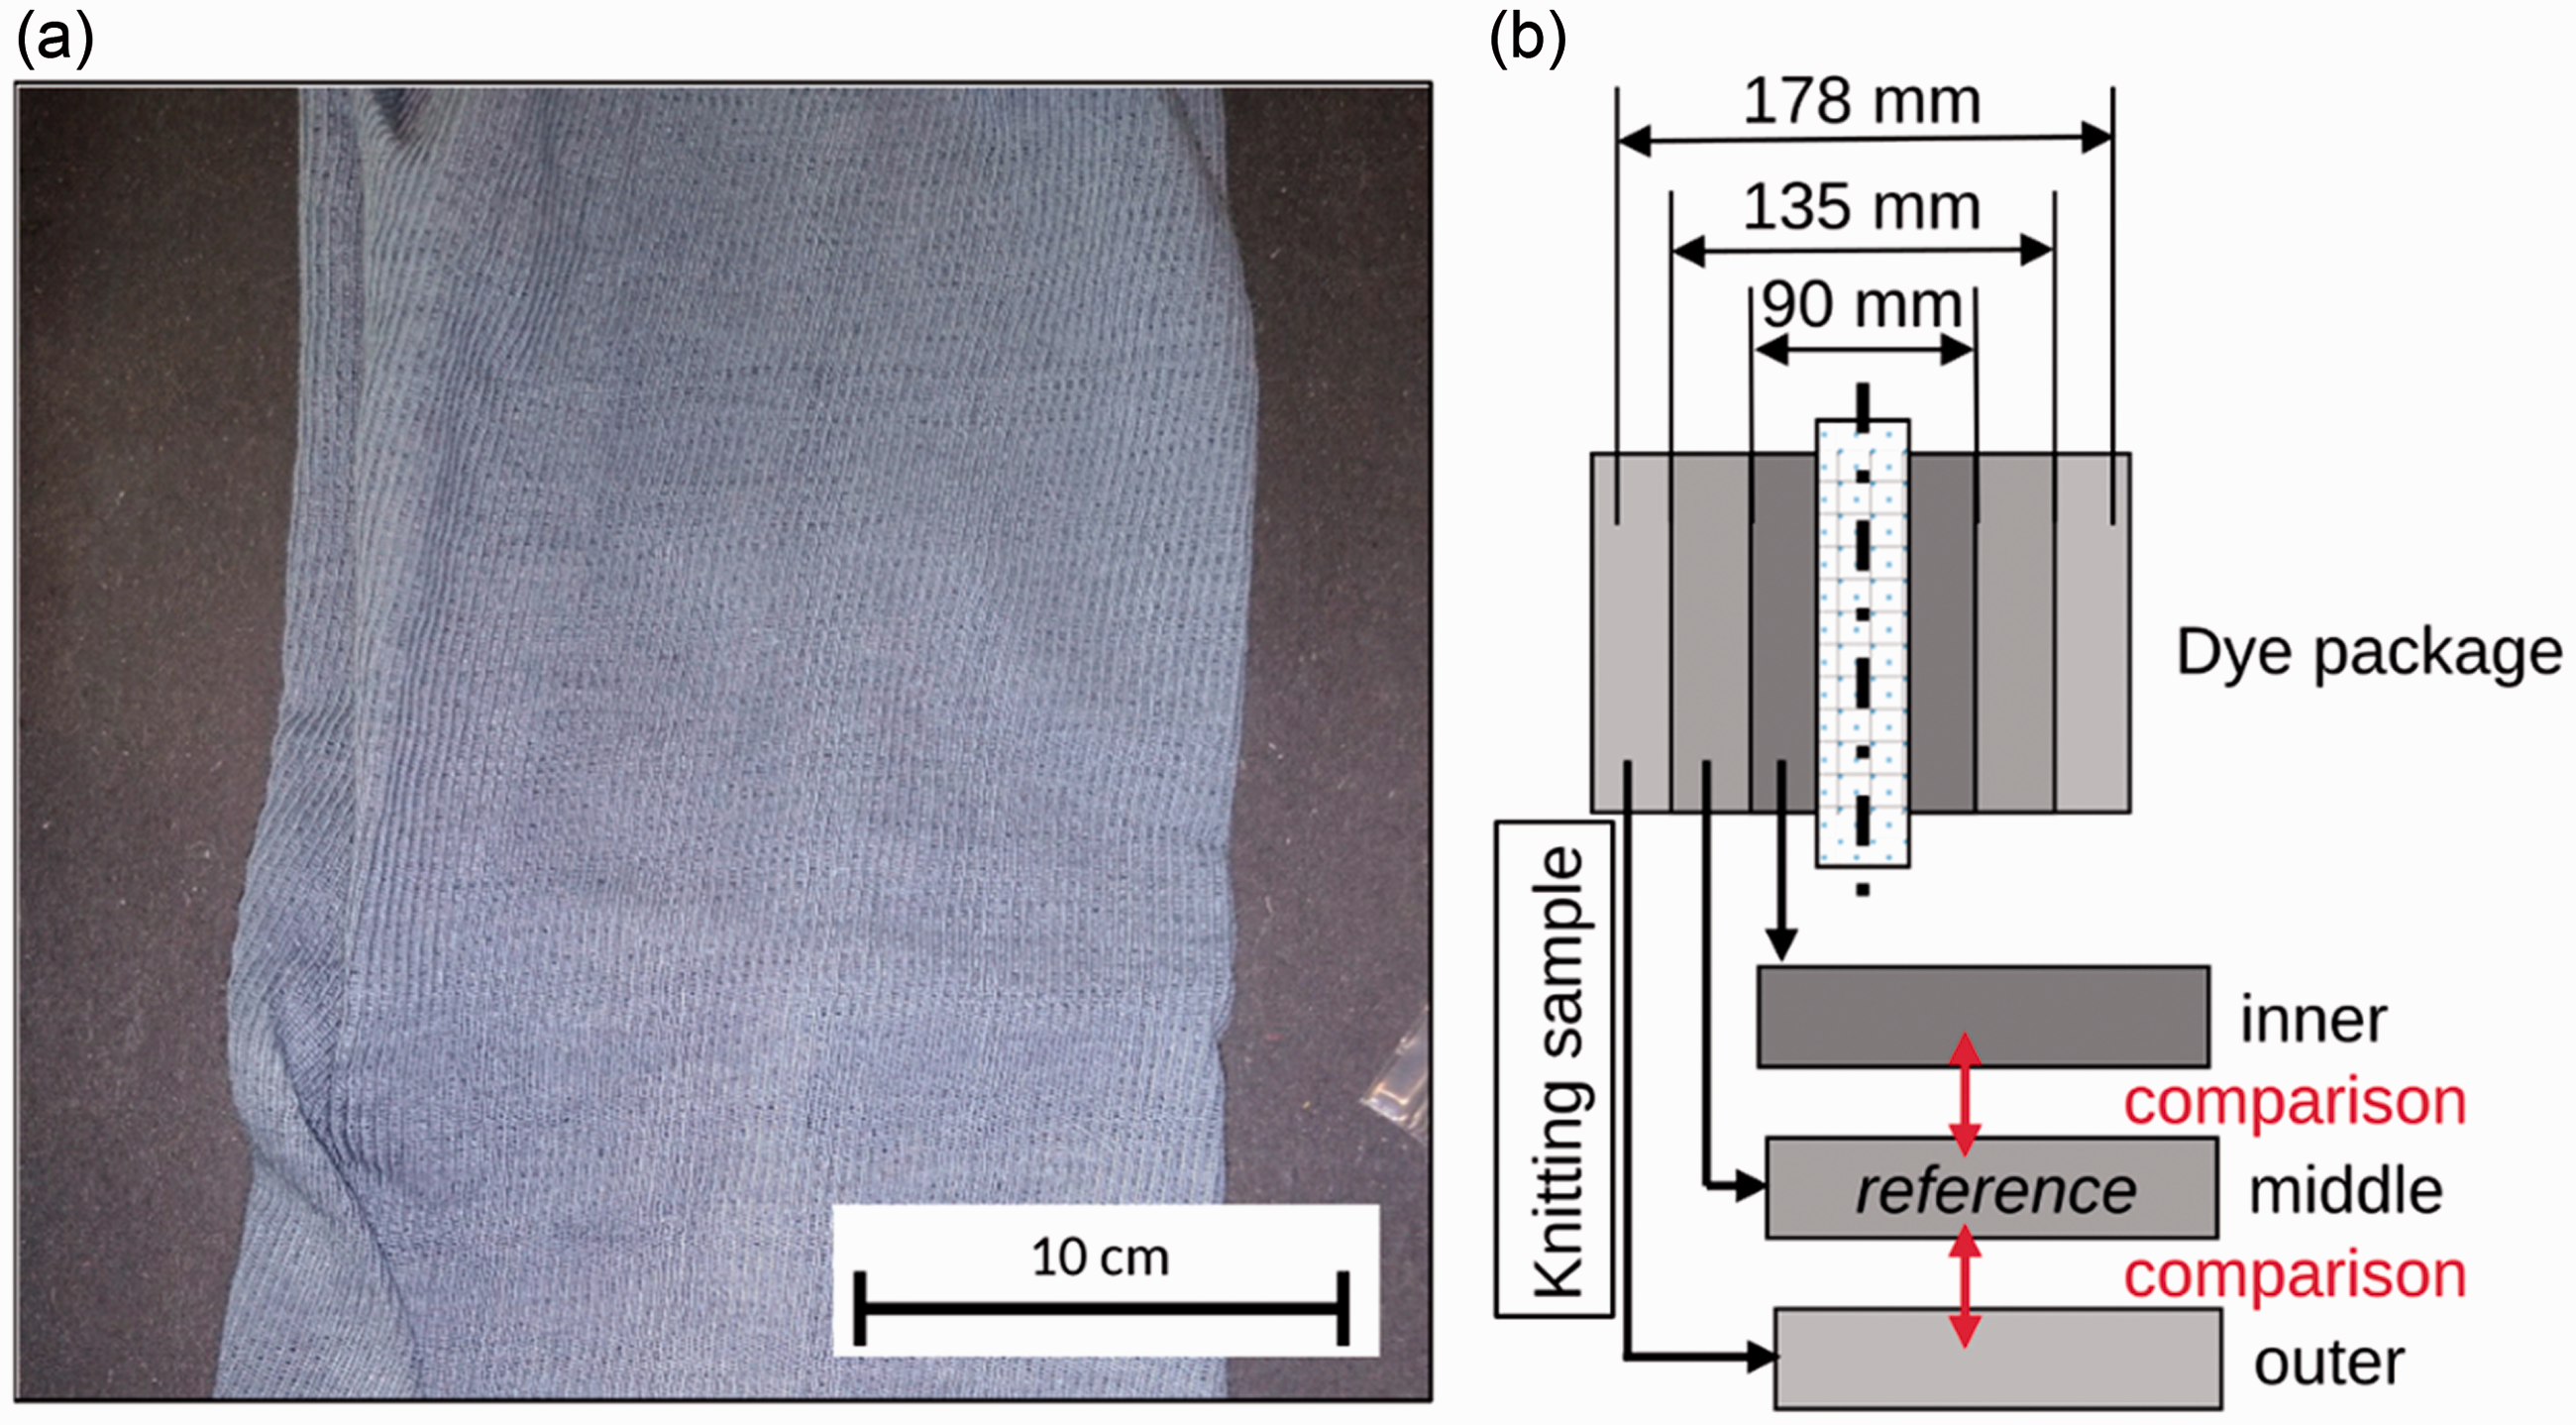
(a) Picture of a reference knitting sample of the experimental run for Nm 34 step precision winding. (b) Schematic of the three different areas of the winding body used for knitting sample. Samples from the middle are used as reference to compare to the inner and outer samples.
Using the DE CMC formula the color difference was classified as ‘indistinguishable’ for all packages. According to Eichler, 30 this formula may be imprecise for saturated blue colors, so in the following only the results for the CIE L*C*H* color scale are presented.
The Datacolor SF 600 from Datacolor AG, Lucerne, Switzerland, is used for color measurement. The selected light type is D65 and the standard observer was set to 10°. The knitting sample was folded eight times.
Experimental design
The simulation-based parameter recommendation for cross-winding machines is developed for two winding types, random winding and step precision winding. For the random winding three yarn types Nm 34, Nm 85, and Nm 68/2 are tested, see Table 1. For step precision winding, the yarn types Nm 34 and Nm 85 are examined.
Evaluation of µCT images
In addition to the high-speed camera images and torsion needle measurements, µCT images are evaluated to determine the local density distribution of the package. The resolution of the µCT machine capable of fitting packages with a diameter of 180 mm was deemed insufficient. Instead, a different µCT machine was used with a higher resolution which can only fit smaller total volumes. Thus, packages with a smaller diameter are evaluated by first winding the package to 180 mm diameter, then unwinding back to 80 mm in diameter. The measurement is then performed in a total volume of 135 × 135 × 150 mm. The winding to full diameter and subsequent unwinding is done to increase the comparability of the result to a full-size package, as only winding to the reduced size would neglect the effects of the pressure of the outer layers onto the yarn. Still, the reduced size packages have some remaining differences to the full-sized packages. The effects of this have not been investigated further.
Packages are wound on both plastic and paper tubes, as plastic tubes caused measurement artefacts which could be avoided with paper tubes. Density values for voxels are calibrated by including a solid of polylactide with a known density of 1.225 g/cm3. The centre axis of the bobbin is detected, and the image aligned accordingly. The image volume is segmented into voxels belonging to the yarn, tube, surrounding air, and calibration solid, see Figure 3. As the diameter of the yarn in the wound package is on the order of the sampling resolution, it is not possible to track the yarn robustly in the image.
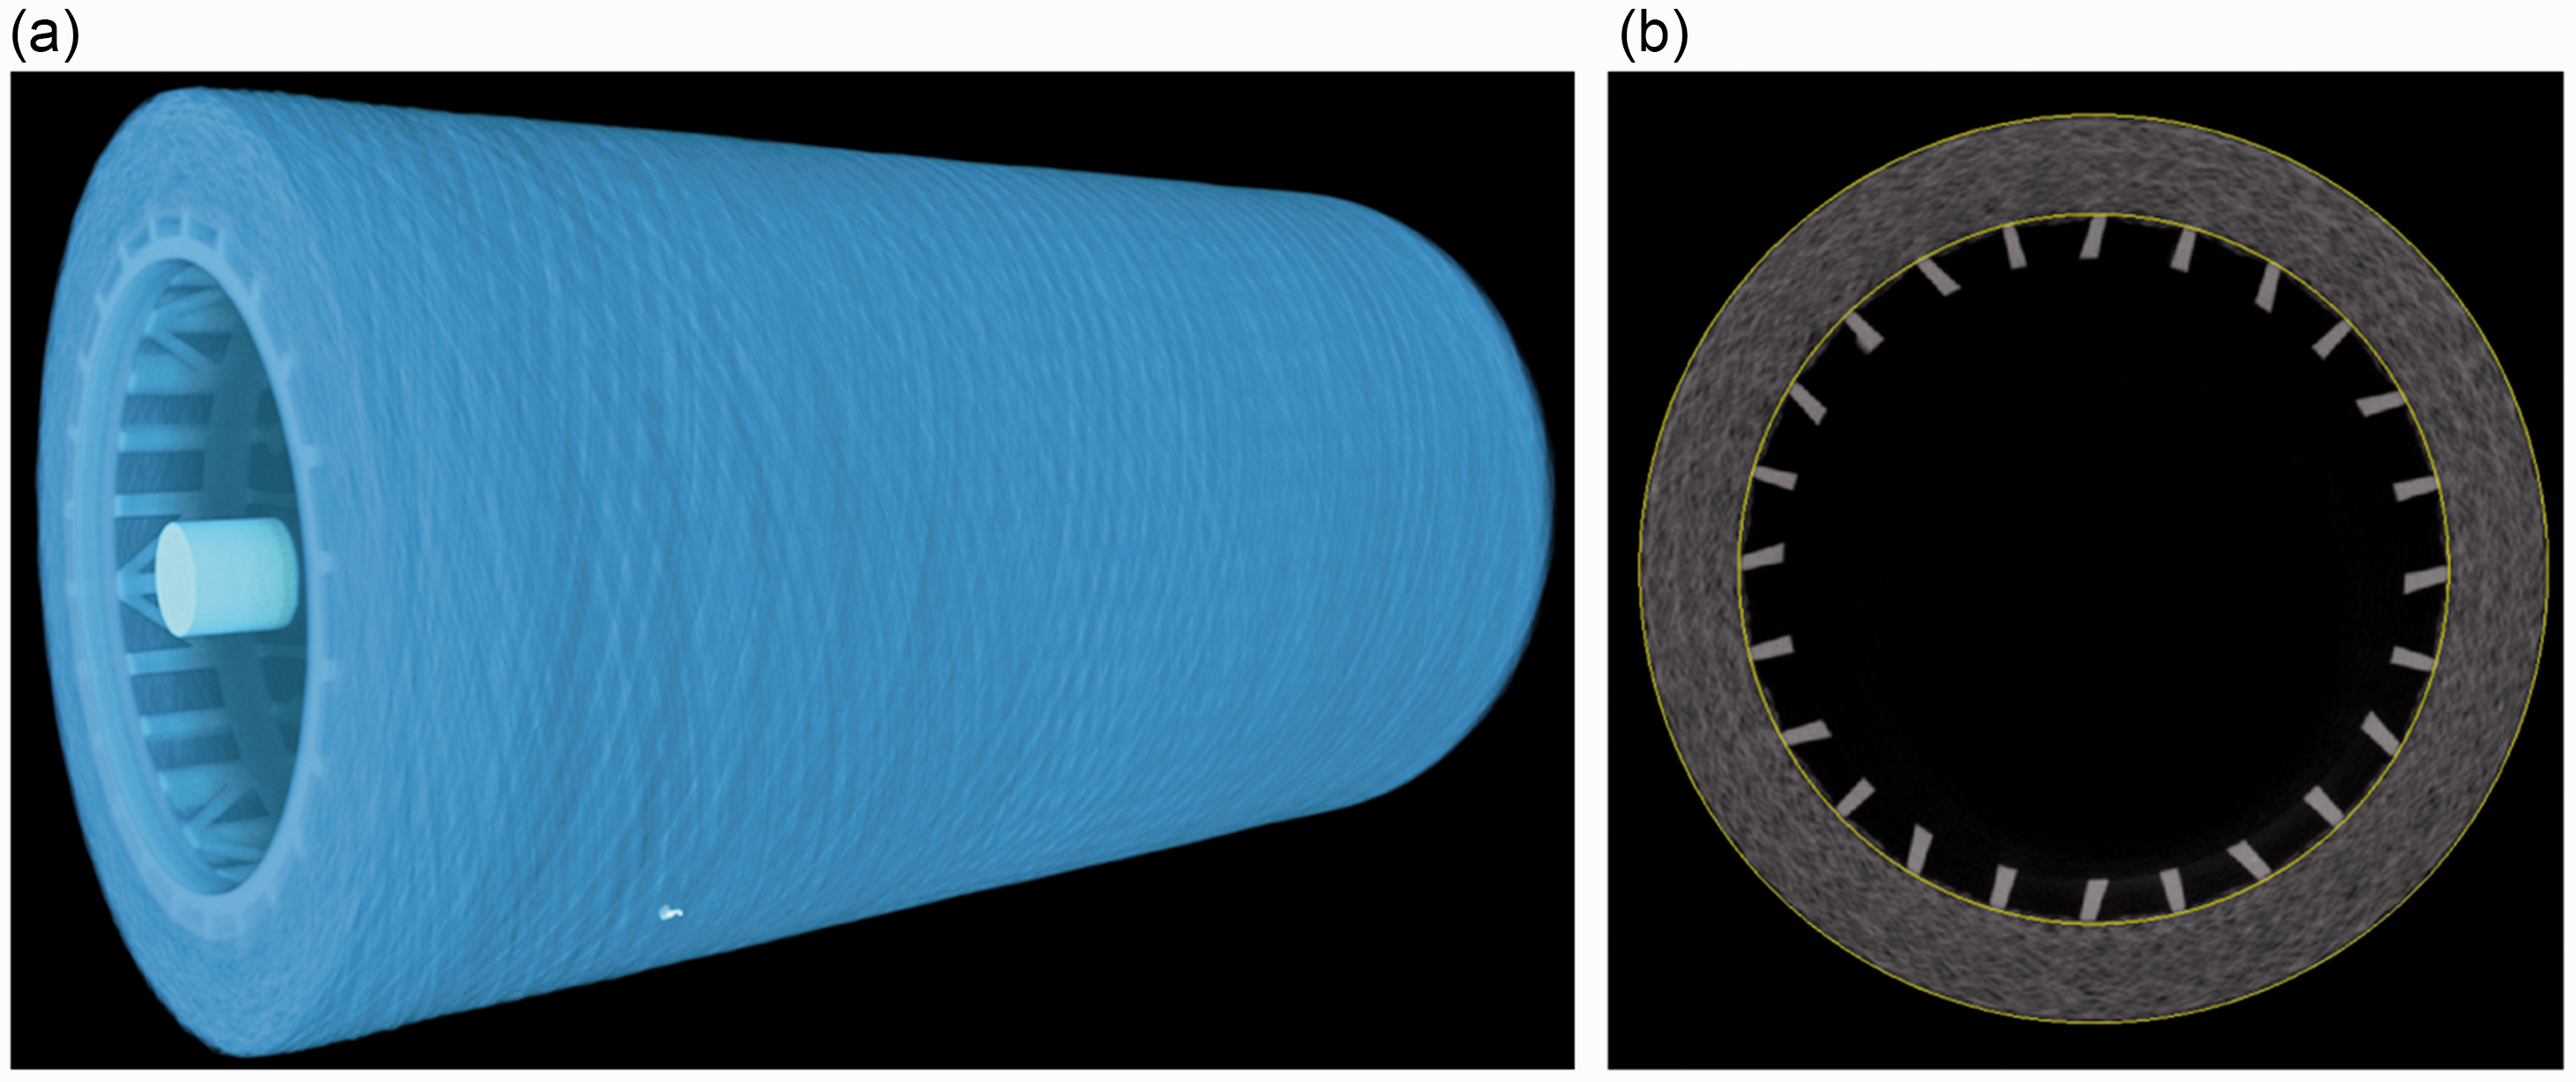
µCT image of cross-wound package (a), axial slice through image with segmentation of yarn (b).
The densities in the radial and axial direction are evaluated for packages of reduced size and, along with the other measurements on full size packages, used to calibrate the process parameters of the simulation for the reference package.
Simulation and optimization algorithm
Existing theoretical and model-based investigations and approaches to the description of cross-wound packages are critically discussed in Reinbach et al. 31 for the geometry, the density distribution,32–34 the packing stability,33,35,36 the stress and strain distribution,8,37–39 and the pay-off properties of cross-wound packages.40,41
In order to optimize the cross-wound package we need a simulation algorithm that produces virtual packages for given process conditions. According to Kyosev, 42 there are three categories of modeling approaches for constructing the geometry of virtual textiles: geometric 3D sketching or topology-based methods, process simulation, and image reconstruction. As our goal is to optimize the cross-wound package due to the process conditions, we start with the second approach. This method can produce the exact path of the yarn within a textile, but has the disadvantage of requiring large computation times. So we have to simplify parts of the process modeling chain by integrating a model based on process simulation (kinematic model) with an experimentally parametrized model.
We start to describe the individual windings of the yarn on the bobbin by a kinematic model as in Kyosev. 20 Here, the layer structure of the package is reproduced in time by considering the already wound filaments as a body of rotation. The body of rotation itself is described by cylindrical coordinates. The winding process is broken down into small time steps. The position of the yarn guide can be determined at any time, based on the process parameters of the yarn traversing system. With this information, it can be deduced where the next yarn segment will be wound, if it is known what layer radius the enveloping rotational body has reached at this point in time.
However, we combine the method described in Kyosev 20 to simulate the yarn geometry in thin layers with an approach to advance to the next layer using our empirically parametrized model for the relationship between wound yarn length and package diameter. This allows us to simulate the individual layers at the meso-scale (individual yarns), while still computing the whole wound package at the macro-scale (distribution of yarn within each layer and local densities).
In the following we present the kinematic model used for the simulations and optimizations of the cross-winders in this project. The kinematic model requires too much computer memory to represent the complete bobbin, so we present an efficient discretization strategy with respect to the local density distribution. Finally, we derive the optimization algorithm in general and present results of the optimized wound packages.
Model of the yarn kinematics during winding
The model of the yarn kinematics describes how the yarn is wound onto the bobbin. The model is based on the observation of the kinematics of the yarn winding. The yarn itself is modeled as a curve in a 3D space, which describes the laying of the yarn on the bobbin together with the yarn diameter dFib. The curve x(t) thus represents the centre line of a 3D yarn with a circular cross-section. In the following, cylindrical coordinates
The cylindrical coordinates can be converted into Cartesian coordinates as follows (compared with Weisstein):
43
To describe the curve, it is sufficient to model the speeds of the individual components:
increase of the bobbin radius; angular speed of the coil; traversing speed of the yarn guide.
Together with suitable initial values, a complete description of the curve is obtained by integrating the resulting ordinary differential equation (ODE) over time.
Efficient computation of the local density in simulated wound packages
The model of the yarn kinematics describes the yarn curve as an ODE. After choosing suitable initial conditions this equation can be integrated with numerical standard procedures like the Euler method by discretizing the time. Furthermore, the resulting curve must be discretized for the successive calculation of the density, so the choice of the discretization scheme should be carefully considered.
The total length of the wound yarn is extremely large compared with the discretization length. In the test series, for example, more than 80 km of yarn was wound onto a bobbin. The complete representation of the yarn curve therefore results in an extremely high storage consumption. A single layer with a thickness of 1 mm requires, depending on the discretization, already more than 1 GB of storage. As only the density distribution is required for the following simulation steps, we calculate a discrete density matrix for each layer. This matrix is filled step by step by calculating the yarn curve for each winding stroke and discarding the data of the curve that are not needed any further.
A radial layer i comprises the volume of the hollow cylinder with 
The relative density matrix
At the beginning of the simulation of a layer we initialize
Finally, the local density matrix
This information can be converted directly into yarn volume per cell and, hence, to the real local density. By summing the elements in 
For a yarn with circular cross-sectional area 
The corresponding volume 
For a yarn with a constant titer 
Optimization algorithm
The aim of the optimization algorithm is to adjust the process parameters so that the density of the wound package is as uniform as possible. For this purpose, we proceed as follows. First, we globally optimize the radial distribution of the density by selecting a suitable crossing angle depending on the current package diameter. Within a single radial layer, we vary this crossing angle slightly to avoid image patterning defects.
In a first step we divide the virtual wound package into individual radial layers and evaluate the average density 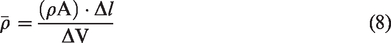
If the mass is continuously distributed along the package diameter 
As an optimal package should have a constant density along the package diameter, it is therefore necessary to find a winding program 

Thus, we have reduced the problem of finding an optimal general winding program to the problem of finding an optimal interpolation factor 
As initial condition we set
The integration constant 
Prototypical application of the optimization algorithm to a random winding process
In this section we exemplify the application of the optimization algorithm to create an optimized step precision winding program for cotton with a yarn count of Nm 34, based on the corresponding measurement data. The results of the following sections for different materials are achieved analogously. The optimized program is set up for the following parameters of the cone winder: winding tension 18 cN, cradle pressure 10 N, winding speed 1000 m/min. Given these settings, we know the functions
Total yarn length with respect to the bobbin diameter (a), and relative density of the bobbin (b).
Further we compute the winding angle from the optimized interpolation factor by correspondingly interpolating the constant winding angles of the input programs with the same factor. Figure 5 shows the resulting optimized winding angles, as well as winding angles for several other programs.
Target winding angle curve resulting from interpolation to achieve homogeneous density. For comparison, different winding angle curves for random winding (RW), precision winding (PW), and step precision winding (SPW) programs are shown.
The random winding programs are labeled RW, with RW 1.4 and RW 2.0 designating their traverse ratios. The precision winding (PW) programs shown have a winding angle that starts at the same value as the respective random winding program. For comparison, also two step precision winding (SPW) programs are shown, which start at angles corresponding to traverse ratios of 1.7 and 2.0. The random winding programs have a constant winding angle, whereas the winding angle of the precision winding continually decreases. The step precision winding is a combination that combines the benefits of random and precision winding. Our interpolated winding angle aims to produce an optimized density distribution and also decreases with diameter, but less strongly than the precision winding. This does not yet consider local winding artefacts, which are addressed in the following.
So far, we have only considered the global density homogeneity resulting from the winder parameters and interpolated winding angles without any winding artefacts. However, the computed winding angles can locally produce patterning artefacts, which have a strong negative effect on density and package quality. To solve this problem, we apply a second optimization step. We define the interpolated winding angles as the target angles and give a range of ±0.5° around this target. In this range, we compute a new optimal winding angle that aims to minimize image patterning.
We discretize the bobbin into radial layers and for a given diameter and corresponding winding angle compute the local density matrix 
This CV value serves as a criterion for detecting image patterns, with lower values indicating less patterning. As the CV values as well as the presence of patterns is highly sensitive to small variations to the winding angle, we first densely sample the interval around the target angle and apply a smoothing filter to the sampled values, then find the winding angle setting which minimizes the CV value in the target interval.
To detect patterning reliably using this criterion it is important to choose an appropriate layer thickness or, correspondingly, length of simulated yarn in the layer. If the layer thickness chosen is too small, the resulting density matrix will show large areas without any yarn material even for angles that do not cause patterning. Likewise, if the simulated layer thickness chosen is too large, any resulting patterns will eventually be averaged out by further winding on top of it. Figure 6 demonstrates this phenomenon by comparing real and simulated windings with and without patterning. For each of the three chosen layer thicknesses, the CV value of the simulated layer corresponding to the image pattern is larger than the one without patterning defects. However, only for the thickness of 0.2 cm is this difference significantly large reliably to use it for optimization purposes.

Comparison of windings with and without patterning defects. While all images visually appear to contain patterning at first glance, for the right-hand side images this is only due to the layer not being filled completely (0.1 cm) or multiple times (1 cm). Comparing the layer size 0.2 cm reveals that the left image has more extreme values whereas the right is more evenly distributed (compared with color bar, Table 2).
The simulation images in Figure 6 need to be analysed carefully. For the setting that does not produce patterning artefacts, the yarn is densely packed but is not forming ribbons. In the simulation using a layer thickness of 0.1 cm, the density matrix only contains values of 0, 1, and 2, corresponding to empty areas, areas containing one yarn segment, and areas where yarn from the upward and downward stroke overlap, respectively. As the simulated layer thickness is too thin, the layer is not yet filled completely, thus it visually looks like large diamond patterns. Simulating further yarn deposition, however, shows that the remaining areas will be evenly filled, as can be seen for layer thickness 0.2 cm. In contrast, the simulation of the setting producing patterning defects will look more evenly distributed early on, but then lays multiple yarn segments on top of each other, failing to fill the complete layer.
The simulations correspond to CV values of Table 2.
CV value as optimization criterion to distinguish between good and bad quality winding due to image patterning
Figure 7 shows the target angle and optimization range, as well as the resulting optimized angle. Note that the layer thickness for the CV criterion to detect patterning is independent of the discretization of the target angle. The optimized step precision winding program consists of one angle value per 1 cm bobbin thickness (with the angle changing as per a precision winding in this range), whereas the simulation for the CV criterion is performed using a layer thickness of 0.2 cm.
Optimized winding angle within the optimization range around the target angle.
Simulation results and experimental validation
Based on the setting recommendations of the algorithm, parameter settings of the automatic cone winder are adjusted. New winding programs for step precision winding are created to improve the homogeneity of the density distribution within the package. For this purpose, the winding ratio is adjusted depending on the current package diameter. The winding ratio is adjusted in steps of one millimetre for each increment of package diameter. In the following it is examined whether the density distribution within the package could be homogenized in comparison to the reference packages by means of simulation-based adjustment proposals. This is done by torsion needle measurements and µCT image analysis. Subsequently, it is reviewed whether the homogenization also results in a perceived reduction of color deviations.
Homogenization of the density distribution
Torsion needle measuring
By means of torsion measuring needles the local density distribution within the winding body is measured. The local density distribution shows a similar trend for the optimized packages as for the reference packages. This is characterized by increased densities in the edge area and increased densities near the tube. In order to enable a quantifiable comparison of the density variations, the torque of the two measuring points closest to the core is compared with the remaining measuring points on the front side of the package in percentage terms. The torques in the edge area of the package are also compared with the remaining measured values on the outer surface. Figure 8 and Figure 9 show the measured values of the torques recorded on the package surface. The variation of the torque and thus the density inhomogeneity of the optimized packages could be reduced in all test series compared with the reference packages. The test series of the Nm 34 step precision winding is particularly noteworthy. In this test series, the densities in the edge area are identical to the remaining densities in the package surface area.
Torsion needle measurement on the surface of the package surface of the reference package.
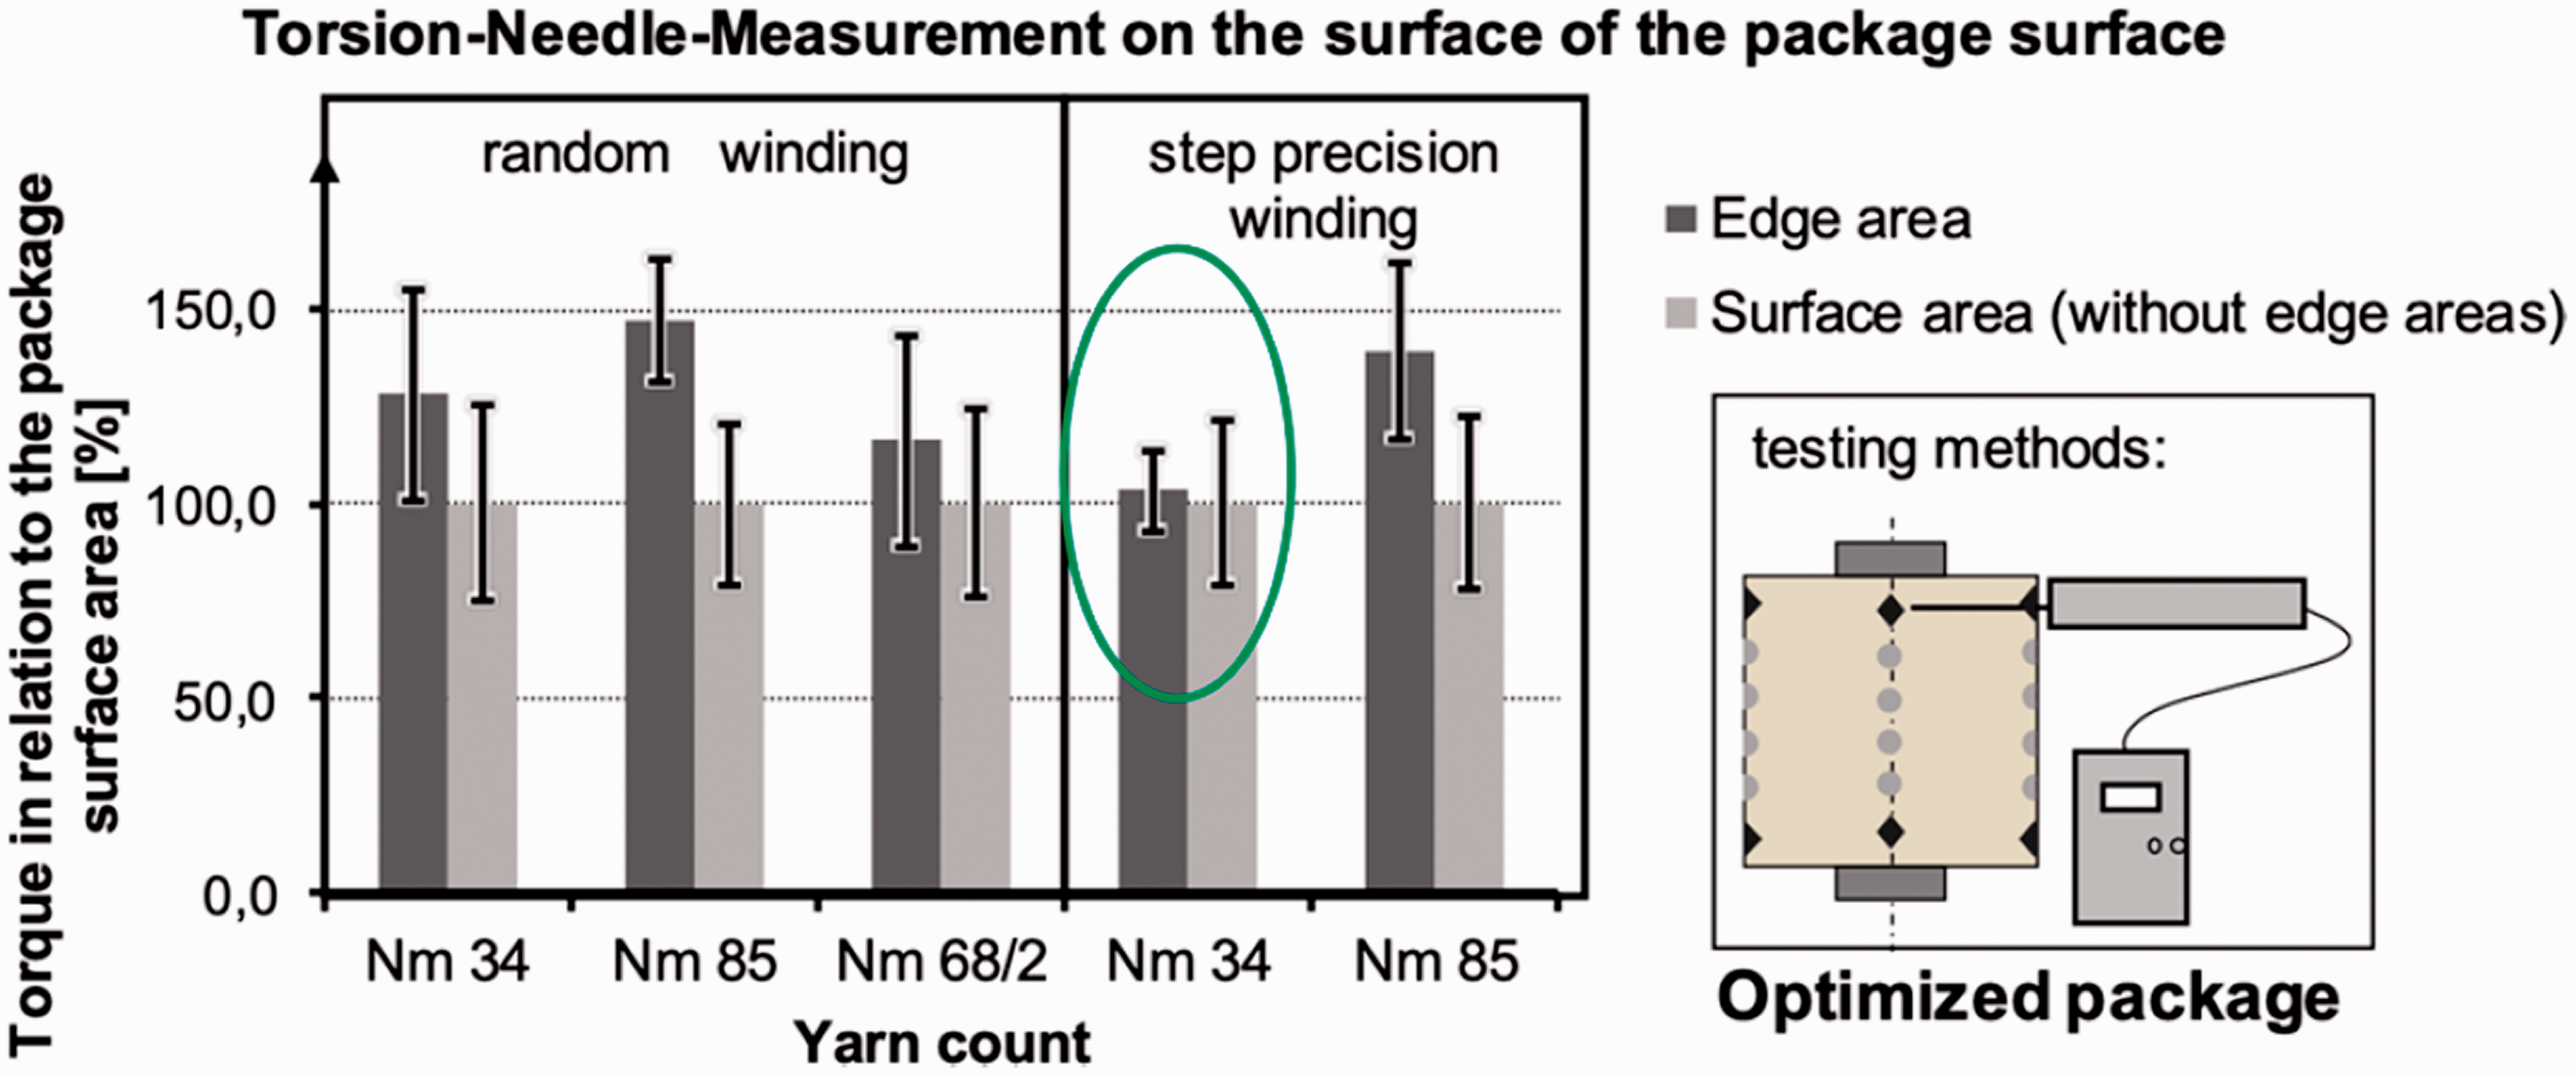
Torsion needle measurement on the surface of the package surface of the optimized package.
The measured torques at the package ends are shown in Figure 10 and Figure 11. The homogeneity of the density over in the radial direction of the package was only slightly improved. In the case of the test series Nm 68/2 random winding, the optimized package even shows a more inhomogeneous density than the reference package. This could be due to the fact that the simulation for the Nm 68/2 yarn was carried out with the same evaluation criteria as the Nm 34 single yarn. However, the yarn has a much more voluminous structure than the single yarn.
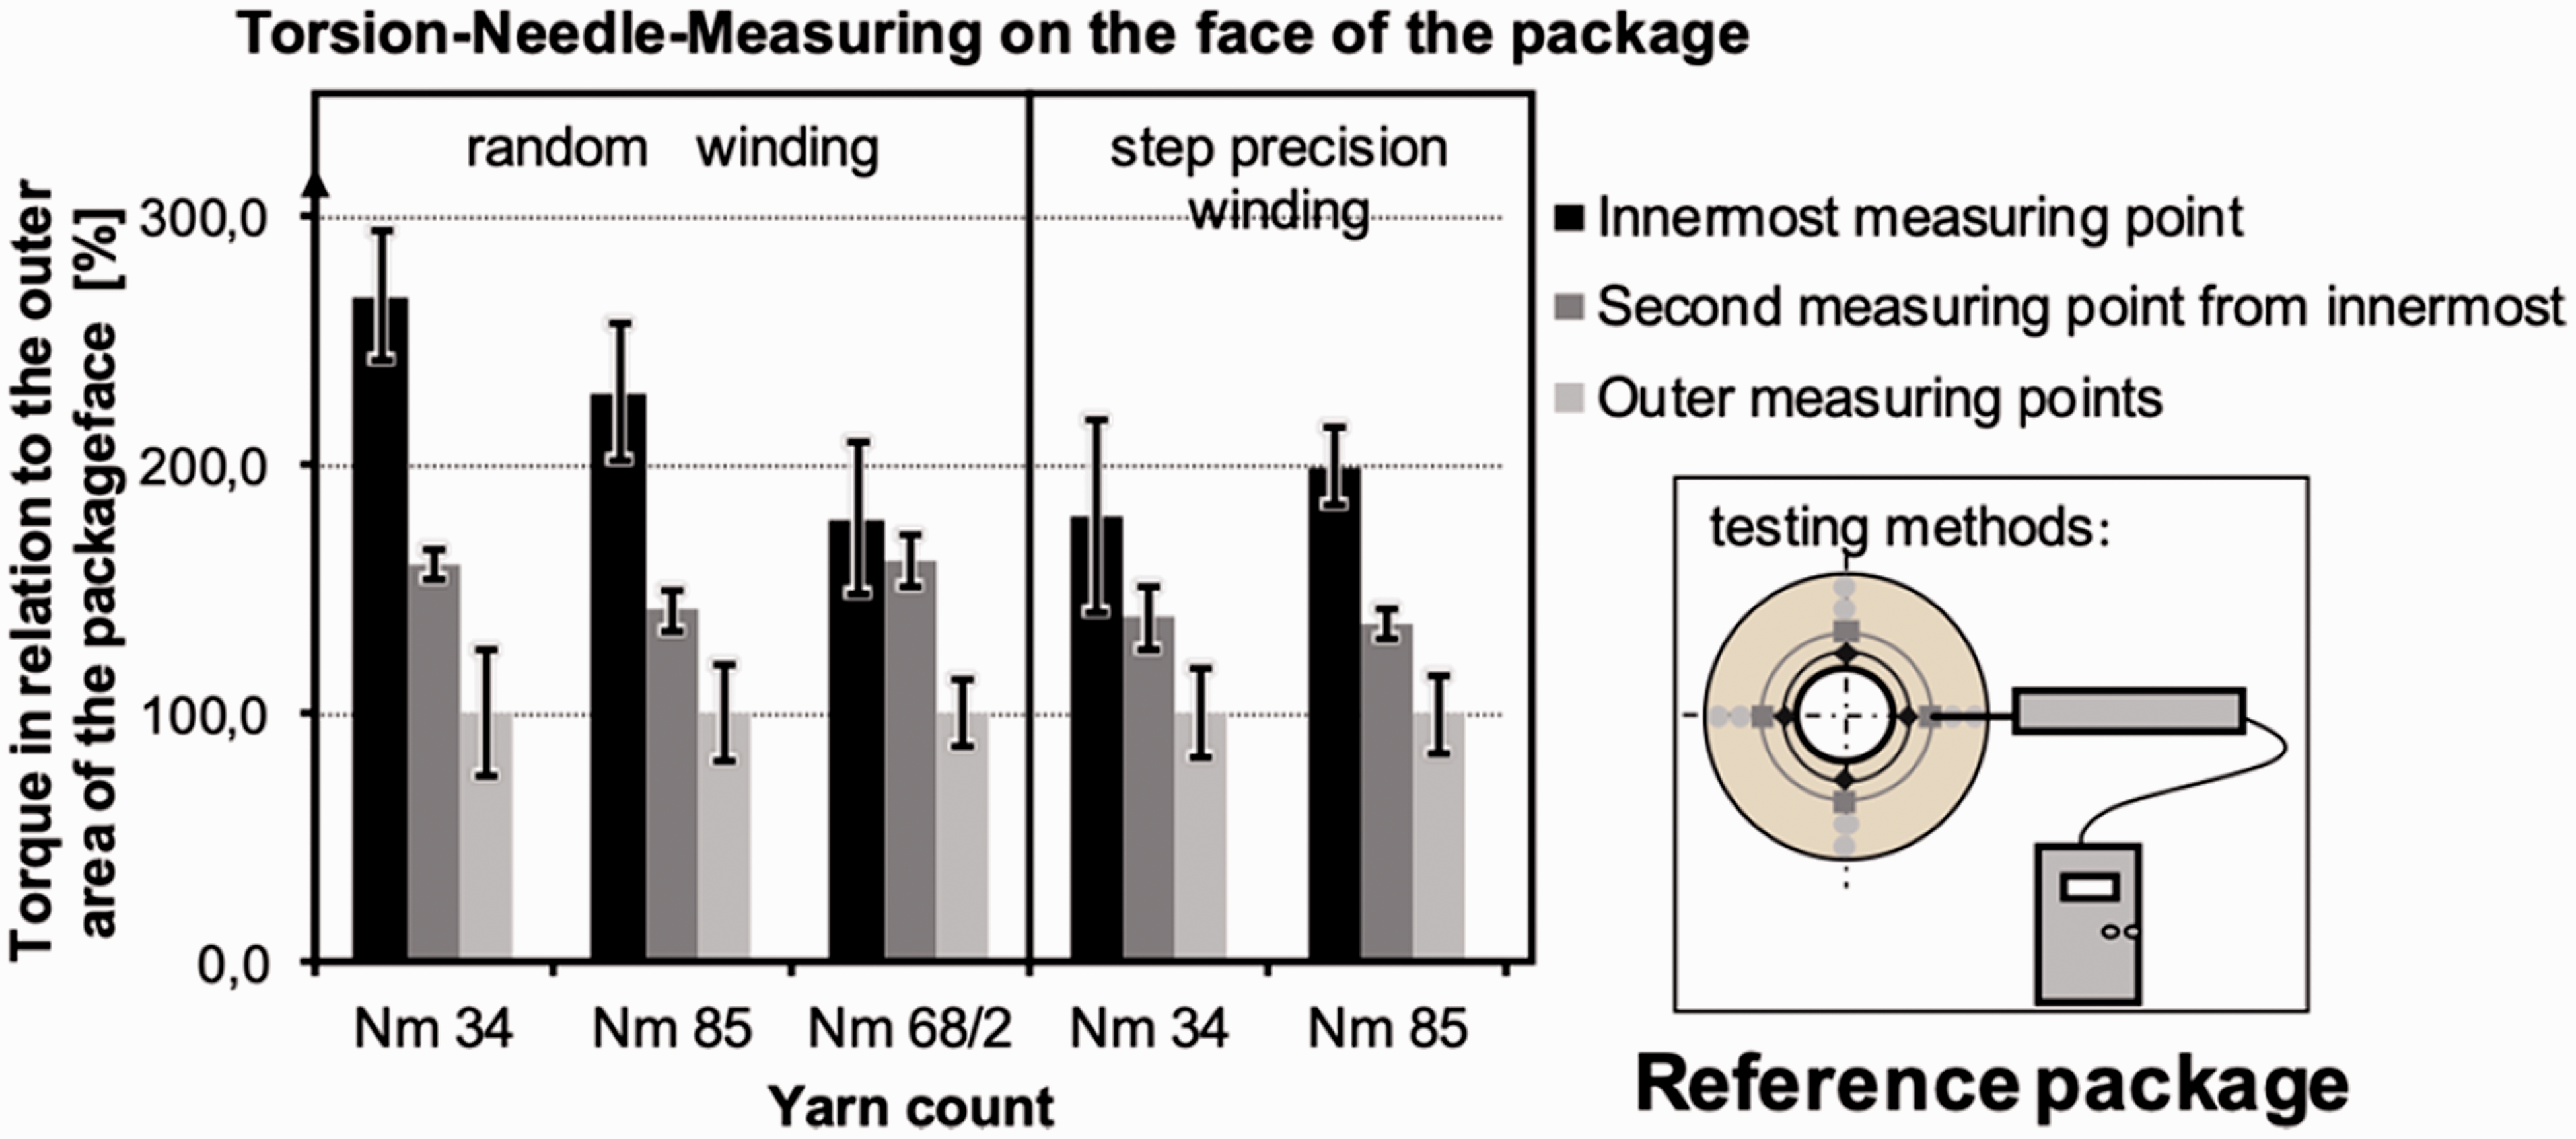
Torsion needle measuring on the face of the reference package.
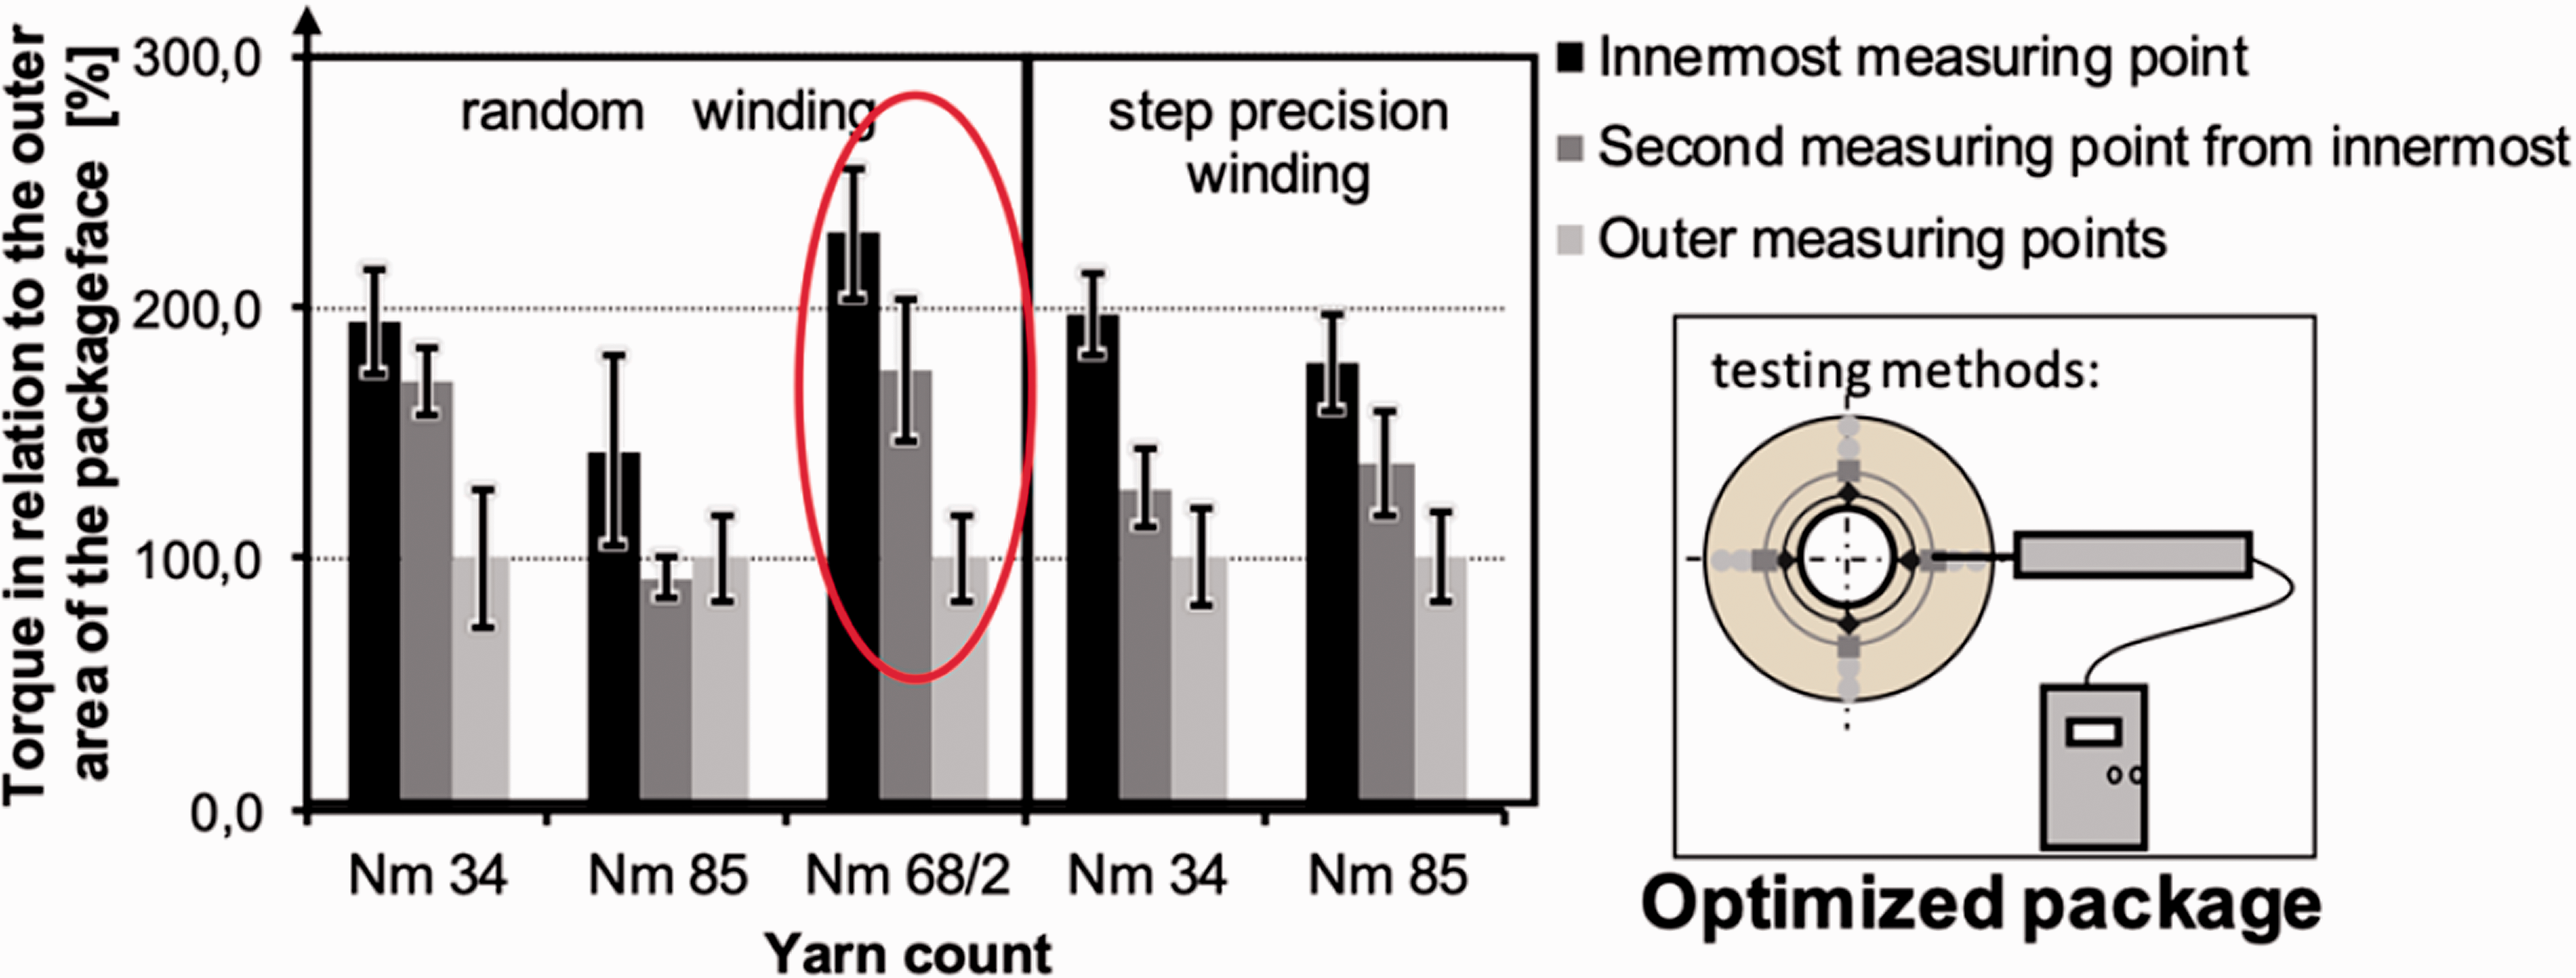
Torsion needle measuring on the face of the optimized package.
Reduction of color deviations
No uniform classification of color tolerance classes has been established in the industry. Color deviations of dE*<1 are often described as indistinguishable color differences. However, it should be noted here that the position-dependent color deviation in the color space does not directly correspond to the perceivable color deviation. The color deviations are evaluated using the classes shown in Table 3 based on Schläpfer. 44
Classification of color deviation
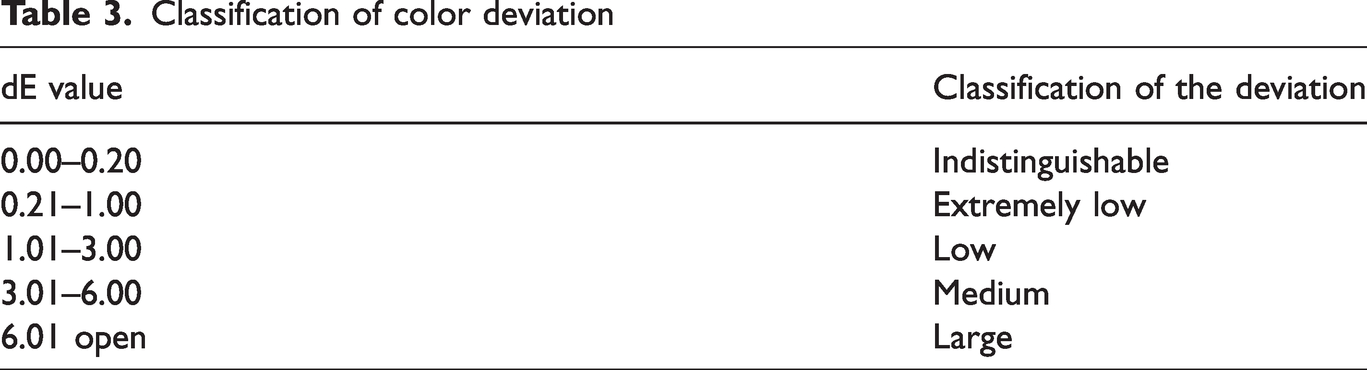
Figure 12 shows the color deviations for the test series of random winding at a yarn count of Nm 34. Here, the two darker columns correspond to the color deviation between the middle and inner knitting samples. The two lighter columns show the color deviation between the middle and outer knitting samples. The two left-hand columns represent the knitting samples from the reference packages and the two right-hand columns represent the knitting samples from the optimized packages. The color difference between the middle and inner knitting samples has been improved. The color difference could be reduced from the classification of a ‘low color difference’ to an ‘extremely low color difference’. The two-sample t-test under the assumption of equal variance with a confidence level of 95% shows a significant improvement in color deviation in the Nm 34 random winding test series. At the same time, the optimized package has a density 40 g/l higher than the reference packages.
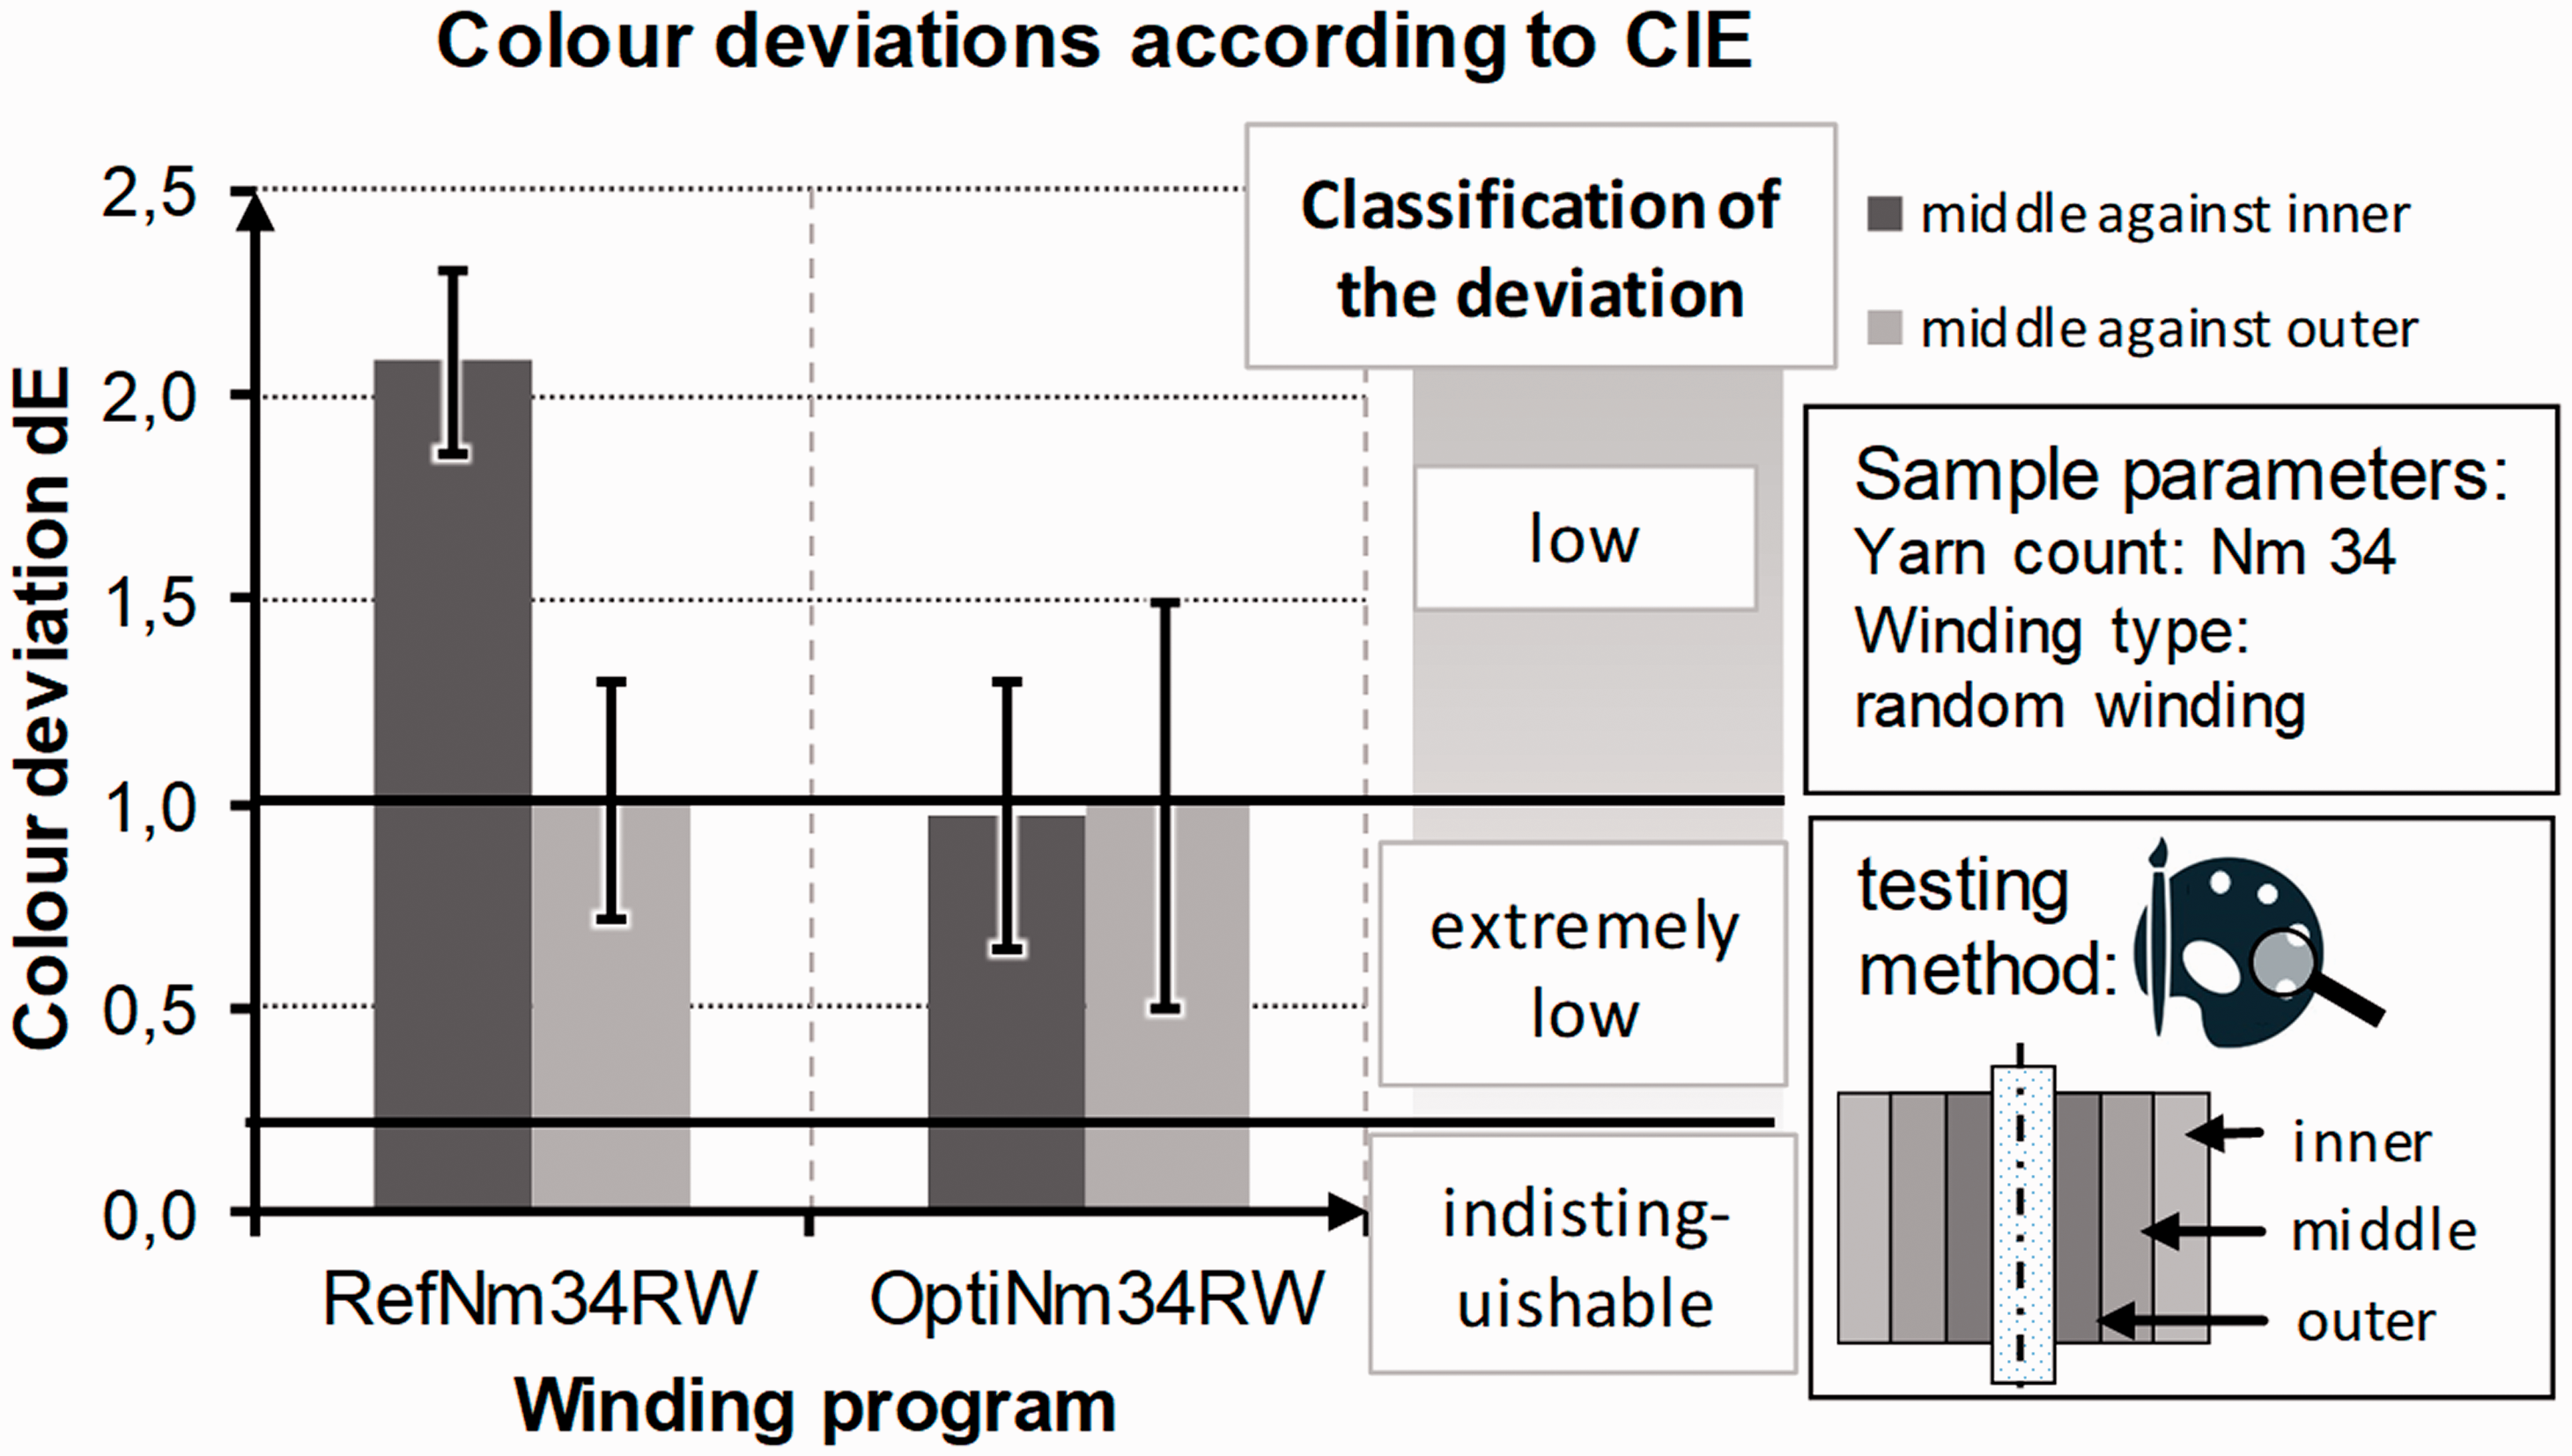
Color deviation in CIE L*C*H* color space of test series Nm 34 RW (random winding): reference package (RefNm34RW) and optimized package (OptiNm34RW).
In the test series of step precision winding with a yarn count of Nm 34, the color deviation was also significantly improved. Figure 13 shows that both the color deviation between the middle and inner knitting samples and the color deviation between the middle and outer knitting samples are reduced. On average, the color deviation between the middle and inner knitting samples was reduced by dE* = 0.728 and between the middle and outer knitting samples by dE* = 0.685. Furthermore, the classification of the color deviation was improved to ‘extremely low color difference’. The dyeing protocol of the reference and optimized packages in Figure 14 shows that the optimized package has lower flow resistance due to the more homogeneous density distribution, which leads to a lower pressure difference.
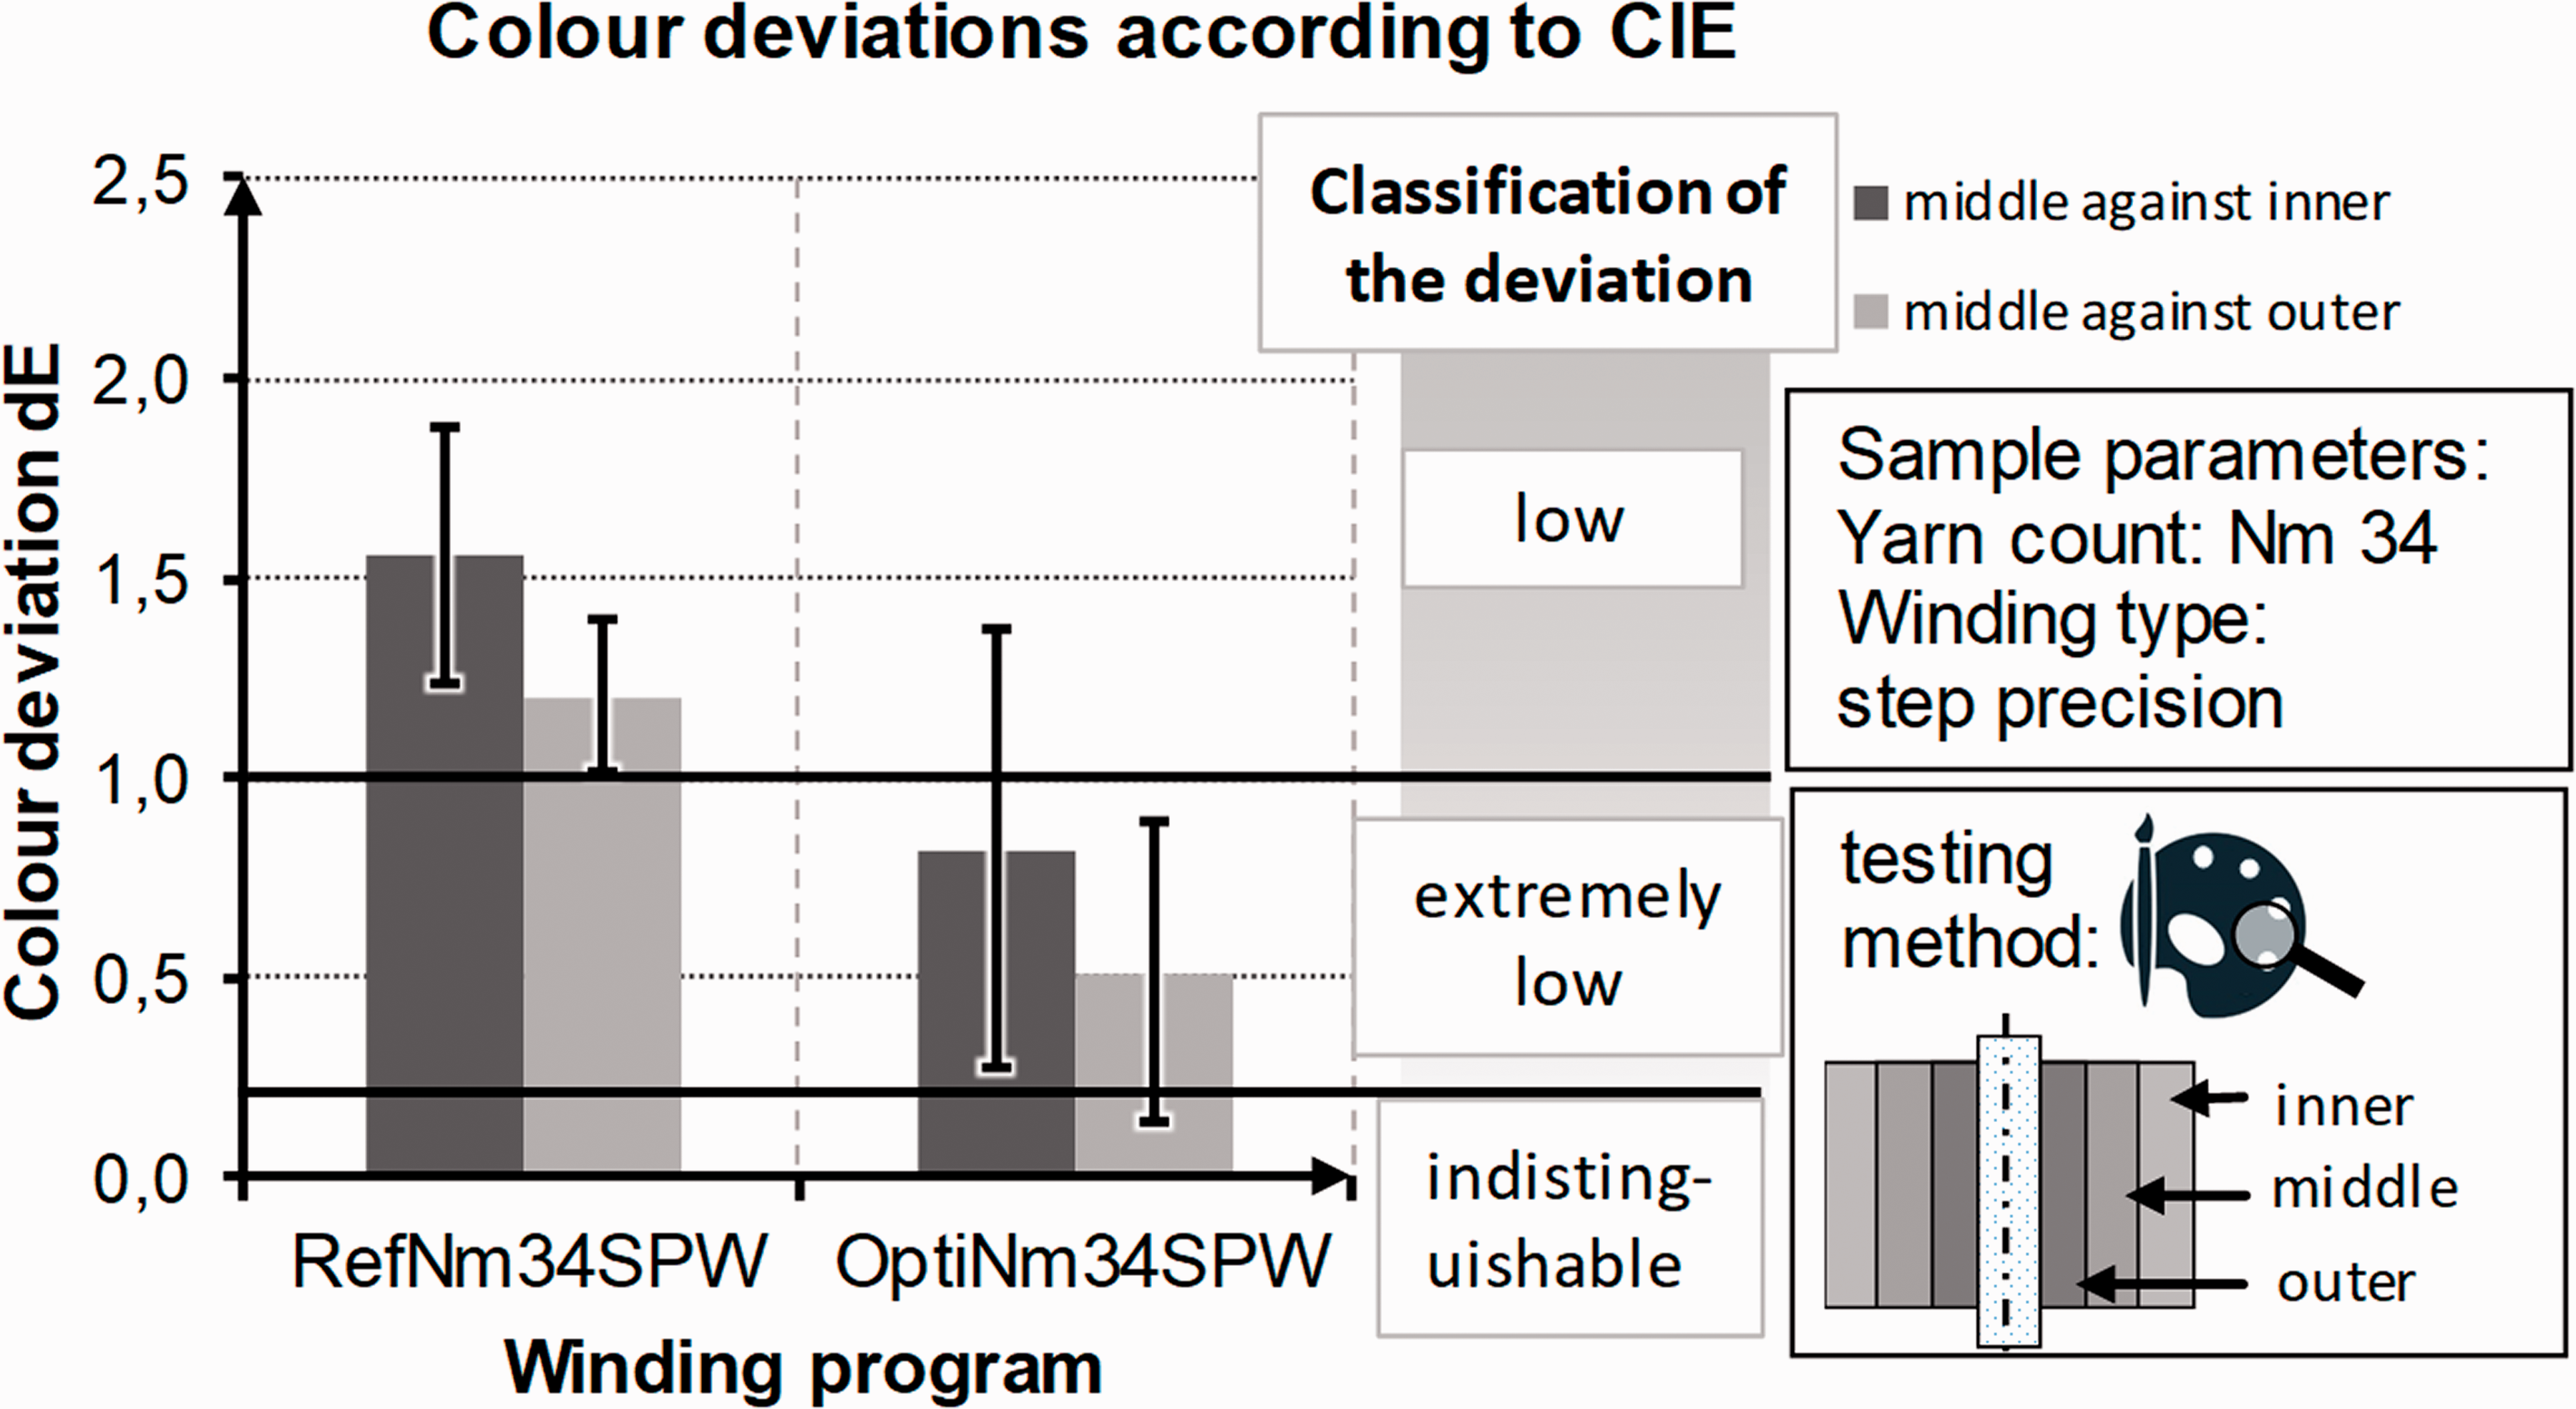
Color deviation in CIE L*C*H* color space of test series Nm 34 SPW (step precision winding): reference package (RefNm34SPW) and optimized package (OptiNm34SPW).
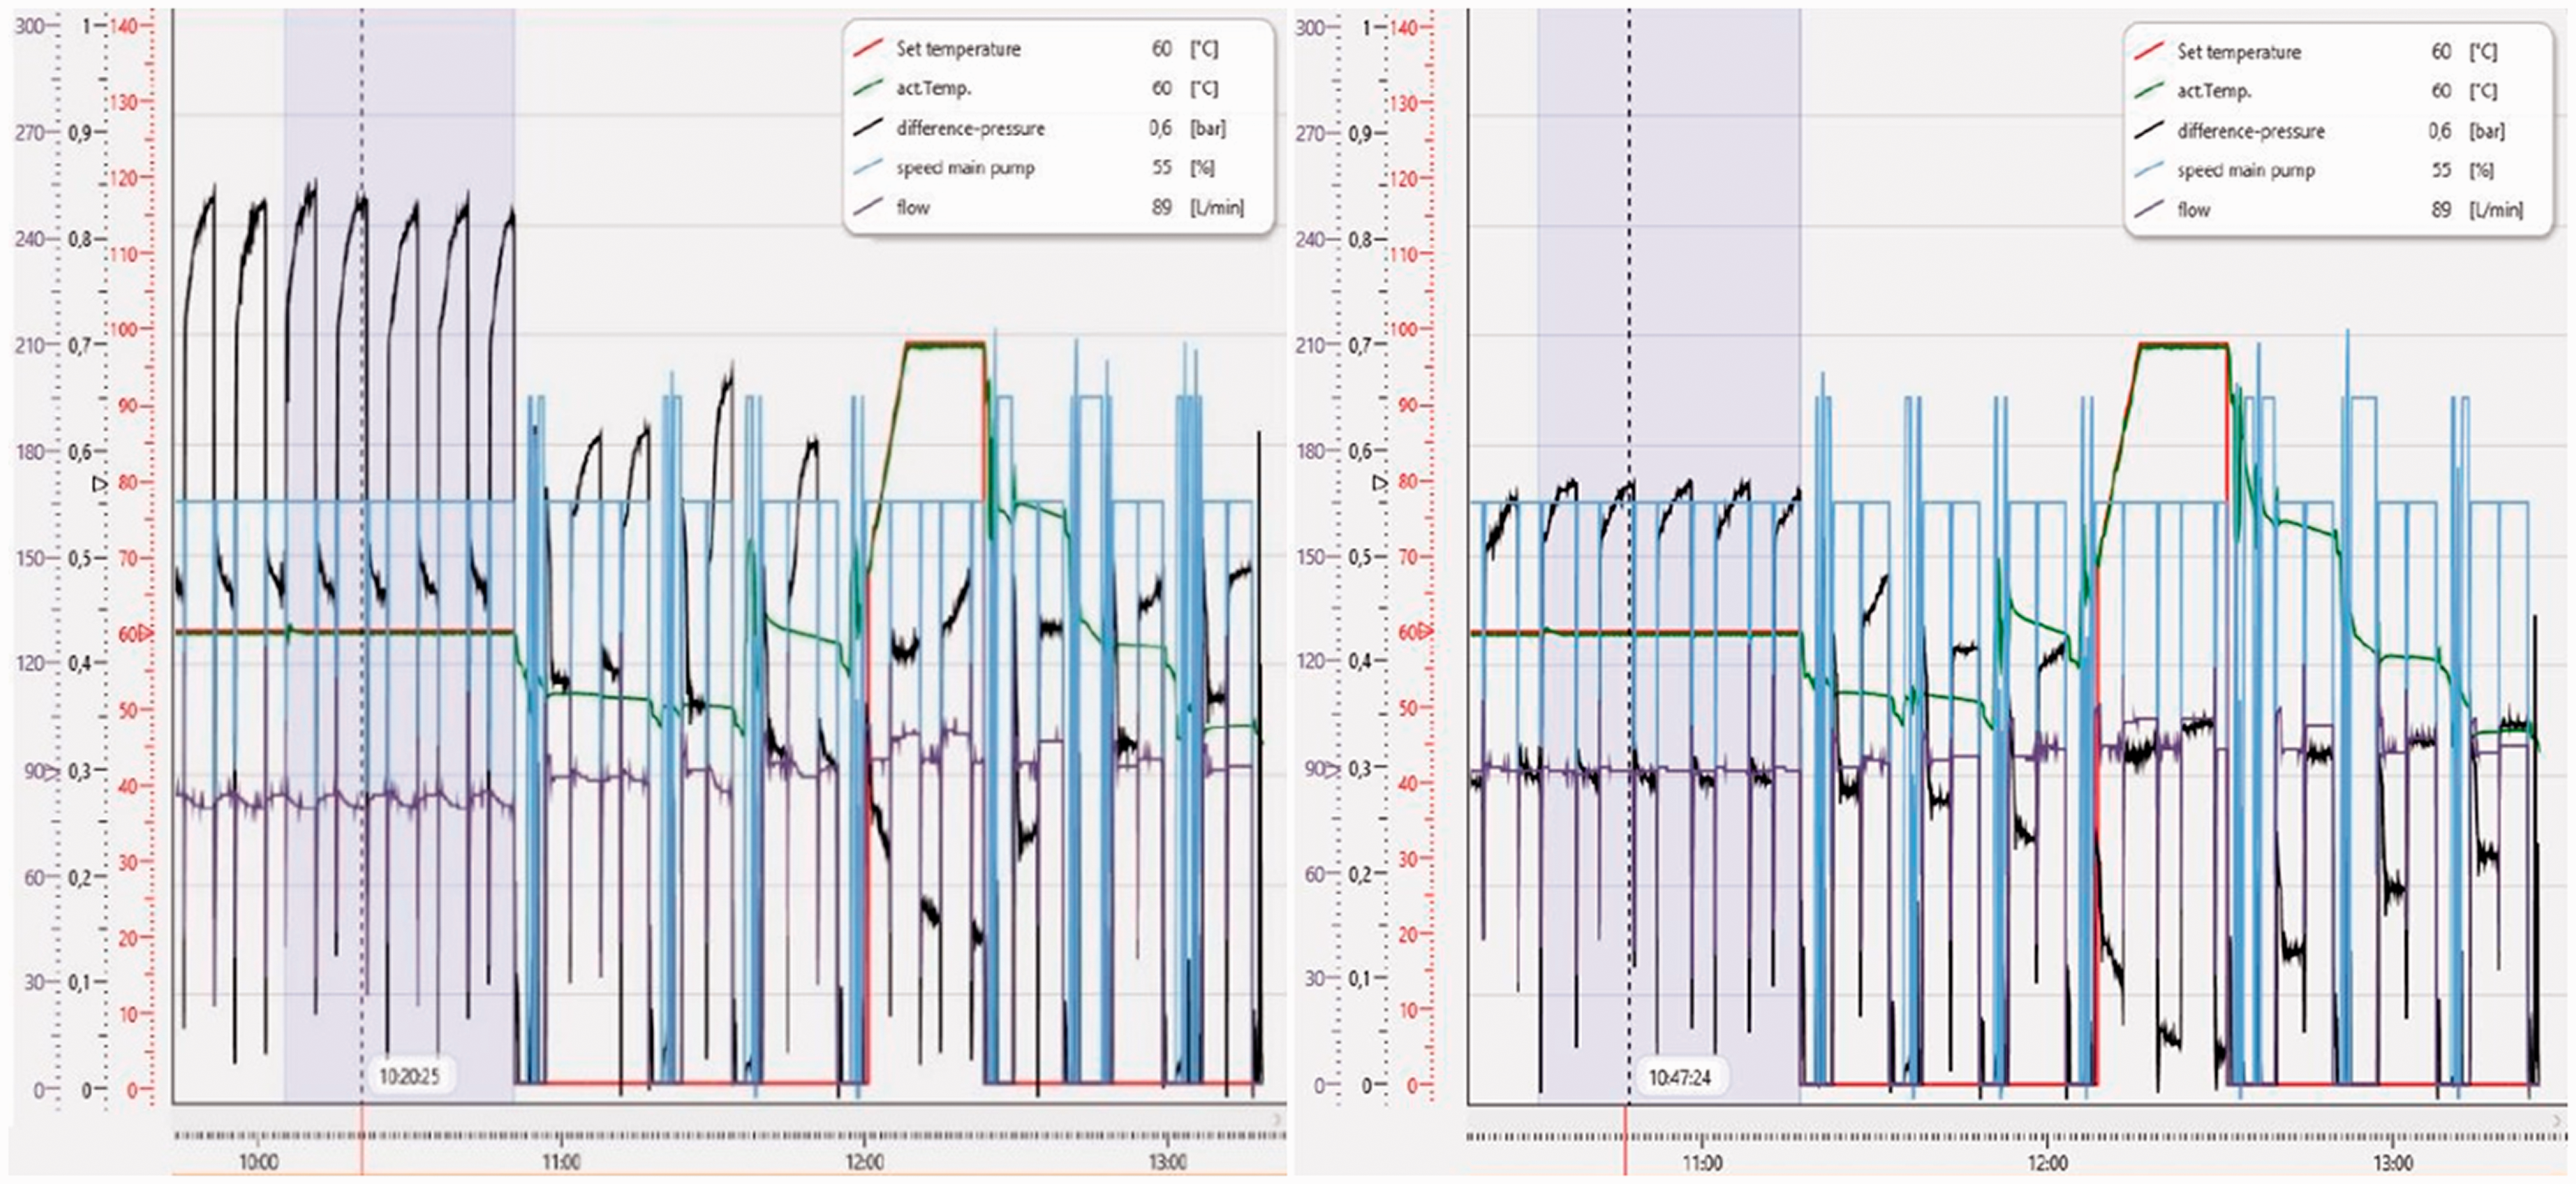
Dyeing protocol of reference package and optimized package for Nm 34 step precision winding (SPW). The optimized package has a lower flow resistance due to more homogeneous density distribution at similar total density, leading to a lower pressure difference.
The test series Nm 85 wound as random winding and step precision winding show no significant change in color deviation. The evaluation of the test series of the twist Nm 68/2 random winding even shows an increase of the color deviation. It is thus evident that the optimization algorithm for finer yarns requires improvement and must take other yarn constructions into account.
Conclusions
We have presented a simulation-based setting suggestion for yarn winding units. The simulation combines a geometric modeling of the yarn kinematics in a single layer, depending on process settings, with an empirical model for the diameter growth of the package with respect to yarn length. This allows us to model the complete package while providing local density distributions. In an optimization step, we use this simulation to find process settings that result in more homogeneous density, while providing a criterion to prevent local patterning defects. Setting suggestions were computed for RW and SPW programs. SPW has more degrees of freedom and thus more potential for optimization.
The setting suggestions for the automatic winding machine have significantly improved the color deviation for the heavy yarns (Nm 34). The color deviation dE* was reduced by approximately 36% for packages produced by random winding with a yarn count of Nm 34. The color deviation of packages produced by step precision winding with a yarn count of Nm 34 was reduced by approximately 51%. For the finer yarns (Nm 85), the use of the simulation-based settings had no influence on the color deviation. However, the color deviations for the knitting samples of the fine yarns were generally very small. Currently, the use of the optimization algorithm does not improve the color deviation in the dyeing of twisted yarn by package dyeing. The optimized settings increase the color deviations in the test series with the Nm 68/2 yarn, which might be explained by the optimization criterion used not being adjusted to the yarn: the optimization was performed with the same virtual layer thickness of 0.2 cm for all yarn types. Adapting this criterion to the different amount of filling of the layer corresponding to the yarn type may improve the results.
Fewer reference windings were available for the Nm 68/2 yarn to calibrate the empirical diameter growth model. For the Nm 68/2 yarn, only random winding packages were simulated and produced.
Footnotes
Declaration of conflicting interests
The author(s) declared no potential conflicts of interest with respect to the research, authorship, and/or publication of this article.
Funding
The authors disclosed receipt of the following financial support for the research, authorship, and/or publication of this article: This research project has been funded by the German Federal Ministry of Economic Affairs and Energy (BMWi) under a resolution of the German Bundestag, IGF project funding [19552 N].