
Abstract
In recent years, a large number of automatic equipment has been introduced into the chemical fiber filament doffing production line, but the related research on the fully automatic production line technology is not yet mature. At present, it is difficult to collect data due to test costs and confidentiality. This paper proposes to develop a simulation platform for a chemical fiber filament doffing production line, which enables us to effectively obtain data and quantitatively study the relationship between the number of manual interventions and other process parameters of the production line. Considering that the parameter research is a multi-factor problem, an orthogonal test was designed by using SPSS software and was carried out by using a simulation platform. The multiple linear regression (MLR) and the neural network optimized by genetic algorithm were adopted to fit the relationship between the number of manual interventions and other parameters of the production line. The SPSS software was applied to obtain the standardized coefficients of the multiple linear regression fitting and the neural network mean impact value (MIV) algorithm was applied to obtain the magnitude and direction of the impact of different parameters on the number of manual interventions. The above results provide important reference for the design of similar new production lines and for the improvement of old production lines.
Introduction
Doffing and transportation are an important part of the chemical fiber filament production. Foreign equipment and systems used for the doffing, transportation and storage of chemical fiber filaments are available on the market. The automated production line of Salmoiraghi, an Italian company, which includes multiple systems such as loading, unloading and storage, automated guided vehicle (AGV) transportation, and automatic inspection and storage, can basically realize the automation of chemical fiber filaments from doffing to warehousing. 1 The German company AUTEFA also conducted research on chemical fiber production lines, gradually realizing the industrialization of chemical fiber filament automatic doffing system. 2 China’s filament enterprises are characterized by a small scale, a low degree of automation and a large number of workers—about eight times that of other enterprises, therefore their international competitiveness is weak. 3 In recent years, some results have been achieved in the domestic research on the mechanical structure of automatic doffing equipment, 4 control system, as well as the automation of the whole process. At present, the chemical fiber production line has not yet achieved safe automated production and still needs to be equipped with some workers to assist production. The number of manual interventions is an important indicator of the degree of automation of the production line. The current key concerns of many companies is how to effectively reduce the number of manual interventions in the production line as well as the study on the relationship between the number of manual interventions and other factors of the production line.
At present, there are few studies on the process elements of the production line of chemical fiber filament automatic doffing system, mainly due to the difficulty in four aspects as follows: Firstly, in the chemical fiber filament production line, there are complicated processes with many elements. Conventional methods can only analyze qualitatively and cannot quantitatively calculate the multiple factors in the production line. Secondly, most of the filament enterprises are small to medium-sized enterprises, lacking data sharing between each other, therefore making it difficult to obtain production data for analysis of the production line. Thirdly, once the production line is put into use, it is difficult to change, so it is difficult to study the change of process parameters, and it is very difficult to collect data on site. Fourthly, the process analysis requires a large amount of data, and unfortunately data collection takes a long time and may even fail after several years in some working conditions. 5
The chemical fiber filament doffing production line is featured with complicated processes with many elements. 6 In the past, factories could only design qualitatively after years of experience, which can no longer meet actual needs. Salleh et al. 7 used Delmia simulation software to model and analyze the car seat decoration production line, and proposed a method to simplify the production line process, which could reduce the number of workstations and the idle time. This paper provides a scientific method for the study on the process of large-scale production lines. Firstly, the Unity3D simulation platform for the automatic doffing production line of chemical fiber filaments has to established. 8 The simulation platform can reproduce factory production and display the production status of the factory production line in three dimensions. After the simulated production is verified to be consistent with the actual production, the simulation test can be carried out. Next, a large amount of data is obtained via simulation using the platform, which reduces the cost of the production line application test and enables the collection of a large number of production data under different working conditions in a short period of time. Based on the obtained data, methods such as MLR and neural networks optimized by heritage algorithms are used to analyze the relationship between the process parameters of the production line. 9 Using design tests and data analysis, the degree of automation of the chemical fiber filament doffing system is improved from the perspective of process parameter optimization, which provides an important reference for the improvement of the degree of automation of existing production lines and the design of new production lines. 10
Simulation platform for automatic doffing of chemical fiber filament
The process analysis of chemical fiber filament doffing production line
The research object of this paper is the automatic doffing production line system of chemical fiber filament, whose structure layout is shown in Figure 1. It is mainly divided into two parts, the doffing area and the throwing area. The main parameters of the doffing area include the number of winding machines, the movement speed of the doffing robot, the alarm time and handover time of the winding machine. The throwing area mainly includes the throwing time of the throwing robot, the movement speed of the throwing robot, the connection between the two areas, and the capacity of the buffer area. The difference between the throwing time and the handover time is that the handover time is the time required for the robot to take away twelve spinning cakes and the throwing time is the time required for the robot to put the twelve spinning cakes into the creel.
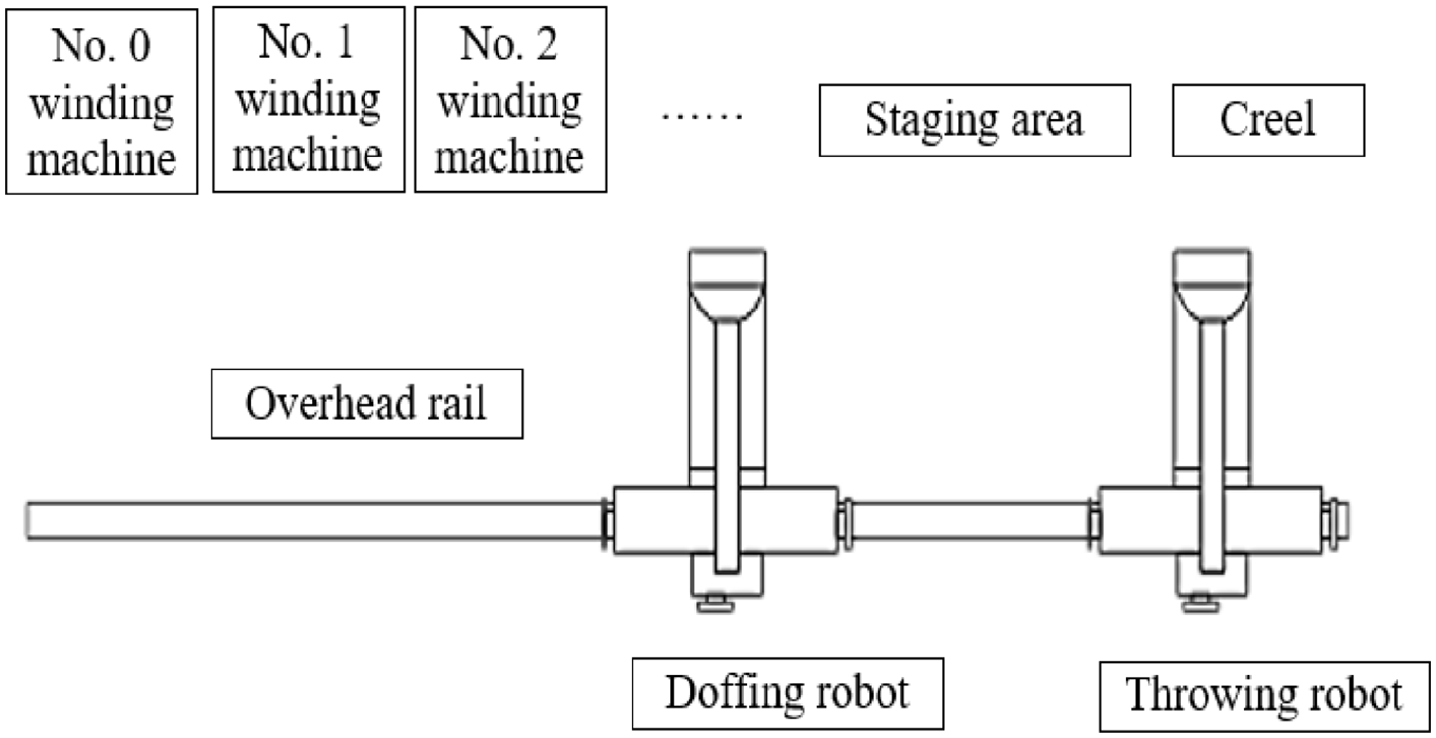
Automatic doffing production line system for chemical fiber filament.
During the robot doffing process, multiple doffing signals may be generated at the same time, however there are strict regulations on the doffing time. Under some working conditions, the robot may not have time to carry out the doffing. At this time, manual intervention is required, which number should be recorded. The number of manual interventions is an important indicator reflecting the degree of automation of the production line. How to effectively reduce the number of manual interventions and the study on the relationship between the number of manual interventions and other parameters are the current research priorities, which can provide an important reference for the design of new production lines and the adjustment of old production lines and has important economic benefits and social significance.
Establishment of simulation software platform for chemical fiber filament doffing production line
First, the scene was set up according to the production line parameters of the chemical fiber filament automatic doffing system in Figure 1. Solidworks software was used to draw the 3D scene. The 3D model of sat format was imported into the 3D design software—3D Max and then a file of fbx format was exported after being rendered and imported into Unity 3D. The layout of the scene is shown in Figure 2.

Working scene of simulation platform.
The model behind the simulation platform is meant to produce in sequence according to the actual production rhythm of the factory in Figure 3. Specifically, a predefined array is used to indicate the time of the winding completion signal (according to the spinning-in method and variety). The timer sends out the signal in turn according to this time to simulate the winding completion signal sent by the winding machine. The doffing robot should remove the bobbin before the window alarm time (according to the variety) reaches 0. If the robot fails to remove the bobbin in time, it will affect the normal operation of the winding machine. In order to avoid this, manual doffing is required when the doffing robot cannot take away the bobbin in time. In the production process, the bobbins are taken away in accordance with the time sequence of signal generation. The throwing robot removes the bobbins from the buffer area in the order that the doffing robot sends them into the buffer area. Next, the removed bobbins are placed on the empty creel. When the creel is full, the AGV trolley removes the creel and replaces it with an empty creel. When more than one robot needs to enter the buffer area, the robots work in the order of arrival. In other words, the robot that enters first works in the buffer area and the other robot waits outside. When there are no doffing, throwing or creel changing tasks, the doffing robot, throwing robot and AGV trolley should be on standby at the designated position.

Simulation platform software structure diagram.
After the scene is set up, the software part is divided into six modules according to different functions, namely the system master control module, the time module, the data module, the doffing robot and throwing robot module, and the database module. The SQL Server database is used as the storage medium. According to different storage contents, 11 data tables are established. The basic information required for platform operation and the data generated are all transmitted through these data tables. In the time and data modules, in order to reduce the complexity of the code, the functional modules with high usage rate are encapsulated. In the data module, 22 sub-functions for reading and writing each table of the database are encapsulated. In the time module, three sub-functions are encapsulated, which are the timing of the winding completion time of the spinning-in winding machine, the countdown of the remaining waiting time of the winding completion signal and the system timing, to perform timing operations on the master control module of the system. The background control of the simulation platform is realized by the master control module of the system, which is responsible for controlling the system running tempo and controlling the overall running status of the simulation platform. Its main functions include reading the production line information and arranging the simulation scene to generate a winding completion signal according to the spinning-in time, winding completion time and doffing limit waiting time of each winding machine, and count down the limit waiting time. In addition, it can release the doffing task according to the winding completion signal, the remaining waiting time and the current state of the doffing robot; release the throwing task according to the staging area, the yarn type and position of the creel and the state of the throwing robot; and store the key information during the operation of the simulation platform in the database. As for the doffing and throwing robot modules, after the doffing robot receives the doffing task, it will transport the spinning cake according to the robot collision avoidance strategy set by the simulation platform. After the throwing robot receives the throwing task, it will transport the spinning cake to the creel according to the robot collision avoidance strategy set by the platform. According to the software structure diagram, a simulation system for automatic doffing of chemical fiber filaments is established. After the platform is completed, the operating conditions of the platform are compared with the actual operating conditions to verify the accuracy of the operating process of the simulation platform.
Since the application of automated production lines is still very new, there are still many problems. One of the problems is that automated doffing cannot be achieved within the specified time sometimes. In order not to affect the normal operation of the production line, workers need to intervene and perform auxiliary doffing at this time. After the worker removes the bobbin, he puts it directly into the buffer area, which does not affect the normal working state of the production line, therefore the length of manual intervention does not affect the production of the production line. Moreover, the chemical fiber filament doffing production line is a continuous production and is sensitive to manual interventions. Therefore, the number of manual interventions is selected as an index to measure the automation degree of the production line. The reasons for the need for manual doffing are too many winding machines, overhigh doffing speed, machine failure or manual interference (for example, a worker appears on the planned path of the robot). We did not perform simulation in the case of machine failures and manual interferences, as they are uncontrollable accidental factors and our purpose is to study manual intervention caused by process parameters to optimize the parameters of the entire production line. At present, according to the actual situation of the factory, this paper defines the winding completion countdown time as 300 s. When the robot cannot take away the full bobbin in time within 300 s, the number of manual interventions is increased by 1.
Research on the relationship between multi-factor process parameters and the number of manual interventions
After the production line simulation platform is established, simulated production of the production line can be carried out. In terms of the reasonable design of test parameters, an orthogonal test was adopted to solve the multi-factor and multi-level problem in this study. 11 After completion of the test, based on the obtained data, the MLR and the neural network optimized by genetic algorithm were adopted to fit the relationship between the number of manual interventions and other parameters of the production line. The SPSS software was applied to obtain the standardized coefficients of the MLR fitting and the neural network MIV algorithm was applied to obtain the magnitude and direction of the impact of different parameters on the number of manual interventions. The above results provide an important reference for the relationship between production lines.
The orthogonal experimental design
The equipment layout of the production line and the value range of each parameter were obtained through on-site investigation of a chemical fiber production line. According to an analysis of the structure of the production line, there are seven main factors affecting the number of manual doffing, which are set as independent variables, and the number of manual interventions set as dependent variables. 12 This paper consists of seven independent variables (i.e. the number of winding machines, alarm time, movement speed of the doffing robot, movement speed of the throwing robot, buffer area capacity, handover time, and throwing time) and one dependent variable, which is the number of manual interventions.
For each variable, we selected nine values. The interval for the number of winding machines (8–72) is set to 8, the interval for the alarm time (210–450) to 30, indicating that the full bobbin needs to be taken away within the alarm time. The interval for the movement speed of the throwing robot (0.1–1.7) is set to 0.2, the interval for the movement speed of the doffing robot (0.1–1.7) to 0.2, and the interval for the buffer area capacity (5–13) to 1, the buffer area capacity indicates the number of bobbins which can be put in the buffer area between the doffing area and the throwing area. The interval for the throwing time (50–210) is set to 20, indicating the time to put the bobbin into the buffer area, and the interval for the handover time (20–44) to 3, indicating the time to take out the bobbin from the buffer area, as shown in Table 1.
Range of independent variables.

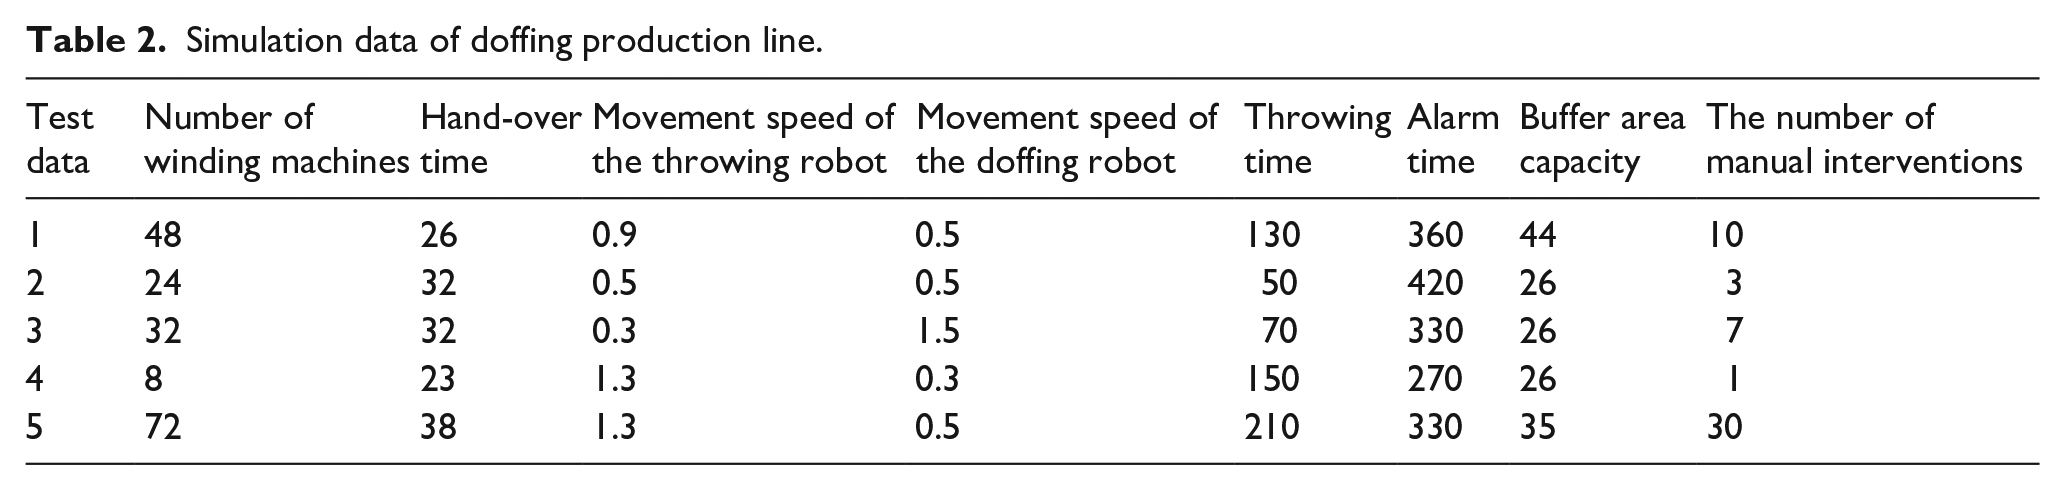
The above seven variables form a multi-factor and multi-level problem. A total of 97 tests need to be carried out to realize a full-scale test, which is obviously impossible to complete. Therefore, this paper used SPSS software to carry out orthogonal tests and selected some representative cases for tests, which could greatly reduce the number of tests. The values of the seven factors and nine levels in this paper were used to obtain 81 representative test parameters. The simulation platform system was used to perform tests to obtain the number of manual doffing. In the orthogonal test, there are 81 sets of test data which need to be simulated. This paper selects five sets of data for simple display as shown in Table 2.
Simulation data of doffing production line.
According to the orthogonal test designed by SPSS, the corresponding number of manual interventions under different initial conditions could be obtained after 81 initial parameters were substituted into the simulation platform. After using the simulation platform to obtain the data, MLR and an improved neural network algorithm are used to study the relationship between the number of manual interventions and other parameters.
Multiple linear regression model
Firstly, the partial correlation coefficient was used to analyze the relationship between the independent dependent variables. In this paper, there are seven independent variables (i.e. x1, x2, x3, x4, x5, x6, and x7) and one dependent variable y. When the independent variable remained unchanged, the relationship between each independent variable and the dependent variable was calculated, which was a sixth-order partial correlation coefficient。

The partial correlation coefficient was tested by the method of the t-test with a confidence level of 0.05. The SPSS software was used to obtain the partial correlation coefficients between the number of manual interventions and other variables. 13 The partial correlation coefficients are shown in Table 3, where x1 is the number of winding machines, x2 is the alarm time, x3 is the movement speed of the throwing robot, x4 is the movement speed of the doffing robot, x5 is the buffer area capacity, x6 is the throwing time, x7 is the handover time, and y is the number of manual interventions.
Partial correlation coefficients of variables.

If the significance value in Table 3 is less than 0.05, it is considered that there is a linear relationship between the independent variable and the dependent variable. According to the correlation analysis, there is a large linear correlation between x1, x2, x3, x4, x5, x6, and the dependent variable, so a MLR equation between the five independent variables and the dependent variable was established. The least squares method was used to estimate model parameters. For practical significance, the value of y should be 0 when it is less than 0 and it should be rounded up when it is a non-integer. 14

After establishing the MLR model, performing the test of goodness of fit, the significance test of the overall linearity of the equation (F-test), and the significance test of the variables (t-test) on the regression model.
In the test of goodness of fit (coefficient of determination), as shown in Table 4, R is equal to 0.832, indicating that the linear fitting effect is good. The Durbin-Watson, which ranges in value from 0 to 4, is used to test whether the residuals are independent of each other. A value close to 2 means that there is no obvious correlation between the residuals, that is, the residuals are independent. The results, as shown in Table 4, indicate that there is no significant correlation.
In the significance test of the overall linearity of the equation, the significance level α is set to 0.05., f = 3.1 and F = 33.645, as in the table of the textile industry. The result of the significance test is shown in Table 5.
In the significance test of variables, the statistics of t are constructed as follows.
Table of coefficient of determination.

Analysis of variance.

In the hypothesis testing, the significance is less than 0.05. The significance test of the variables is shown in Table 6.
Significance test.

The standardization coefficient is analyzed. In Table 6, B represents the coefficient in the regression equation, but a larger standardization coefficient does not mean a larger impact on the number of manual interventions. The standardization coefficient T represents the degree of impact of each parameter on the number of manual interventions. The parameters in a descending order of the impact on the number of manual interventions are respectively the number of winding machines, moving speed of the doffing robot, throwing time, buffer area capacity, and alarm time. The impact of different parameters on the number of manual interventions is of great significance. In preparing the construction of the new production line, the cost of changing is counted with different parameters, so as to achieve a high production capacity and automation degree at a low cost. As to the existing production line, the production line is adjusted by changing the parameters, so as to meet the new requirements. The effect of MLR is shown in Figure 4.

MLR diagram.
The difference between the MLR and the expected output can be seen in the above figure. The percentage error is the relative error multiplied by the percentage, which can effectively indicate the degree of difference between the data. The percentage error of the MLR method used in this paper is 8.83%.
Neural network prediction model optimized by genetic algorithm
The MLR model can provide the relationship between the number of manual interventions and other multiple factors, which has very important practical significance in the factory, but the error is 8.83% and the relationship between multiple factors is not a simple linear relationship. The neural network can independently learn the characteristics and change laws of the data through data training, and fit any function. In order to improve the fitting accuracy, this paper uses the neural network algorithm to fit the data.
Neural networks can be used for multivariate nonlinearity. The number of input layers is 7 and the number of output layers is 1. The number of hidden layers follows the formula
Two network models are used, that is, radial basis function (RBF) neural network and back-propagation (BP) neural network. 16 A total of 81 sets of test data are obtained through orthogonal tests, of which 71 sets are used for training and 10 sets are used for testing. The prediction effect obtained is shown in Figure 5 below. The percentage error of BP neural network is 8.64% and the percentage error of RBF is 4.94%.
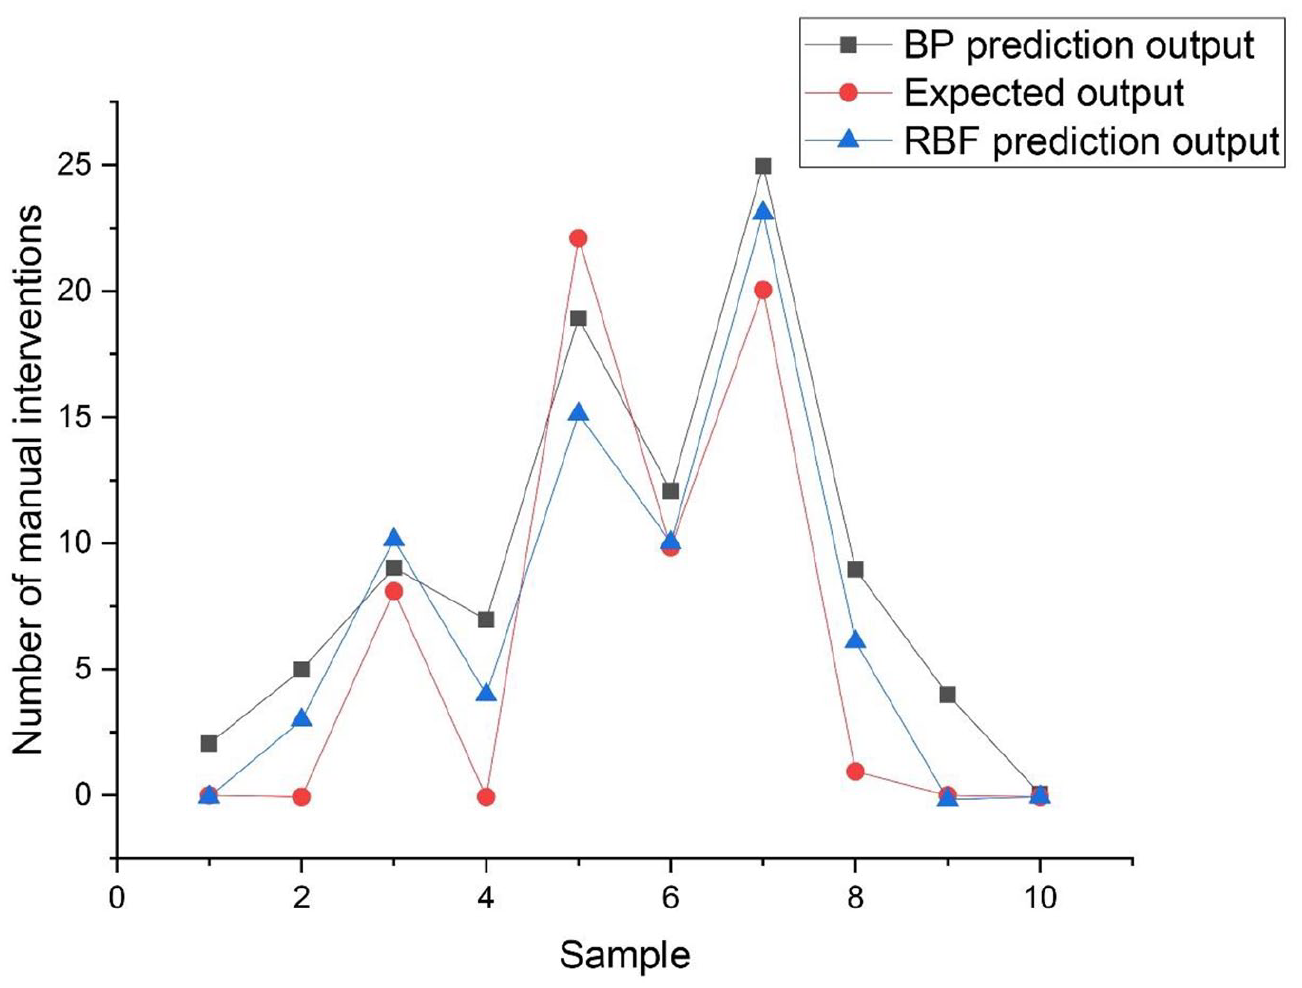
Neural network regression diagram.
The fitting error of the RBF neural network is 4.94%. It has been able to express the relationship between data very well, but this paper continues to use the neural network algorithm optimized by the genetic algorithm to improve the accuracy of the fitting, so as to better express the relationship between the number of manual interventions and other multiple factors. The flow chart of the neural network algorithm optimized by the genetic algorithm is shown in Figure 6.
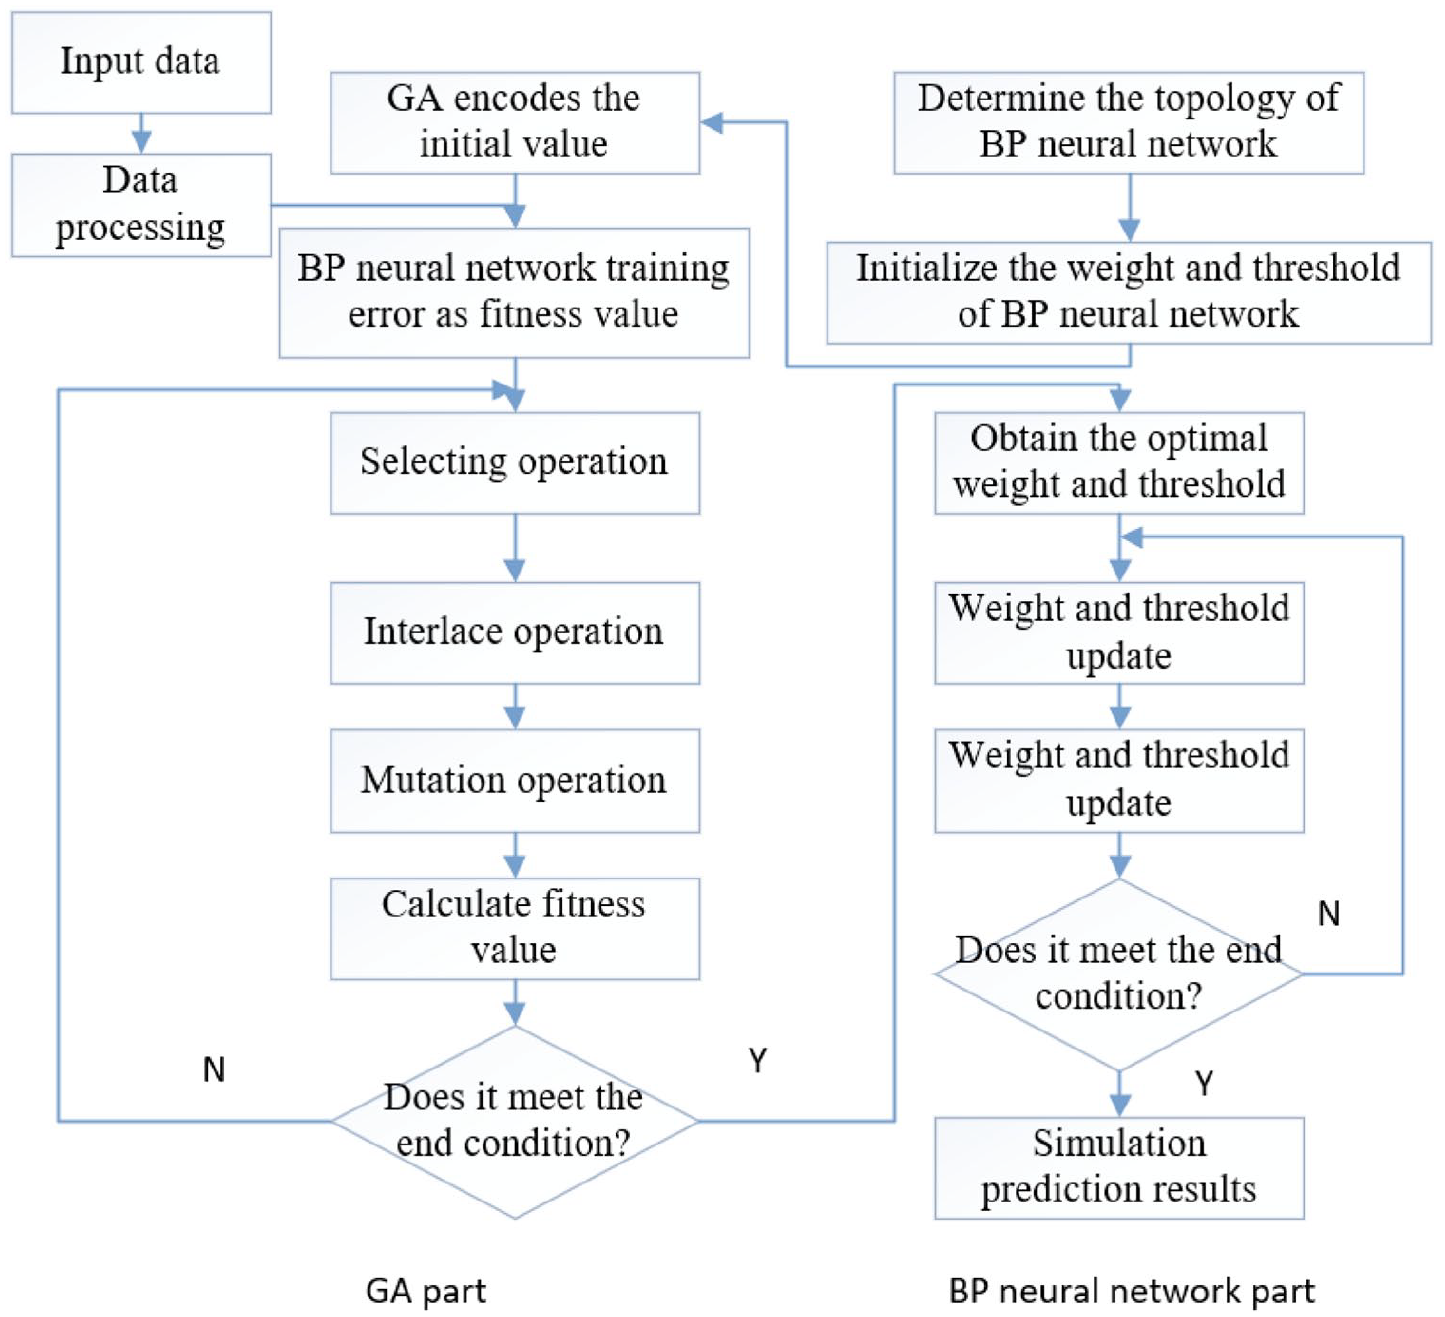
Flow chart of the neural network algorithm optimized by the genetic algorithm.
In Figure 6, the length of the individual genetic algorithm is determined according to the BP neural network structure. In the neural network algorithm optimized by the genetic algorithm, 17 each individual in the population contains the weights and thresholds of a network. The individual calculates the individual fitness value through the fitness function. The genetic algorithm finds the individual corresponding to the optimal fitness value through selecting, interlace and mutation operations. BP neural network prediction uses the optimal individual obtained by genetic algorithm to assign initial weights and thresholds to the network, and the network predicts the output of the function after training. 18
In this example, there are seven input parameters and one output parameter, so the set BP neural network structure is 7-5-1, which means that there are seven nodes in the input layer, five nodes in the hidden layer and one node in the output layer. There are a total of 7 × 5 + 5 × 1 = 40 weights and 5 + 1 = 6 thresholds, so the individual code length of the genetic algorithm is 40 + 6 = 46. The sum of absolute values of the training data error is regarded as the individual fitness value. A smaller individual fitness value indicates a better individual.

Where n is the number of training samples, yi is the expected output of the i sample of the neural network, oi is the predicted output of the i sample, and k is the coefficient.
The prediction effect of the neural network optimized by the genetic algorithm can be seen from Figure 7. The calculated percentage error is 3.17%, which can properly show the relationship between the number of manual interventions and other multiple factors.

Regression graph of the neural network optimized by the genetic algorithm.
The neural network algorithm can be used to effectively calculate the relationship between the independent and variable, but there is no clear expression. Because different companies have different business capabilities and regions, which lead to different requirements for production lines, many companies urgently need to know the impact of different parameters on production lines. The MIV algorithm is an important criterion for neural networks to evaluate the impact of input parameters on the output, and its magnitude represents the magnitude and direction of the impact on the correlation of the results. 19 The magnitude of absolute value of MIV represents the magnitude of impact on the result and the symbol represents the direction. The principle is as follows: (1). Each characteristic value in the sample is increased or decreased by 10% or a custom value in the simulation to obtain the simulation result. (2). The difference between the two simulation results is the change value of the impact of changing the independent variable on the output, namely the IV (Impact Value). (3). The IVs are averaged according to the number of observation columns to get the network output value of the input variable to the dependent variable. This method is used to calculate the MIV of each datum and sort it by the magnitude to get the sort of the impact of each datum on the result. 20 In this way, we can get the degree of impact of different parameters on the entire production line. The MIV of seven parameters is calculated by MatLab as follows in Table 7.
The MIV of seven parameters.
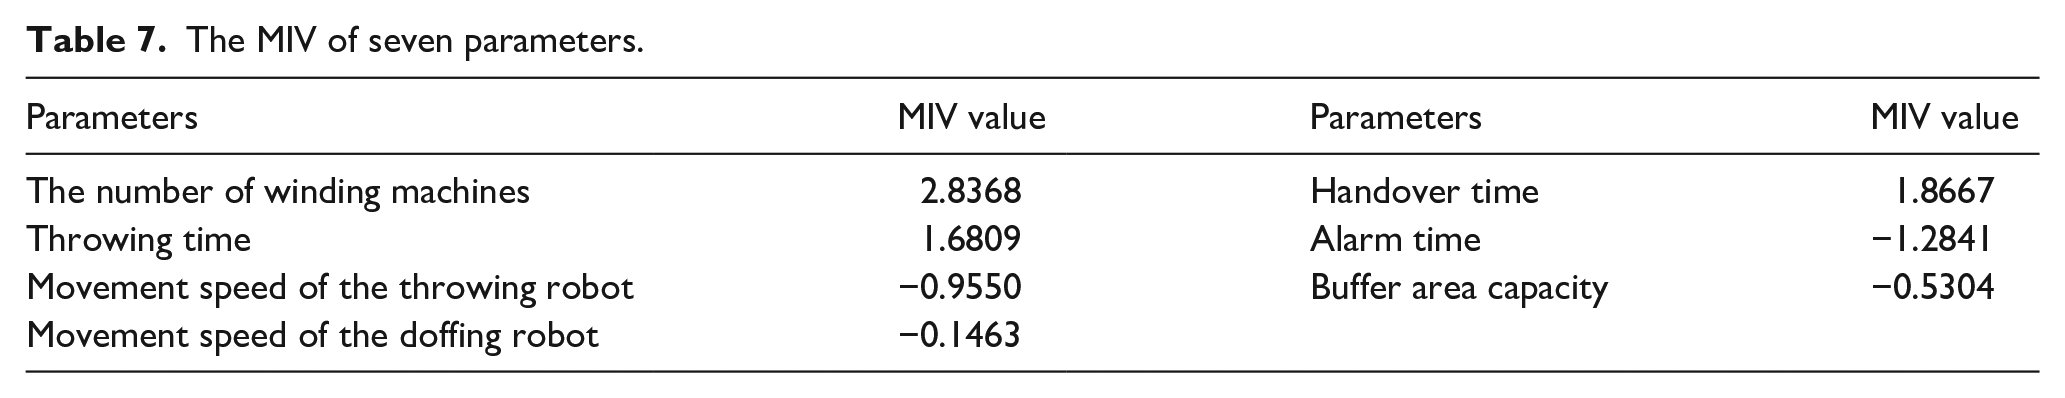
The parameters in a descending order of the impact on the number of manual interventions are respectively the number of winding machines, handover time, throwing time, alarm time, movement speed of the throwing robot, buffer area capacity, and movement speed of the doffing robot, from which we can see the degree of impact of different parameters on the entire production line. Among them, the number of winding machines has the largest impact on the number of manual interventions.
The influence degree of different parameters of the production line on the number of manual interventions can be obtained through calculation. According to the order of the influence degree, the parameters can be selectively modified in the design of the production line. Changing the number of winding machines is the most effective way to reduce the number of manual interventions, but this parameter is basically determined at the beginning of the production line design and is not easy to modify. Another effective way to reduce the number of manual interventions is to adjust the throwing and doffing time. When all the seven parameters are set at a value prone to causing manual interventions, the total number of manual interventions required at this time is 33. Through the calculation of the neural network algorithm optimized by the genetic algorithm, we can get the influence of different process parameter changes on the number of manual interventions. When the number of winding machines is reduced by 50% from 72, the number of manual interventions will be reduced by 42%. When the throwing time is reduced by 50% from 210s, the number of manual interventions will be reduced by 27%. When the doffing time is reduced by 50% from 44 s, the number of manual interventions will be reduced by 25%. When the alarm time is reduced by 50% from 210 s, the number of manual interventions will be reduced by 18%. Changing the throwing time can effectively reduce the number of manual interventions. At present, some manufacturers have begun to turn the original one-handed throwing of the robot into two-handed throwing of the robot, which can shorten the throwing time by half, effectively reducing the number of manual interventions and improving the automation of the production line.
Conclusions
Through the establishment of a simulation platform for the chemical fiber filament doffing production line, the time cost and technical cost of the test can be effectively reduced. The purpose of our research is to study the relationship between the process parameters of the production line and the number of manual interventions in order to improve the automation degree of the production line. We provide the following three research methods: First, according to the actual working conditions, a simulation platform for the chemical fiber filament doffing production line was developed. Using the platform, we can simulate the number of manual interventions under different parameters, so as to perform process optimization in the laboratory. In addition, considering that this test is a multi-factor and multi-level problem, data on some process parameters and the number of manual interventions are obtained by designing an orthogonal test. The specific quantitative relationship between different process parameters and the number of manual interventions can be obtained through multiple linear regressions, which can guide on-site workers to optimize process parameters. In view of the low accuracy of multiple linear regressions, the neural network optimized by genetic algorithm is used to fit the relationship between the process parameters of production line and the number of manual interventions, which can effectively improve the prediction accuracy, effectively guide on-site workers to optimize process parameters and reduce test cost and difficulty.
At present, a large number of automatic equipment has been introduced into the chemical fiber filament doffing production line, but the research on the process of the automatic production line is still immature. The main reason is that it is basically difficult to collect data on site, a simulation platform for the chemical fiber filament doffing production line is developed according to the actual operating conditions on site. The relationship between various process parameters can be conveniently studied through the simulation platform. This paper focuses on the relationship between the number of manual interventions and other parameters of the production line. In order to solve this multi-factor and multi-level problem, SPSS software is used to design orthogonal tests and a simulation platform is used to obtain data. The multiple linear regression and the neural network optimized by genetic algorithms are used to fit the relationship between the number of manual interventions and other parameters. In order to specifically indicate the direction and magnitude of the influence of different parameters on the number of manual interventions, the standardized coefficients of multiple linear regression and the MIV value of the neural network are calculated to provide an important reference for the design of new production lines and the optimization of old production lines.
The influence of different parameters on the number of manual interventions is obtained through the standardized coefficient of multiple linear regression and the MIV algorithm of neural networks. Both methods show that the number of winding machines is the most important factor affecting the number of manual interventions. In addition, the two methods basically have the same results about the impact of other factors on the number of manual interventions. Therefore, the most effective method to reduce the number of manual interventions is to reduce the number of winding machines. However the number of winding machines is generally fixed, so we should focus on changing the throwing time. Some companies have made improvements in this area by turning the original single-robot throwing into double-robot throwing, so that the throwing time will be cut by half and the automation of the production line will be effectively improved. In addition, according to the site, layout, capital, labor and other different conditions of the factory, parameters such as throwing time, buffer area capacity and robot movement speed can be adjusted to optimize the design of different production lines.
Footnotes
Declaration of conflicting interests
The author(s) declared no potential conflicts of interest with respect to the research, authorship, and/or publication of this article.
Funding
The author(s) disclosed receipt of the following financial support for the research, authorship, and/or publication of this article: The study was supported by The National Key Research and Development Program of China(2017YFB1304000)