
Abstract
Porosity is one of the most important properties of textile materials that ensures their comfort and usability. The internal pore structure of the cotton fiber assembly is complex and changeable, surface pore is difficult to explain its pore structure. It is intended to develop a method to predict the pore morphology of cotton fiber assembly. Pore image of the multi-layer fiber assembly is collected by a fiber photography instrument, used the Image Pro Plus 6.0 software to analyze, and obtained the white area indicators of image which can be applied to describe void space of fiber assembly. Using multiple linear regression analysis method, the regression equation of the white area index of image and porosity index of cotton fiber assembly is established. The results indicate that the white area index can largely be explained by three pore index namely the porosity ε, mean length of fiber between the adjacent contacts B and fiber tortuosity coefficient. Appropriate regression equations can be formulated for the pore of white area index which can aid in predicting the pore texture. Comparing the data indicators, it is found that mean length of fiber between the adjacent contacts B and the porosity ε, fiber tortuosity coefficient τ, and air permeability q have good linear correlation.
Introduction
Fiber materials is an important textile raw materials. Most textile products such as clothing materials and nonwoven can be considered fiber assembly made of fibers and air filling in the pores formed by the fibers. The structural features of a fiber assembly is an important subject for extensive investigation in textile science. 1 There has been many experimental and numerical studies on the properties of random fiber assembly. 2
Characterization of void space within fiber material may be significant for its mechanical and thermal properties. Although amount of void space of fiber assembly is easily determined in terms of porosity, which is complicated by its arrangement in the structural characterization of the void space. The porosity of fiber assembly is largely dependent on the relative amount and orientation of fiber. 3 The porosity is defined as the percentage of volume of voids among the fibers when they are held in bulk to the overall fill volume. The porosity of fiber assembly is calculated as: 4

where ε is the porosity of fiber assembly (%), m is the mass of fiber assembly (g), ρ is the fiber density
(g/cm3), V is the volume of fiber assembly (cm3). Fiber volume fraction of fiber assembly is calculated as:

where Vf is the fiber volume fraction (%), D is the fiber diameter (mm), L is approximate to the total fiber length in the unit volume (mm).
For studies of the properties of the fiber assembly, it is fundamental first to quantitatively investigate its microstructural features. In a fiber assembly system with random distributed fibers, number of fibers, orientation, and volume fraction are important physical parameters of the fiber assembly. Pan 5 showed a assumption that all fibers were bonded through contact points, and the fiber assembly consisted of the contact points between fibers, the mean fiber length between the contact points, and the void space enclosed by the contact fiber. The mean contacts per unit fiber length is calculated as:

where K is the mean contacts per unit the fiber length (pcs/mm). The mean length of fiber between the adjacent contacts is calculated as:
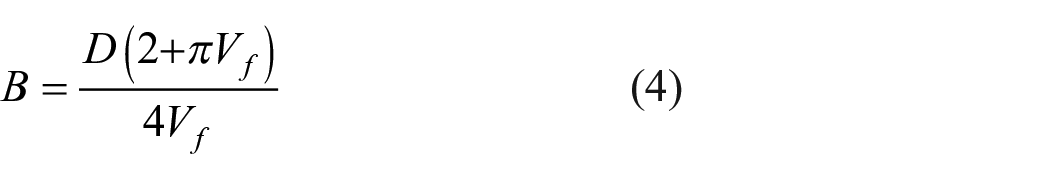
where B is the mean length of fiber between the adjacent contacts (mm). K and B can be applied to calculate the microstructural characteristics of fiber assembly, and can also be applied to describe pore parameters of the fiber assembly.
The complex structure of the pore space of fiber assembly results in the transported fluid following a tortuous path, the path which is quantified by the tortuosity factor. Higher tortuosity factor indicate that the transported fluid has to follow a longer and more complicated path, has a significant impact on its permeability property of porous media. Vallabh et al. 6 introduced that tortuosity factor had expressed as a function of porosity of fiber assembly. And relationships between tortuosity factor and porosity, fiber diameter, and thickness of fiber assembly had been established for a statistical model. Based on the experimental data of permeability, Vallabh et al. 7 showed an empirical model was found to be in good agreement with computational models. The empirical model is defined as in equation (5):

where τ is the tortuosity factor, x1 is the fiber assembly thickness (mm).
In order to evaluate pore characteristics, the structural parameters of fiber assembly must be provided, then it is difficult to measure its structure size. This study intend to develop a method to predict the pore morphology of cotton fiber assembly (CFA). In this scope, a pore feature on the base of image processing techniques will be generated. Thus, a novel model that has high potential for adaptation to the cotton fiber assembly for research and analysis is proposed.
Materials and method
Materials
Seed cotton was supplied from the family of cotton growing in china, then it was gined into raw cotton. The density of cotton fiber is 1.14 g/cm3. 8 The length and fineness index of raw cotton was detected by USTER® high voIume instrument (HVI) 1000. The test results shows that the average diameter of cotton fiber is 17.3 µm, and the average length of the upper half of cotton fiber is 28.8 mm.
Preparation of samples
Raw cotton was processed by opened, cleaned, and carding which was converted into a card web. The card web of cotton was cut into a single-layer test sample with 35 mm length and 25 mm width. Single-layer sample was stacked layer by layer for multi-layer test samples. The samples were sorted according to number of layer, labeled as the 1#, 2#, 3#, . . . 10#. For example, 3# sample consists of three layers of single-layer sample. For each kind sample of experiment, 10 pecs were conducted, their mean mass: for 1#, 0.0154 g; for 2#, 0.0294 g; for 3#, 0.0448; for 4#, 0.0616 g; for 5#, 0.0763; for 6#, 0.0924 g; for 7#, 0.1114; for 8#, 0.1201 g; for 9#, 0.1413; for 10#, 0.1591 g. In order to prevent movement or slippage, the sample was placed between two specimen glass which was fixed by two clamps (see Figure 1). The sample thickness was measured by adopting the slide gauge with precision of 0.01 mm, defined as x1.
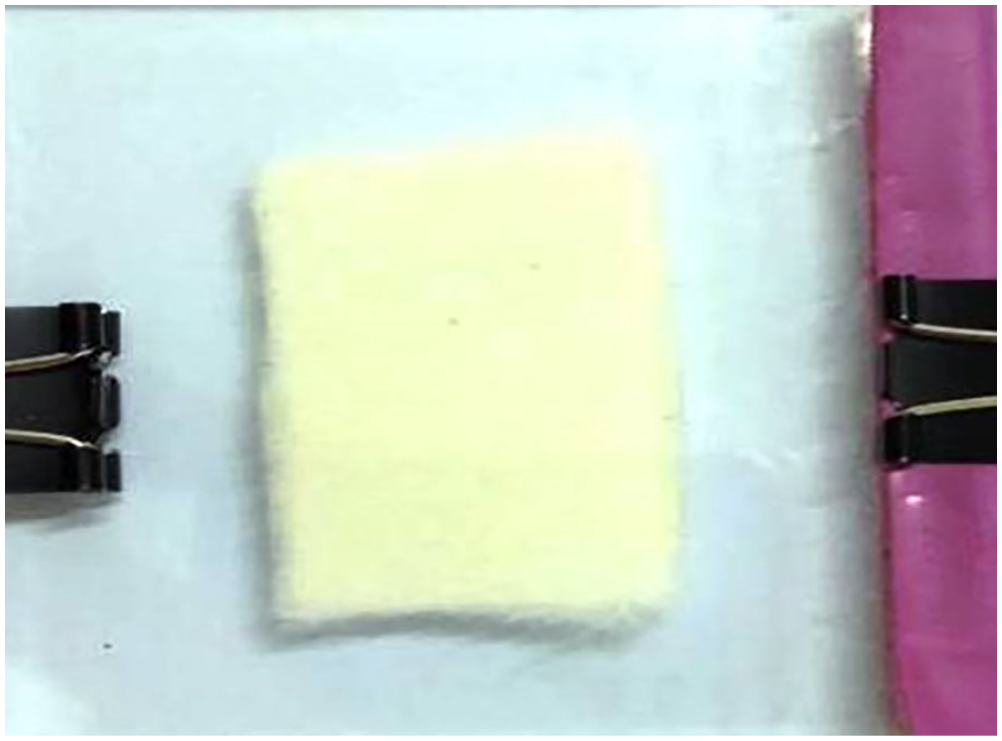
The sample of CFA.
Pore observation
Fiber photography instrument consists of a fully automatic optical microscope with supplementary light device, digital camera, and computer (including software). The microscope magnification is 40×, and the objective lens is equipped with an achromatic, semi-planar device. The digital camera and microscope are converted into a whole machine, and the image is transmitted to the computer by the data line.
The sample with held by glass plate was placed on the observation table of a fully automatic optical microscope, adjusting focal length between microscope lens and sample so that the amount of light intensity passed through the sample which could be detected. 9 The images were captured perpendicular to the focal plane of the digital camera. To produce a reliable texture feature data, 50 images with the size of 800 × 600 in JPEG format were acquired from different parts of each samples. To avoid possible bias in light intensity during image capture and to ensure the accuracy of measurements, image brightness was normalized to background levels.
Measure sample pore size
Image Pro Plus software (produced by Media Cyber-netics Corporation, USA) is image analysis software capable of taking information obtained from a photograph. This software can collect intensity data for entire images or an area of interest.
In the digital image, the black filaments are cotton fibers, the white areas represents the voids between cotton fibers. Pores of fiber assembly were selected as white area (AO) for measurements. All digital images were analyzed by using image analysis software Image Pro Plus 6.0. Using Image Pro Plus, the digital images are changed to grayscale digital images to calculate the area and number of AO. 10
Total pore area
The pore area is the total area of AO of the digital images, it is defined as x2.
Number of pore
The number of pore is number of AO of the digital images, it is defined as x3.
Average pore area
The average pore area is equal to x2/x3, it is defined as x4.
x1, x2, x3, and x4 as the AO index could be constructed a comprehensive system for the digital images information.
Measure sample air permeability
To reveal the relationship between the fiber assembly and air permeability performance, air permeability tests were performed on the sample. All samples were conditioned in the atmosphere of 20 ± 5°C and 65 ± 5% relative humidity before the air permeability tests were performed. Air permeability tests were performed by YG461D Digital Air Permeability Tester (China, Wenzhou Darong Textile Instrument Company) at 100 Pa pressure drop and Ø21.6 mm test area.
Results and discussion
Pore morphology of fiber assembly
The pore images of all samples are selected from multiple images, as shown in Figure 2. Figure 2 shows that intersecting, parallel, and overlapping fibers form the pores of the fibers. Fraction of the bending, straightening, and slipping fiber are difficult to calculate. Cotton fibers arrangement and orientation are obviously irregular arrangement, and formed an overlapping network.

Microscope images of different layers CFA: (a) 1#, (b) 2#, (c) 3#, (d) 4#, (e) 5#, (f) 6#, (g) 7#, (h) 8#, (i) 9#, and (j) 10#.
A magnified view of samples 1# to 10# is shown in Figure 2(a) to (j). The comparison of the morphology, distribution of fiber for all samples, we discover that the proportion of fiber per unit area increases with increases fiberweb thickness. With the densification of fiber from the continuous stacking of fiber layers, the white area of image gradually decreases, and the image becomes darker. This image shows that the gradual increase of the cotton fiber web layer leads to the change of through porosity, indicating that the through porosity of the CFA gradually decreases from top to bottom.
Analysis is performed to analyze the relation between the pore size of the CFA and light transmission. The area of the white area of image is measured in Image Pro Plus 6.0 software for the AO values of x2, x3, x4. x1, x2, x3, and x4 of 1# to 10# sample are shown in Table 1. Table 1 shows that x1 increases as the number of fiber web layers increases. x2, x3, and x4 decreases as the number of fiber web layers increases. The fiber distribution of each fiber layer does not overlap, which can cause the remarkable change the AO index of the CFA. The pore characteristics of CFA are characterized by the AO index of each layer.
The AO index and pore index of CFA.

x1: the fiber assembly thickness; x2: the total pore area of AO; x3: the number of AO; x4: the average pore area of AO; B: the mean length of fiber between the adjacent contacts; ε: the porosity of fiber assembly; τ: the tortuosity factor.
Correlation between AO index and pore index
The density of cotton fiber (ρ) is 1.14 g/cm3, the diameter of cotton fiber (D) is 17.3 µm, the average length of cotton fiber (L) is 28.8 mm. By substituting the diameter, average length of cotton fiber and volume of the samples into equations (2), we could figure out the volume fraction (Vf). According to equations (1), (4), and (5), we could figure out the porosity of fiber assembly ε, the mean length of cotton fiber between the adjacent contacts B and the tortuosity factor τ. ε, B, and τ of the samples 1# to 10# are shown in Table 1. Inside the CFA, pore texture is extremely complicated, and the pore index cannot be effectively characterized by ε. The mean length of fiber between the adjacent contacts B and the fiber tortuosity coefficient τ are effective index to express fiber arrangement of fiber assembly. ε, B, and τ as the pore index could be constructed a comprehensive system for the pore texture. The structural information could not be positively controlled, a full design of experiments is not possible and therefore statistical analysis software is used to establish relationship between the pore index and the AO index. It is believed that these criteria will yield strong relationships in terms of the square of multiple corresponding correlation coefficient R2 values and signify the importance and reliability of the obtained results through regression modeling. Using x1, x2, x3, and x4 as independent variable, and B, ε, and τ as dependent variable, a random combination group of the independent variable, and each dependent variable are respectively fitted with multiple linear fitting. 11 Table 2 contains the R2 values resulted from the whole identification for each case (rounded to four decimals). The R2 values for some of the case are greater than 0.9, hence suggesting that the equations and data are well matched. Each dependent variable can be largely be explained by the combination of x1, x2, x3, and x4 that all R2 values are close to 1. And its regression equations obtained with respective coefficients for B, ε, and τ has been listed in Table 3. The P-value obtained for all the dependent variable, are less than 0.01 which are shown their statistical significant relation with the response variables. The overall significance of this regression equation, and the contribution of each regression coefficient, are found to be highly significant (p < 0.01) as tested by analysis of variance (Table 3). Pore size and its size distribution are important characteristics to determine the permeability and retention behavior of the CFA by influencing the effective porosity. 12 The results indicate that the AO index can largely be explained by three factors namely ε, B, and τ, which can aid in predicting the pore texture.
The R2 values of the AO index of microscope images and porosity index.

Results of the multiple linear regression.

R2: the square of multiple corresponding correlation coefficient; F: F-test values; P: significance level.
Comparing the relationship between B and ε, we discover that ε increases monotonically as the value of B increases. Comparing the relationship between B and τ, we discover that τ first increases and then decreases as the value of B increases. There is a strong linear relationship between B and ε, as shown in Figure 3. The regression equation for B and ε of CFA is ε = −1022.2 + 79.6B, and the R2 value is 0.9721.
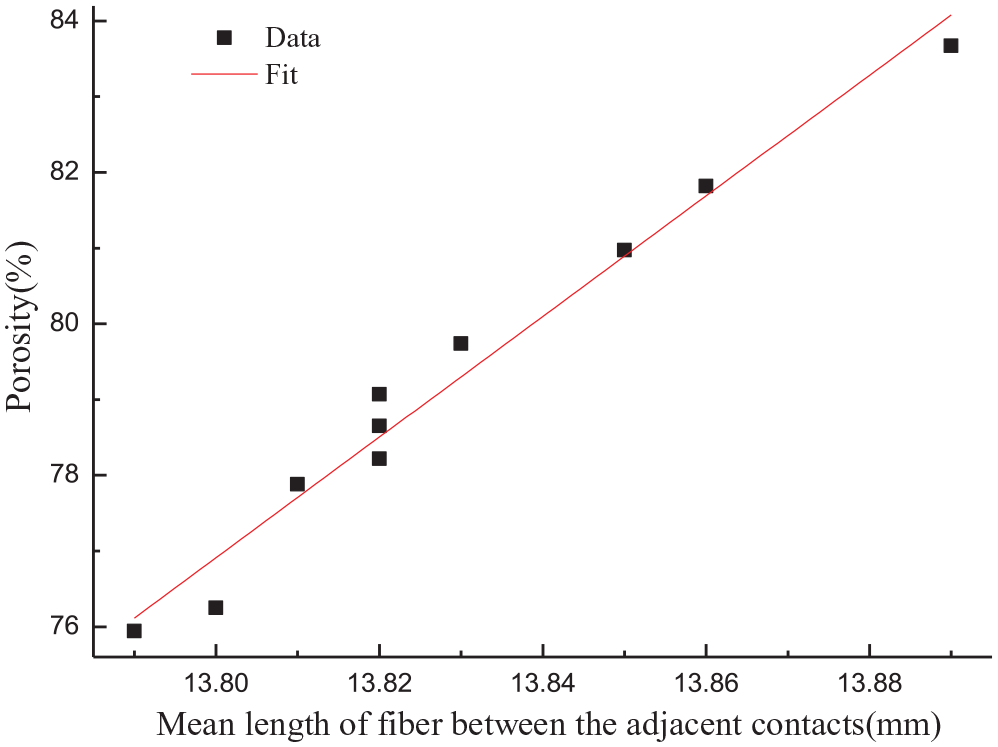
Regression results of the mean length of fiber between the adjacent contacts for the porosity of CFA.
Relationship of the pore index with air permeability of CFA
Permeability measures the ability of a porous medium of CFA to transmit fluids. 13 The permeability and pore geometrical structure are strongly related to each other. The CFA has very high porosity, it can be assumed that it is permeable. 14 B, ε, and τ of CFA are closely related to the geometry and dimension of intergaps and intrapores, and determine its air permeability q. The relationship between B and q, ε and q, τ and q are respectively shown in Figures 4 to 6. From Figures 4 and 5, they can be seen that q first decreases and then increases as the value of B and ε increases. Under the condition of the same thickness, the change of fiber distribution inside the fiber assembly has a significant impact on its porosity. In a varying fiber assembly system, void space of fiber assembly is difficult to determine in terms of porosity, variable thickness values bring uncertainty for the porosity. Thickness and differential pressure between the two surfaces of the CFA are the factors that affect permeability. From Figure 6, it can be seen that q decreases monotonically as the value of τ increases. Correlation analysis is performed to analyze the relation between the τ and q of CFA. The regression equation is q = 1430.9 − 28.4τ. A fitted line plot between the τ and q of CFA exhibited significant correlation with R2 value of 0.9823.
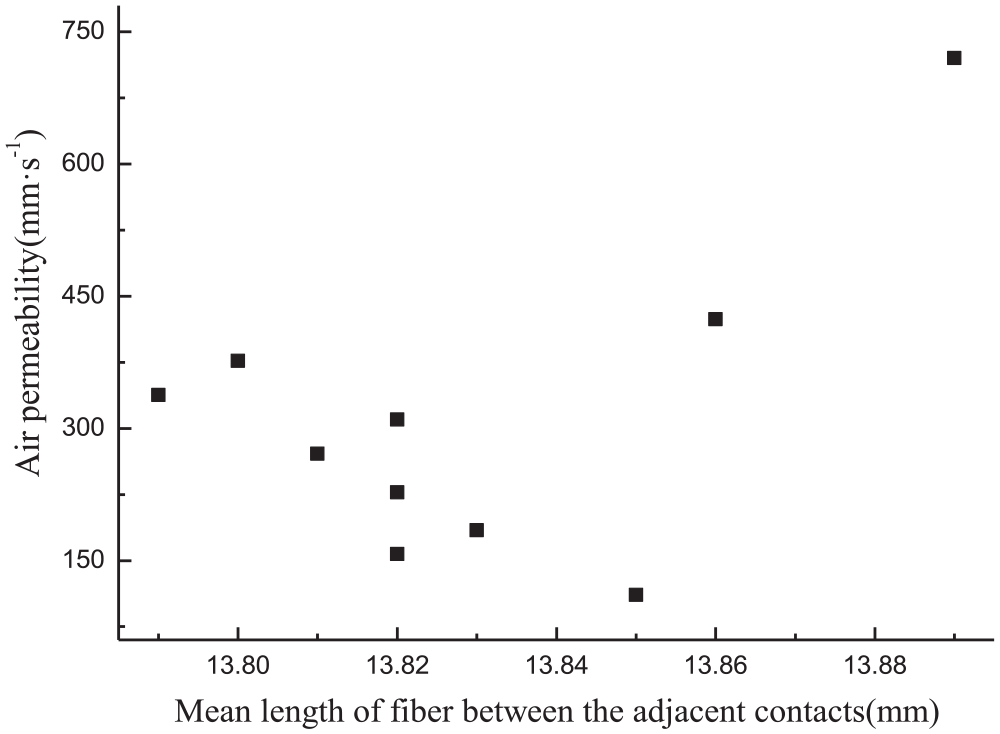
Relationship of the mean length of fiber between the adjacent contacts with air permeability of CFA.

Relationship of the porosity with air permeability of CFA.
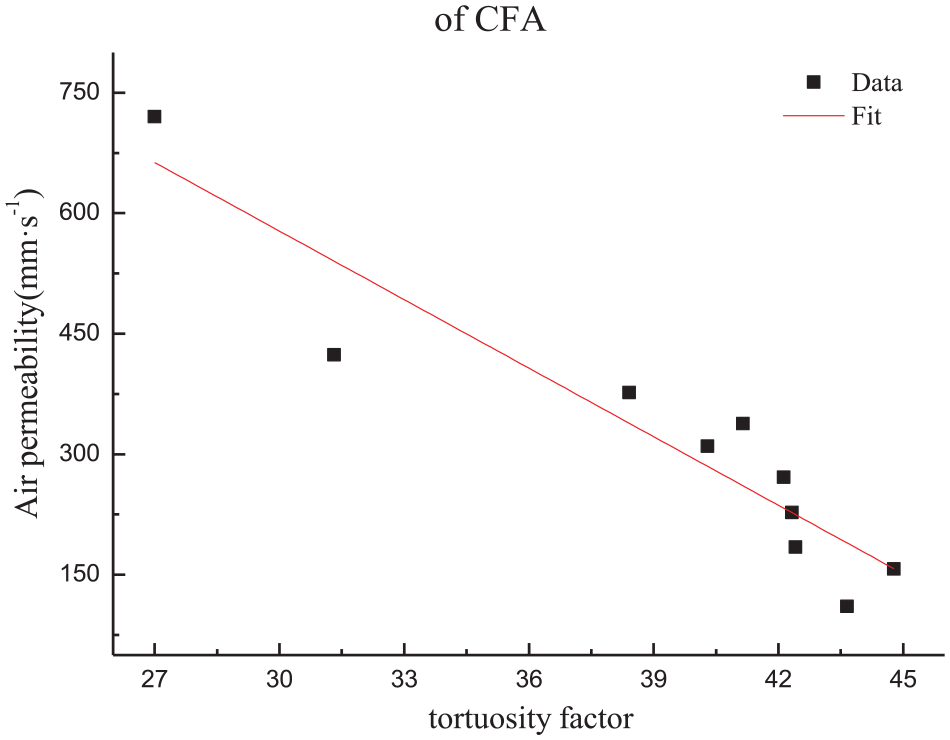
Regression results of the tortuosity factor for air permeability of CFA.
Conclusions
The internal pore structure of the CFA is complex and changeable, porosity is difficult to explain its internal pore structure. In order to evaluate pore characteristics of CFA, this paper collected the pore image of the multi-layer fiber assembly, used the Image Pro Plus 6.0 software to analyze the image, and obtained the AO indicators such as the pores number and pores area. Using multiple linear regression analysis method, the regression equation of AO and porosity index is established. Four of the selected input parameters, that is, thickness, total pore area, number of pore, and average pore area, are observed to produce strong effect on output properties. The results indicate that the AO index can largely be explained by three factors namely ε, B, and τ. Appropriate regression equations can be formulated for the pore index of AO index which can aid in predicting the pore texture. Comparing the data indicators, it is found that B and ε, τ, and q of the fiber assembly may be determined from each other with fairly good accuracy because of strong correlation. The accuracy of the correlation equation is also confirmed by its high R2 value.
Footnotes
Declaration of conflicting interests
The author(s) declared no potential conflicts of interest with respect to the research, authorship, and/or publication of this article.
Funding
The author(s) disclosed receipt of the following financial support for the research, authorship, and/or publication of this article: This work was supported by the National Natural Science Foundation of China (NO.11762020).