
Abstract
Only considered creep behavior of geosynthetics in the design and construction of reinforced structures, not that the creep behavior of reinforced materials considered geosynthetics-sand interaction under different loading levels. A series of creep tests on a geogrid under different loading levels were carried out through a self-developed test device. The long-term creep characteristics of the geogrids under different loading levels were analyzed. The results showed that: Compared to sand constraint condition, under the same loading level, the creep rate under non-constraint condition is about 1.1 times. After the creep time over 400 h, the strain growth rate tends to be a constant value for sand constraint condition, which needs 700 h for non-constraint condition. Creep deformation mainly occurs near the pullout endpoint of the geogrid, and the deformation of each strain measurement zone is reduced from the tensile end to the fixed end of the geogrid.
Introduction
Geosynthetics are widely used as reinforcement in walls, slopes, weak foundations, and reinforced wall structures, where they are subjected to constant stress throughout their service life.1–16 Polymers are viscoelastic materials, which components of geogrids, their creep properties affect the long-term performance of reinforced soil structures.17–23 Thus, it is necessary to evaluate the long-term creep behavior of geosynthetics. Usually, the deformation of geosynthetics will gradually increase under long-term load, furthermore the function and stability of the reinforced soil structure will be reduced or lost,24,25 but the influence of creep effect of geosynthetics is still rarely considered in reinforced soil structure engineering.
Most of the past studies were mainly focus on investigating the creep behavior of geotextiles or geomembrane,26–30 and the interface mechanism between sand and geogrid.31–33 To simulate the deterioration of mechanical properties of geogrid with the increasing loading time, many constitutive models and creep test method were developed under non-constraint condition,22,34–42 which provides a basis for the study of creep characteristics of geosynthetics. Most of the above studies were conducted under non-constraint conditions (standard temperature/standard humidity), as most of the creep tests were carried out to obtain the strength index of the geogrid), which are based on the wide-width pullout test just as the standards.43–45 However, Geosynthetics are often buried in the soil in the field of geotechnical and civil engineering, the sand-geosynthetics interaction restraints the deformation of the reinforcement, so the strain is significantly smaller than those under non-constraint condition. Also, as a special geosynthetic material, the geogrid shows unique creep characteristics under a specific temperature and long-term load, until now, a large number of accelerated temperature creep tests of geogrids under non-constraint condition has been investigated by some researchers.18,27,28,37,46–48 But those achieved results did not consider the influence of sand-constraint on the creep behavior mechanism of geogrid.46,49 Given this, it is necessary to study the creep behavior mechanism of reinforced soil structure under different long-term loads by considering sand-geosynthetics interaction.
At present, there is few study on the creep characteristics of geosynthetics considered sand-geosynthetics interaction. Previous results showed that the creep characteristics of geogrids are not only related to the external stress level, but also to time, temperature, humidity, and loading rate. Furthermore, França et al. 21 conducted a variety of creep tests on geosynthetics by considering sand-geosynthetics interaction through a self-designed creep test device, which is pointed out that sand-geosynthetics interaction is an significant factor affecting the creep of geogrids.21,50,51 However, due to the lack of creep test equipment and creep test methods, the creep mechanism of biaxial geogrids, which considered sand-geosynthetics interaction, is still not well understood.
In view of the above, a self-designed creep test device is used to carry out a series of creep tests on the geogrid in compacted sand. The long-term creep of the biaxial geogrids with different loading levels under sand constraint conditions, the creep characteristics and load-strain isochronous of the geogrid, are mainly studied. Furthermore, a practical method to reasonably determine the model parameters based on experiments is proposed.
Materials and method
Constrained media: Sands
A series of creep tests were performed on river sand used as a constrained medium, which is medium-sized sand with good gradation based on the particle sieving test. Their grain size distributions curves and some geotechnical characteristics are shown in Figure 1. Its uniformity coefficient Cu and curvature coefficient Cc are 8.44 and 1.15, respectively. The maximum dry density is 1.69 g/cm3, the relative density and internal friction angle of soil particles, are 2.65 and 39°, respectively

Particle size distribution of the river sand used as constrained media.
Geogrid
Geogrid is a special geosynthetic material formed by extruding and stretching high molecular polymer (high density polyethylene HDPE or polypropylene PP), it was widely using in practical projects of various types of reinforced soil structure. The subject of test is a biaxial stretched geogrid (the aperture is 40 mm × 40 mm, TGSG-3030), as shown in Figure 2. The size of the geogrid is 600 mm × 240 mm (length × width). According to the “Testing Procedures for Geosynthetics,” 43 the tensile properties of the geogrid under the non-constraint condition were obtained as shown in Figure 3. Also, the 2 % longitudinal tensile force and the 5 % longitudinal tensile force of geogrid is 12.5 kN/m and 21.5 kN/m, respectively. Its ultimate tensile strength is about 29.5 kN/m, and its rupture strain is about 10.3%.

Geogrid sample.
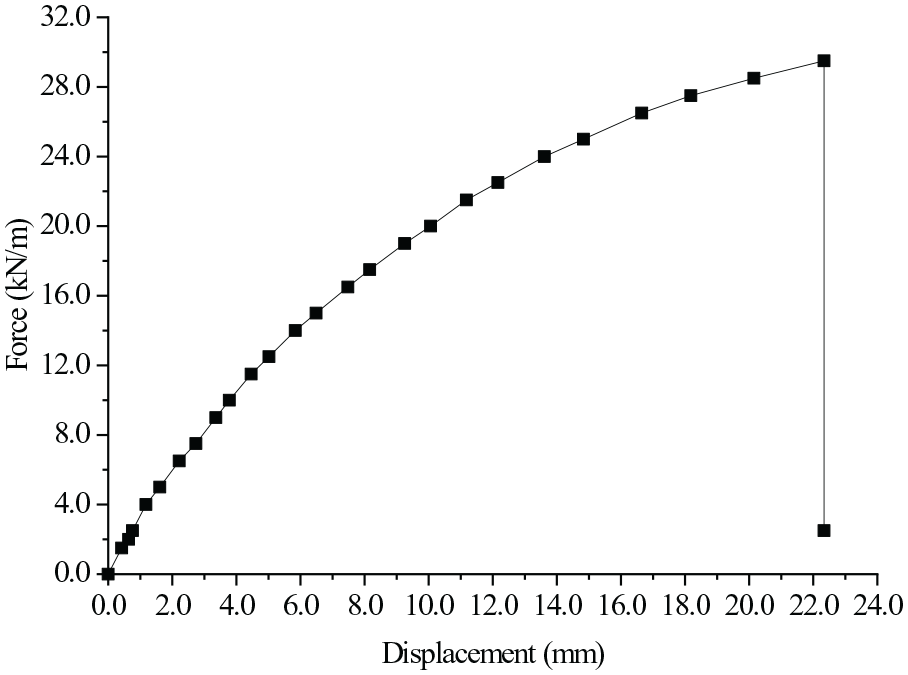
The relationship between force and displacement of a typical geogrid sample.
Creep-testing equipment
All of the creep tests were performed on the new self-developed equipment, which is illustrated in Figure 4. It consists of a loading system (including horizontal load and vertical load), creep tested boxes, clamping system, and measuring system. Considering the difficulty of a large number of horizontal loads in the test, the lever principle with a ratio of 1:6 is used to reduce the applied load, while the vertical load is directly applied by weights. The dimension of the test bench is 1.6 m × 1.3 m × 0.8 m (length × width × height). The lower box of tested boxes (600 mm × 300 mm) is fixed, and the upper one is removable. The clamping system consisted of fixed fixtures and free fixtures, as shown in Figure 5. Rubber bearing was used inside fixtures, and three bolts are set to provide clamping power. The creep-testing equipment can carry out the creep test on four specimens at the same time. The clamp is fixed at the one end of the tested boxes, and another end is connected to the loading system, then the deformation value can be measured by using dial indicators. And the accuracy of the dial indicator is ±0.01 mm, the applied load accuracy is ±1.0%. Besides, according to the creep test scheme, under the condition of 15 kPa vertical load, the constraint creep tests performed with various loading levels. However, the creep strain of geogrid is small under the sand constraint, and a certain higher vertical load may not be measured accurately using the proposed creep equipment.

Overall view of the new creep-testing equipment. (a) Actual image of the setup for creep tests. (b) Schematic side view. (c) Schematic diagram of loading force in constraint creep test.

Measuring point layout.
To ensure the accuracy of test results, a hard rubber bearing is provided on the inner side of the steel plate of the fixture, and the geogrid of the fixture is fixed by tightening the fixture bolts. The test results show that the specimens are reliably clamped and no-slip occurs during the experiment, which meets the requirement of “Test Methods for Creep Testing and Evaluation of Plastic Geogrids” QB/T 2854-2007 and “Geosynthetics plastic Geogrid”. 44 In addition, to ensure continuous exerting horizontal tensile stress on the sample during the creep test, the bracket of fixed pulley is directly welded and a fixed with the base of the creep equipment. Meanwhile, the bottom end of the fixed U-shaped groove of the fixed pulley is flush with the clamping end of geogrid. One end of the steel strand is connected with the clamp, and another end is connected with the end of the lever through the fixed pulley, thus ensuring that continuous exerting horizontal tensile stress on the geogrid.
Creep test scheme
According to GB/T17689-2008 stipulated in the specification “Plastic Geogrid for Geosynthetics,” creep tests were performed under the conditions of temperature 20°C ± 2°C and humidity 50% ± 10%, consistent with the International Standard,52–54 which is similar to the real condition that geogrid encounters during usage. Before creep test, it needs to perform short-term, wide-width tensile tests on the geogrid specimen in order to determine their ultimate tensile strength (UTS) and corresponding strain of the geogrid. The load level Pnon-constraint of non-constraint creep test is set to 62%, 72%, and 82% of the non-constraint UTS (Ultimate Tensile Strength) value, respectively. To investigate the long-term creep behavior of geogrids in soil reinforcement applications, the creep load stress level was determined based on the non-constraint tensile strength of the geogrid.
In order to facilitate comparison and analysis, the geogrid specimen size and measuring point arrangement are the same under the non-constraint and constraint creep tests. Considering that the two ends of the tested boxes (Free end and fixed end) clamp each part of the geogrid, the length and wide-width of the geogrid specimen are 720 mm and 240 mm, respectively. Meanwhile, there are five steel strings fixed at nodes from the tensile end of the geogrid to the fixed end of the geogrid in sequence. The fixture at the fixed end is extended to the outside of the tested boxes which connects successively with the dial indicator, and five corresponding measurement points is set (point A to E as shown in Figure 5), so as to measure the creep deformation of the geogrid. In addition, in the process of sand filling, the compaction of the filler is controlled by the equal mass and equal volume method, and the upper and lower boxes are filled with standard sand layer by layer and compacted with a 10 kg weight, thereby ensuring that the geogrid is always in a horizontal state in the pullout process. According to the creep test scheme, under the condition of 15 kPa vertical load, the constraint creep tests performed with loading level at 32, 42, 52, 62, 72, and 82% of UTS, respectively.
In addition, the data acquisition device allows to collect data by artificial at set time intervals, and the time intervals are 1 min, 2 min, 6 min, 10 min, 15 min, 30 min, 60 min, 2 h, 4 h, 8 h, 10 h, 24 h, 50 h, 72 h (3 d), . . ., 900 h, 1000 h, 1008 h (42 d), respectively. When the creep loading time exceeds 100h, the data collection interval is 100 h to measure the increase in the length of the geogrid specimen. The elongation of the geogrid specimen divided by the effective length of the sample is the value of strain, which is determined by follows equation (1):
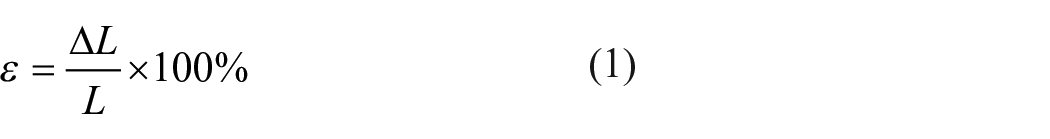
where
Experiment results and analysis
Creep behaviors at different loading levels
Constraint creep behaviors
Non-constraint creep test is performed according to “Geosynthetic Plastic Geogrid” (QB/T17689-2008). A series of constraint creep tests performed with geogrid at 82%, 72%, and 62% of UTS respectively and vertical stress of 15 kPa, which subjected to vertical stress equal to 15 kPa, the results are presented in Figure 6. Firstly, the creep strain rate of the geogrid is faster at the initial loading stage (0 ⩽ t ⩽10 h) than other loading stages. Secondly, from the viscoelastic deformation period to the stationary period, the deformation rate continuously decrease and tends to be stable (100 h ⩽ t). Thirdly, the deformation modes under different loading levels are generally the same, which from linear growth to non-linear slow attenuation, but the creep strain of the geogrid under high loading level is more significant than that under low loading levels. For the AB section (t = 100 h), the creep strain at 82% of UTS is 1.2 times and 1.4 times 72% of UTS and 62% of UTS, respectively. The main reason for this phenomenon is the geogrid is a high-polymer material, and its internal molecular bonds at different loading levels show visible segment relaxation phenomenon, which shows that the creep characteristics under different loading levels are the significant differences.

Curves of geogrids at non-constraint creep test. (a) Pnon-constraint equal to 82% of UTS. (b) Pnon-constraint equal to 72% of UTS. (c) Pnon-constraint equal to 62% of UTS.
In addition, the creep strain of the AB zone is sequentially significantly more significant than the other three measurement zones (i.e. the BC, CD, and DE zone) at the same loading level. It indicates that the deformation mainly occurs near the pullout end of the geogrid, as well as the deformation difference between each measurement zone is small. When Pnon-constraint equal to 82% of UTS, the creep strain of the AB zone is 1.2, 1.4, and 1.6 times of the BC, CD, and DE zones, respectively. When Pnon-constraint equal to 72% of UTS, the creep strain of the AB zone is 1.2, 1.5, and 1.8 times of the BC, CD, and DE zones, respectively. When Pnon-constraint equal to 62% of UTS, the creep strain of the AB zone is 1.2, 1.4. and 1.8 times of the BC, CD, and DE zones, respectively. The reason is mainly that the geogrid is subjected to a constant tensile load when it is constrained by sand-free media, which is the same as the stretch in the air state. The tensile strength at both ends is equal, and each mesh is uniformly stressed. The creep strain of the geogrid at the fixed end will increase with time increasing, which is similar to the theoretical analysis result.
Constraint creep behaviors
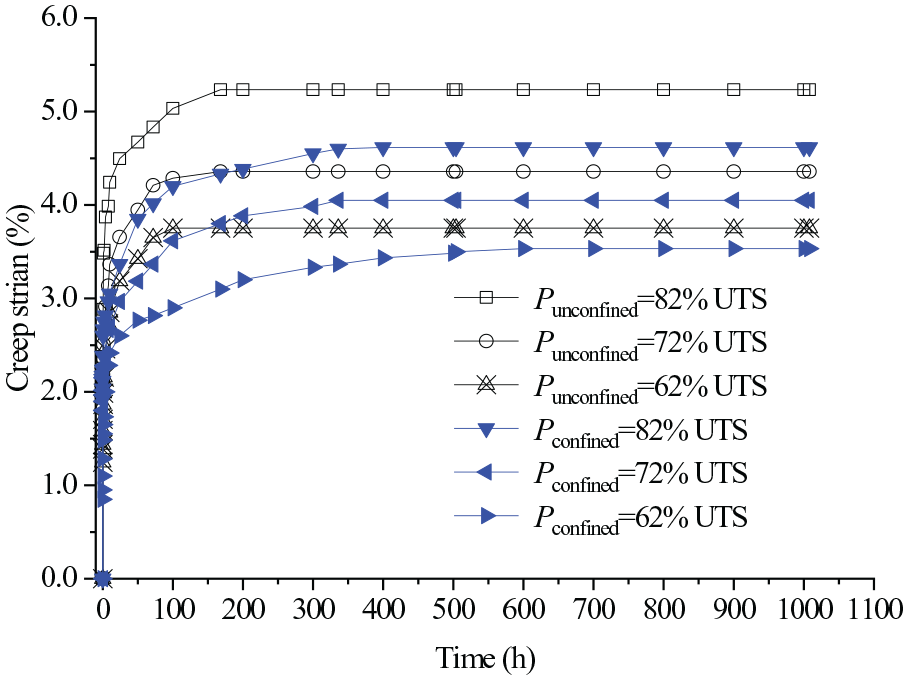
Figure 7 presents the creep strain curve of the geogrid under different creep loading levels. As can be seen from Figure 7, the increase in creep loading levels in the constraint creep test (temperature equal to 20°C ± 2°C) markedly increases the creep deformation rate. It can be known that the creep loading level is one of the most critical factors affecting the long-term creep characteristics of the geogrid. Under the horizontal tension of 82% of UTS and 62% of UTS (AB zone), the time required for the geogrid to reach 3.0% strain is 2 h and 200 h, respectively. When the loading level reaches 82% of UTS, the most of deformation occurs within about 1 h after loading, which is more than 59% of the total deformation, furthermore the cumulative strain before 72 h is more than 99.59%.
Curves of geogrids at the constraint creep at different loading levels. (a) Pconstraint equal to 82% of UTS. (b) Pconstraint equal to 72% of UTS. (c) Pconstraint equal to 62% of UTS.
For the geogrid samples selected in the test, creep strains can be divided into three distinct phases:
In the first phase, it is a rapid deformation phase, the strain is an elastic strain under tensile load condition, which is approximately linear with time.
In the second phase, it is a viscoelastic deformation phase, the strain-time curve gradually transits from the straight line to the bending line, which the strain growth rate gradually decreases.
In the third phase, it is a deformation stabilization phases, the strain-time curve further slows down, which the strain growth rate tends to a constant value.
During the creep test, the geogrid samples did not rupture under different creep loading levels. When the creep time over 400 h, the strain growth rate remained a constant value. Compared with the non-constraint creep deformation of the geogrid under the same conditions, it takes more than 300 h to enter the deformation stabilization phases. This is mainly because of the sand-geosynthetics interaction limited the tensile deformation of the geogrid, and reduced creep strains of the geogrid.
The relationship between creep strain and time of the geogrid in different measurement zones are presented in Figure 8. In the semi-logarithmic coordinate system, it can be seen that the development trend of the creep strain of the geogrid at different measurement zones under different loading levels is similar, the creep strain of geogrid increasing with the load holding time increase, and the peak value of lateral creep deformation successively decreases. The peak value of the BC section and the CD section is about 64% and 21% of the peak value of the AB section, respectively, which shows that geogrid has significant viscoelastic deformation characteristics. It is mainly due to the mesh structure of the geogrid when it is overlaid on the reinforced soil, which not only has a surface friction, but also has an apparent joint force between the soil and geogrid. As a result, the tensile force of the geogrid is unevenly distributed in its length direction, so that the most of deformation of the geogrid occurs near the pullout end (i.e. the AB zone) under a constant overlying load.

Relationship between deformation and time of geogrid at different loading levels. (a) AB section. (b) BC section. (c) CD section.
The research indicates that: (1) With the increase of the creep loading level under sand constraint, the more obvious the creep characteristics of the geogrid, the greater the creep strain and creep rate; (2) At a low creep loading level, the creep rate of the geogrid increases first and then decreases, and it finally stabilizes quickly; at a higher creep loading level, the creep rate is relatively significant, and it takes a long time tend to stable.
Comparison between constraint and non-constraint creep behaviors
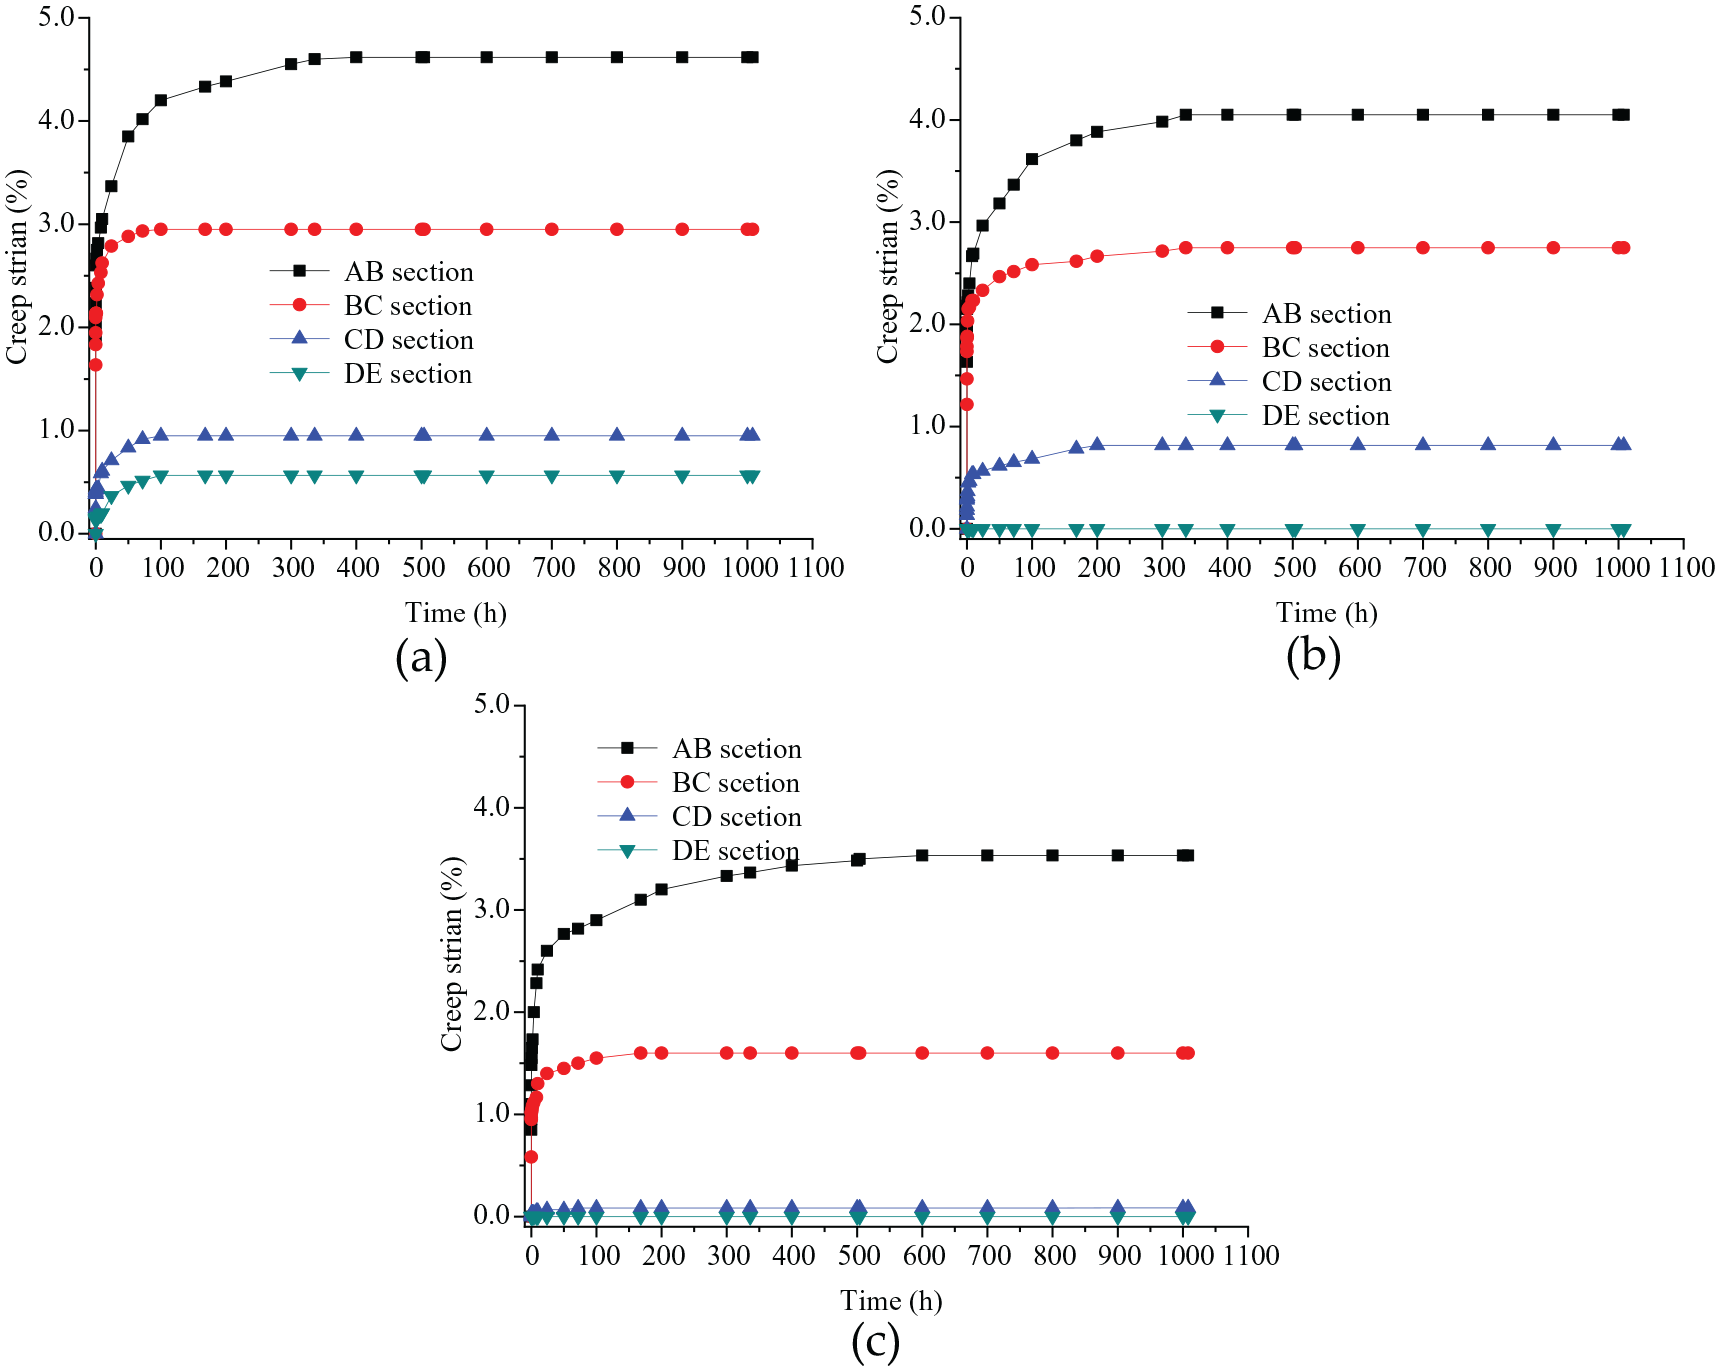
Figure 9 shows the relationship between the strain and time creep of the AB zone of the geogrid under sand constraint and non-constraint condition. The constrain creep strain of geogrid when subjected to 100 h under different loading levels (82% of UTS, 72% of UTS, 62% of UTS) is 4.2%, 3.6%, and 2.9%, respectively, while it was respectively 5.0%, 4.3%, and 3.7% under non-constraint condition. The results show that the creep deformation of the geogrid decreased significantly compared with the non-constraint conditions. In addition, when the loading time reaches 400 h, the creep strain at 82% of UTS loading level is 29% higher than that 62% of UTS under non-constraint condition, while the creep strain at 82% of UTS loading level is 26% higher than that 62% of UTS under constraint condition. When the loading time reaches 1008 h, for the loading level is 82, 72, and 62% of UTS under the non-constraint condition, the strain is 5.2, 4.4, and 3.7%, respectively. However, compared to under constraint condition, the creep strain of the geogrid under the non-constraint condition for the same loading level is 4.6, 4.1, and 3.4% respectively, meanwhile its creep rate is obviously much faster.
Comparison of geogrid in the AB zone creep response regarding the constraint condition of the specimen.
The research indicates that: (1) under constraint condition, the deformation along the tensile direction is limited by the sand-geosynthetics interaction. Compared with non-constraint condition, the maximum reduction in creep deformation of the geogrid is 11.5% (Pconstraint = 82% of UTS & T = 1008 h) under constraint condition. (2) The deformation is basically stable during the creep time (400 h ⩽ t ⩽ 1008 h), and it can be inferred from the strain-time curve that the creep strain of the geogrid is difficult to reach 10% of the rupture strain under non-constraint condition. (3) The creep rate of the geogrid under constraint condition is significantly lower than that non-constraint condition, which is about 1.1 times under non-constraint condition that constraint condition at the same loading level.
Analysis of creep characteristics of geogrid
Isochronous creep curve
According to the relevant creep test results, as well as, according to ISO13431 standard, it can be seen that the most of deformation of the geogrid occurs in the initial stage of the creep test, and then gradually begins to slow down, so the interval is set to be smaller in the initial stage and larger in the following so the interval is set to be smaller in the initial stage and larger in the following stage. The specific data analysis is shown in Table 1. It is found that the mean value increases with the increase of creep load, and the standard deviation is basically about 1.0. However, the main objective of the study was to compare the constraint with the non-constraint behavior of the geogrids. So the mean and standard deviation of the geogrids has not been thoroughly studied in the research. In this paper, the isochronous load-strain relationship of the geogrid samples under different loading levels was analyzed at seven representative moments: 1 min, 1 h, 8 h, 72 h, 168 h, 720 h, and 1008 h, as show in Figure 10. As can be seen Figure 10, at the loading time of 1 min, the creep strain of the AB zone at different loading levels is non-linearly increasing, and the maximum creep strain is 1.92%. In contrast, at the loading time of 720 h, the constraint creep strain of the geogrid risen from 2.22% under a loading level of 32 % of UTS to 4.62% under a loading level of 82% of UTS.
The isochronous loading levels and strain of the AB zone under sand constraint.


The curves of isochronous loading levels and strain. (a) AB section. (b) BC section.
In addition, when the creep strain of BC zone is 1 min, the overall increase of creep strain is significant under different loading levels. The maximum creep strain (about 1.64%) is smaller than that the AB zone of geogrid, the tendency of creep strain-time curve at different loading levels is the same from 1 h to 1008 h, and its creep strain increases from 2.14% at 32% of UTS to 2.95% at 82% of UTS. The test demonstrates that the loading level is an essential factor affecting the creep behavior of the geogrid.
Tensile modulus of geogrid
To thoroughly study the creep characteristics of the geogrid under long-term loading, taking the geogrid at two strain values of 2% and 3% as an example, by calculating the secant tensile modulus (i.e. the ratio of the loading level to the strain) over time, the relationship between the tensile modulus of the geogrid and the time is obtained, as shown in Figure 11. The secant tensile modulus of the geogrid decreases with time. Before the strain reaches 5%, the geogrid mainly exhibits attenuation creep characteristics. The larger the strain, the larger the corresponding secant tensile modulus, which indicates that the stress causes a specific deformation of the material is much high, and the ability of the material to resist deformation gradually decreases.

Relationship between the secant tensile modulus and time of the geogrids.
Geogrid creep model
Creep model
The creep curve of the geogrid is shown in Figure 7, the loading levels are mainly 62% of UTS, 72% of UTS, and 82% of UTS. The creep curve and isochronous curve of the geogrid under three loading levels are shown in Figures 7 and 8, respectively. For the typical creep characteristics of the geogrid, two modes are generally considered. Namely, the attenuation creep process and the non-attenuation creep process presents in Figure 12.

Typical creep characteristics of the geogrids.
When the test loading level is low, the creep process is carried out with deceleration. Namely it is attenuation a creeping process; when the test loading level is high, the creep process is carried out with acceleration, and namely, it is a non-attenuation creep process. As shown in Figure 12, the creep strain εc(t) of the total strain ε over time is as following equation (2):

According to the relationship between the strain of the geogrid and creep time, the following power function relationship is used to express the relationship.

For a given moment, take natural logarithms on both sides of the equation (3), then

It demonstrates that at a given moment, there is a linear relationship between force and strain on the unit width of the grid in the double logarithmic coordinates.
For different zones of geogrid, its creep characteristics under different creep loading levels are basically the same. So only one zone is need to select for statistical analysis (see Table 2). Because of the power function model can accurately describe the creep behavior of geosynthetics,17,40,55–57 which was used to fit the data in the AB zone, and it is found that the correlation coefficients are above 0.97. It shows that the test data in this paper can accurately express the creep behavior of geogrids under sand constraint and non-constraint conditions.
The statistical analysis for AB zone creep strain under sand constraint.

Relationship between creep model parameters and loading levels
Using equation (3) to fit the constraint creep test data and non-constraint creep test data at 62% of UTS, 72% of UTS and 82% of UTS, respectively. The fitting value of parameters (the AB zone) under the environment temperature of 20°C ± 2°C can be obtained, as shown in Table 3. Each loading level curve at constraint creep test and non-constraint creep test fitted by a power function, in which the correlation coefficient R2 of the evaluation function fitting effect is more significant than 0.9. Therefore, it can be considered that the selected fitting function is in good agreement with the test data.
Fitting parameters of empirical creep model.
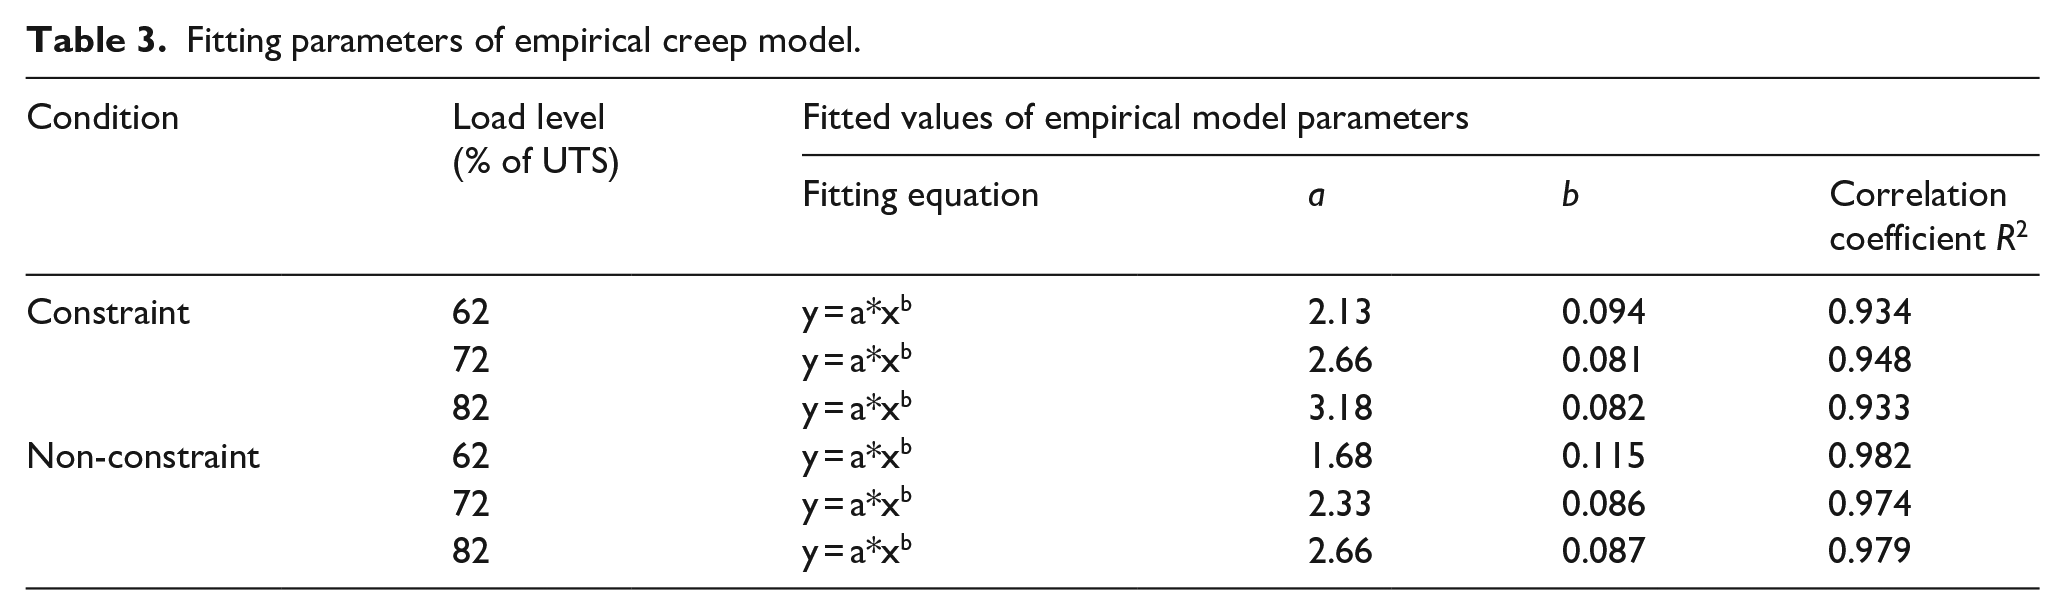
Also, according to the fitting parameters in Table 3, the relationship curve between the creep model parameters and the load stress ratio (creep loading level) is presented in Figure 13. The development of the model parameter a at constraint creep test and non-constraint creep test is similar. When the stress ratio increases, the model parameter a in the creep model increases almost linearly, while the parameter b first shows attenuation state then stabilizes. By analyzing the relationship between the empirical model parameters a and b and the test loading level under the same environment temperature (20°C ± 2°C), it can be known that the parameters in the creep model depend significantly on the loading level (that is, the stress ratio).

Dependency of parameters on loading level at same environmental temperatures.
Conclusion
Considering the influence of sand-geosynthetics interaction on the creep characteristics of geogrids, a series of constraint creep and non-constraint creep tests were carried out through a self-developed test device. The creep behavior of the geogrid under different loading levels is obtained. The characteristics of the creep curve and load-strain isochronous curve of the geogrid are discussed. The main conclusions are as follows:
Compared with the unconstrained conditions, the maximum reduction in constraint creep deformation of the geogrid is 11.5%. While increasing the tensile loading level can accelerate the creep under the same conditions.
During the loading period of the sand-constrained creep test, the geogrid samples did not rupture at different creep loading levels. The strain growth rate tended to a constant value when the creep time reached 400 h, while it takes more than 300 h under the same conditions at the constraint creep test.
The creep deformation mainly occurs near the pullout end of the geogrid. The deformation of the different strain measurement sections from the pullout end of the geogrid to the fixed end decreases in order.
Under the same loading levels, compare to sand-constrained creep test, the creep rate without sand-geosynthetics interaction is about 1.1 times, and the ability of sand-constrained geogrid to resist creep deformation is stronger than that of the unconstrained case.
Footnotes
Declaration of conflicting interests
The author(s) declared no potential conflicts of interest with respect to the research, authorship, and/or publication of this article.
Funding
The author(s) disclosed receipt of the following financial support for the research, authorship, and/or publication of this article: The project was funded by the National Natural Science Foundation of China (No. 41962017), the Natural Science Foundation in Guangxi Province of China (No. 2017GXNSFAA198170), the High Level Innovation Team and Outstanding Scholars Program of Guangxi Institutions of Higher Learning of China, the Guangxi University of Science and Technology Innovation Team Support Plan of China, Doctoral Foundation of Guangxi University of Science and Technology under Grant No. 03200009 and 03200010, Guangxi University Young and Middle-aged Teachers’ Basic Scientific Research Ability Improvement Project (2020KY08023).