
Abstract
This article presents the development of a knitted flexible sensor, which is embedded into a seamless garment, for monitoring health condition. The sensor is designed as an elastic weft-knitted plain structure, where the conductive silver-plating filament yarn is used for breathing signal collection and the spandex core-spun yarn is used to ensure good attachment of the garment to human body. The breathing amplitude and breathing frequency are obtained from the variations in sensor resistance. The sensor can measure various kinds of breathing conditions, such as normal breathing, slow breathing, fast breathing, and shallow breathing. The results are in reasonable agreement with the actual condition. Such kind of flexible sensors have the advantages of wearable and comfort.
Keywords
Introduction
With the development of wearable technology and intelligence, knitted flexible sensors produced from conductive yarns have caused great interests. Knitted flexible sensors have advantages since they are bendable, foldable, washable, and comfortable to wear. They have been applied to monitor foot pressure, 1 gait characteristics, 2 human body posture, 3 human body electrocardiograph,4–6 breathing,7–9 pulse, 10 motion of human body,11,12 and physiological parameter.13,14
Faced with the huge market, smart textiles have been investigated in many universities and institutes, such as the Georgia Tech Institute’s Smart Shirt project, 15 the VivoMetrics’s LifeShirt, 16 the Massachusetts Institute of Technology’s MIThril project, 17 the EU’s IST FP5/6 project—Wealthy & Myherat, 18 the French VTAMN project, 19 and the Chinese University of Hong Kong’s health-care shirts. 20 A smart compression stocking was developed to monitor the pressure values of the foot and the gait characteristics of the human body in real time. 21 Intelligent clothing based on graphene was used for electrocardiograph monitoring sensors. 22 Other studies tried to establish a uniaxial tension23–25 and biaxial stretching26,27 fabric meso-structure resistance model 28 to analyze the effects of fabric deformation and fabric conductivity.
Due to the features of weft-knitted fabrics, they are the ideal for manufacturing underwear or tights. Thus, incorporating flexible sensors into weft-knitted fabrics or garments have aroused wide interest. For instance, Wang and colleagues23,24,29 and Atalay et al. 30 developed weft-knitted sensors and studied theoretically and experimentally the correlation between the strain of the sensor and its resistance. The belt-shaped sensors produced on a flat-knitting machine were used to monitor respiratory rate (RR) under static and dynamic conditions, and good results have been obtained. Zhao et al. 31 made a naturally integrated force sensing textile based on knittable composite coaxial fibers to achieve multiple site force measurements. Zhao et al. 32 fabricated a highly stretchable and breathable textile strain sensor based on conductive polyester fabric (CPF) with weft-knitted structure by chemically growing conductive and transparent Al-doped ZnO (AZO) element via atomic layer deposition (ALD) for tracking both large and subtle human motions. A simple, inexpensive, and scalable dip-dry-reduce approach method is reported to fabricate a flexible strain sensor using polyester knitted elastic band (PEB) as the platform material which is coated with reduced graphene oxide, which can sense and record large-scale human body motion even under water-immersed condition. 33 Silver nanowires were synthesized according to the polyol method, and then drop casted on knitted wool fabrics to be used as capacitance to measure respiration and finger motions. 34 An and Stylios 35 made a high stitch density weft-knitted conductive fabric and its size was 20 mm × 40 mm and a flexible motion sensor circuit to record electrocardiogram (ECG) and motion signals synchronously, and is suitable for ambulatory ECG measurement and motion tracking applications. Raji et al. 36 studied the influence of elastic yarn type and rib fabric structure variation on the physical, tensile, and conductive properties, and sensitivity performance of knitted underwear strain sensors to be used for breathing mensuration. There is an increasing demand for measuring RR to monitor the progression of clinical events such as cardiac arrest or during the admission to the intensive care unit (ICU). 37
In this article, weft-knitted flexible sensors were incorporated into a seamless underwear at different locations. Seamless garment was produced to well fit the human body using elastic yarns and selecting proper process parameters, which ensured the attachment of the sensors to the human body thus collect strong enough signals. The sensors were used to monitor the frequency and magnitude under various breathing conditions. Different types of respiratory signals were measured, and the performance of the sensors was evaluated.
Experiments
Materials
The flexible sensors were embedded into a seamless garment at desired positions. The garment was produced on the SM8-type circular knitting machine from Santony Company in Italy. Each loop of the knitted garment was made of two yarns, that is, silver-plated conductive nylon filament yarn (110dtex/36F, Jiangsu Pingmei Yarn Industry Co., Ltd.) and elastic nylon/spandex core-spun yarn (22/33dtex, Jiangsu Pingmei Yarn Industry Co., Ltd.) in the sensor parts, while elastic nylon filament (77dtex/24F, Jiangsu Pingmei Yarn Industry Co., Ltd.) yarn and elastic nylon/spandex core-spun yarn (22/33dtex) in the rest parts. Each loop in the fabric consists of two yarns, which are overlapped in such a way that the conductive or elastic nylon filament yarns appeared at the technical surface of the fabric, while the spandex core-spun yarn at the back. The silver-plated conductive nylon filament yarn was utilized as the conductive element in the sensor, the longitudinal and cross-sectional structures of which are shown in Figure 1.

Morphology of the silver-plated conductive nylon filament: (a) longitudinal and (b) cross-sectional.
Figure 1 shows that in the conductive filament, a silver-plating layer is formed on the surface of the nylon matrix; the silver provides good ductility, and nylon filament yarn provides good spinnability. The conductive filament yarn was produced by silver electroplating technique and had the advantages of low resistance and strong bonding strength to the nylon matrix. Its resistance was 0.516 Ω/mm. The knitted seamless garment with 60 flexible sensors is shown in Figure 2.
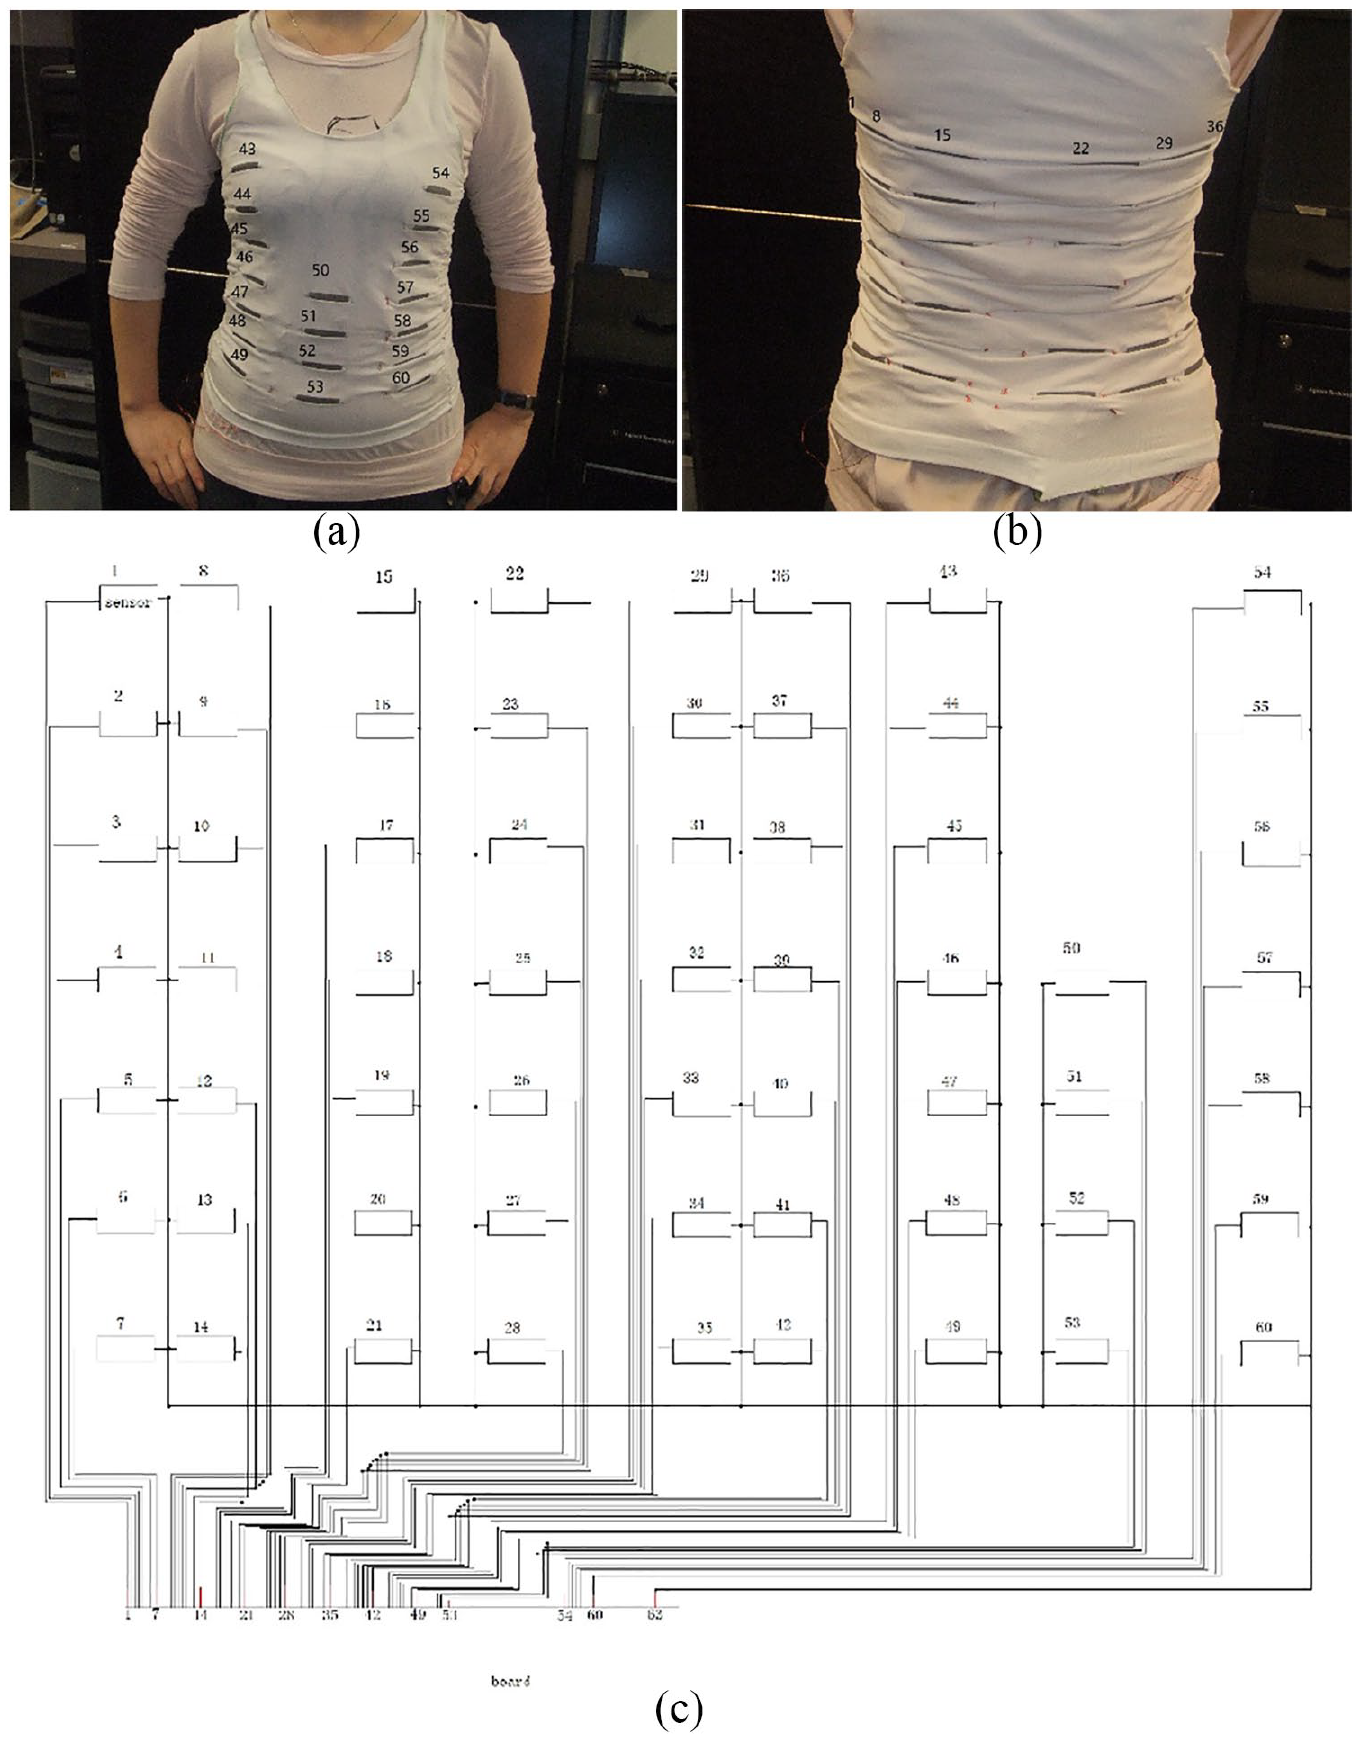
A knitted seamless garment with flexible sensors: (a) front view, (b) back view, and (c) arrangement of flexible sensors.
The size of each sensor was 13.2 mm × 31.7 mm. In the sensor, the total length, height, and width of a knitted loop were 3.55, 0.65, and 0.45 mm, respectively. The garment could be produced in different sizes as normal commercial products according to the guidelines established by the Measurements Standards Committee so that the consumers could select suitable garment sizes according to their body sizes. The elastic spandex in the garment helped the garment fit bodies to obtain remarkable electrical signal changes caused by breathing.
Testing method
Keithley’s Series 2400 source measure unit (SMU) instrument (Keithley) was used to measure the resistance change of a sensor at different strain, and LabVIEW program was used to display vividly the variation of measured resistance with time. The elongation of the sensor was controlled by a step motor. The same method was used to measure the resistance change of a sensor due to breathing. The circuit diagram is shown in Figure 3, where number 11 denotes silver-plated conductive nylon filament; 12 denotes elastic nylon/spandex core-spun filament; and 13 denotes the connection point of yarns at the end of a sensor. The conductive filament yarns being knitted into courses of loops in each sensor are bonded together at point 13.

Connection mode of yarns at the end of a senor (in the sensor part, the conductive filament yarn is displayed on the surface of the fabric).
Results and discussion
Resistance changes of sensor with strain
The measured relationship between the resistance and strain of a sensor is shown in Figure 4, where the solid line is experimental data and the dot line is fitting line obtained by MATLAB software. The correlation coefficient R-square is 0.955.

Sensor resistance within 50% strain.
Figure 4 shows that when the strain is within 10%, the resistance of the sensor increases significantly; and when the strain is greater than 10%, the resistance changes relatively slowly. This is because that when the fabric is subjected to tensile strain, the elongation of the yarns forming knitted loops in the sensor contains four parts, (1) the straightening of curved yarn segments; (2) the extension of straightened yarn in the direction of the tensile force; (3) yarn slippage at interlacing points; (4) compressional deformation of yarns at interlacing points. The first and second parts cause a large deformation, while the third and fourth parts cause a relatively small deformation. Therefore, when the sensor is subjected to a small strain, the resistance changes quickly; while as the strain increases, the resistance changes relatively slowly.
The relationship between the resistance of a sensor made of weft-knitted single jersey structure is explained from theoretical point of view as follows. A loop as the basic unit of weft-knitted structure comprised a needle loop La, two contact interlooped segments c, a sinker loop La, and two leg yarn segments Lb. Two loop units contact with a needle loop along the vertical direction, while two loop units contact with a sinker loop along the horizontal direction. With the assumption that c, La, and Lb have resistance of Rc, RLa, and RLb, respectively, the equivalent circuit of a loop is a hexagonal circuit and composed of two Rc, two RLa, and two RLb (Figure 5).

Unit cell of a (a) weft-knitted loop and (b) equivalent circuit.
The relationship between the yarn segment resistance R and tensile strain is derived by the conventional resistance law

where ρ, l, and A are resistivity, length, and cross-sectional area of the yarn, respectively.
Based on the assumption that the conductive yarn has a cylindrical structure and resistivity ρ = cV for the conductive material as well as using Poisson’s ratio, the resistance of the yarn is derived as23,24
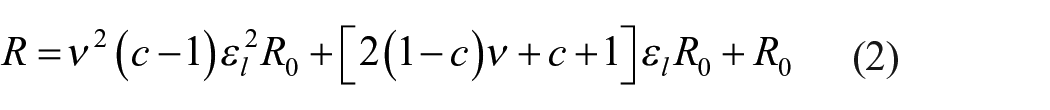
where R0 is the resistance of the fabric in relaxed state, c is a constant related to the number of free electrons per atom and the atomic density.
By calculating the resistance of weft-knitted sensors with m courses and n wales, it was found that the circuit network is a multiple circuit parallel to the wale direction while in series along the course direction as measured in this study. Therefore, the resistance of sensor with m × n loops can be expressed as

where R = R(m,1) is the resistance of a sensor with m courses and 1 wale, for example, for a sensor with 4 course 1 wale, the loop yarn segments resistance is expressed as23,24
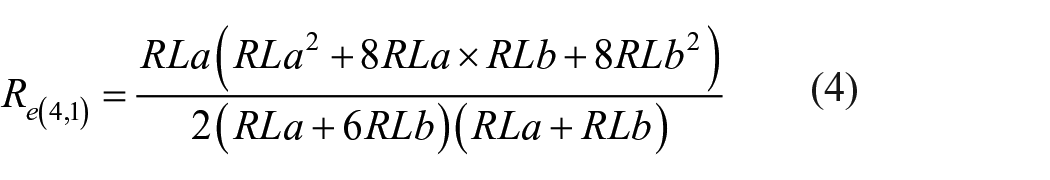
Equation (4) indicates that the resistance of a weft-knitted sensor is a function of the resistance of conductive yarn segments, each of which is proportional to
The contact resistance Rc is expressed as23,24

where K depends on the resistivity ρ and hardness H of the contacting materials; Ft is the contacting force.
Then, for a sensor with 4 course 1 wale, the resistance is expressed as

Stability of sensor
In addition to high sensitivity, excellent environmental stability is particularly important for application of flexible sensors in smart garment, rehabilitation, and sport activities. Stability is the ability of a sensor to provide reproducible results over a certain period of time. The resistance of the sensors was measured for 50–1000 cycles at 10% strain in Figure 6(a). It can be seen that the resistance is approximated equal to the original value, so the sensors have good stability. In order to illustrate the detailed change of resistance with strain, two measurement cycles are shown in Figure 6(b). It is can be seen that there is a resistance hysteresis, namely it takes some time for the sensor to recover to its original resistance. This is due to the elastic hysteresis of the knitted structure.

Sensor resistance change: (a) within 10% strain 50 cycles, (b) within 10% strain 1000 cycles, and (c) within 50% strain in 2 cycles.
The results of breathing signals
The resistance of the No. 22 sensor which located on the right back was measured under normal, slow, fast, shallow, and deep breathing. The results of this sensor are chosen, for example, since it lies in relatively flat position so can be closely cling to the body and obtain stronger breathing signals.
The results of the former four types are shown in Figure 7.

Breathing signals obtained from No. 22 sensor located on the right back under different conditions: (a) normal breathing, (b) slow breathing, (c) fast breathing, and (d) shallow breathing.
It can be seen that the sensor resistances of all kinds of breath signals change with time. The peaks represent the inhalation (sensor stretching), and valleys represent the exhalation (sensor relaxing). From the amplitude and frequency of sensor resistance curves, breathing amplitude and frequency can be achieved. Since the resistance of each connecting point (13 in Figure 6) is 0.3 Ω, the real sensor resistances are 0.3 Ω lower than the resistances shown in Figure 7.
Normal breathing
Normal breathing (Figure 7(a)) is the breathing taken by a person in a relaxed state, and the breathing rate of adults is 12–24 breaths/min. Inhalation needs about 1–1.5 s, normal exhalation is 1–1.5 s, followed by an automatic pause (i.e. holding breathing) for 1–2 s.
The breathing signals in Figure 7(a) are analyzed as follows. After wearing the sensor in a holding breathing state, the resistance RA which was larger than the original resistance R0 and preparation time tA was obtained. From the difference between RA and R0, a strain εA was obtained from the equation given in Figure 4. When the person was inhaling, the resistance RB was measured, the strain εB and inhaling moment tB were obtained. When the person is exhaling, the resistance RC was measured, the strain εC and exhaling moment tC were obtained. By combined consideration of Figures 4 and 7, the breathing amplitude (εAB and εBC) and breathing time (tAB and tBC) were obtained.
The no breathing resistance RA, inhaling resistance RB, and exhaling resistance RC are 3.06, 3.89, and 3.03 Ω, respectively (Figure 7(a)). Thus, the real no breathing resistance
Slow breathing
Slow breathing (Figure 7(b)), also known as bradypnea, refers to breathing at a rate less than 12 breaths/min for adults. Because the person who wore the wearable sensors didn’t breathe smoothly, the resistance curve is not smooth as well. There is breathing standstill phenomenon during her breathing, so there is a small platform in the resistance curve at the corresponding strain. This indicates that the sensors can well monitor the slow breathing, so they are potentially applicable to catch the signals of bradypnea, which is caused by health problems such as heart disease because of aging, tissues damage and heart defect, high blood pressure or hypertension, hypothyroidism or underactive thyroid gland, obstructive sleep apnea during sleep, and inflammatory disease.
The no breathing resistance RA, inhaling resistance RB, and exhaling resistance RC are 3.05, 3.54, and 3.05 Ω, respectively, from Figure 7(b). Thus, the real no breathing resistance
Fast breathing
Fast breathing (Figure 7(c)), known as hyperventilation or over breathing, is the state of breathing faster or deeper than normal. It causes excessive expulsion of carbon dioxide. It can be resulted from a psychological state such as a panic attack or a physiological condition such as metabolic acidosis, and may be achieved passively due to health problems or voluntarily as in the yogic practice. Fast breathing RR is higher than 24 breaths/min for adults. Because human who wears the wearable sensor shirt breathes very prompt to simulate the respiration condition after strenuous exercise, she breathes unevenly and the sensor resistance valleys and peaks show different values in different cycles. In the figure, the sensor resistance ranges (breathing amplitude) from 3.0 to 3.8 Ω and frequency is 70 breaths/min, and the RR of the experimenter testing number is 69 breaths/min.
Shallow breathing
Shallow breathing (Figure 7(d)) is the drawing of minimal breath into the lungs, usually by drawing air into the chest area using the intercostal muscles rather than throughout the lungs via the diaphragm. As shown in the right part of the figure, the sensor resistance or breathing amplitude ranges of shallow breathing from 3.1 to 3.7 Ω, which is nearly half of the normal breathing resistance. But the frequency is higher than normal breathing. Shallow breathing can lead to or be symptomatic of rapid breathing and hyperventilation. Since most people who breathe shallowly do it throughout the day and are nearly always unaware of it; therefore, monitor of breathing using flexible sensor is a useful method.
Deep breathing
In this study, deep breathing is represented by athletic breathing, which is breathing that is done by contracting the diaphragm, a muscle located horizontally between the chest cavity and stomach cavity. Air goes into the lungs, and the belly expands during this type of breathing. Due to lung expansion being lower (inferior) on the body as opposed to higher up (superior), it is known as “deep,” and the higher lung expansion of rib cage breathing is referred to as “shallow.” Attaining maximal lung expansion may require both diaphragmatic contraction as well as rib cage expansion, as the amount of room created by the abdominal depression or rib stretching may not create an adequate enough vacuum space on their own.
Deep breathing exercises are a form of relaxation, and therefore, when practiced regularly, lead to the relief or prevention of symptoms commonly associated with stress, which may include high blood pressure, headaches, stomach conditions, depression, anxiety, and others. There are additional extra benefits to human, such as weight loss, asthma treatment, therapy stuttering/stammering, and so on.
Figure 8 shows deep breathing with 1- to 5-s intervals. The curves of the resistances in pause or holding breathing period are not constant but decrease with time. This is because though the nose does not inhale the oxygen, the need of oxygen by human body will influence the state of muscles; therefore, the chest circumference still contracts.

Deep breathing obtained from No. 22 sensor with different time intervals: (a) deep breathing interval 1 s, (b) deep breathing interval 2 s, (c) deep breathing interval 3 s, (d) deep breathing interval 4 s, and (e) deep breathing interval 5 s.
The breathing signal from other sensors
The signals obtained by the sensor (No. 1) located under the armpit (Figure 2(c)) are shown in Figure 9. It can be seen that the sensor resistance varied with different types of breathings. This was also observed for all the other sensors considered in this section.

Breathing signal from No. 1 sensor located under the armpit: (a) normal breathing (18/min); (b) shallow breathing (17/min); (c) deep and slow breathing (10/min); (d) deep and slow breathing (9/min); (e) deep and slow breathing (8/min); and (f) shallow and fast breathing (24/min).
The signals obtained by the sensor (No. 8) located at left back (Figure 2(c)) are shown in Figure 10.

Breathing signal from No. 8 sensor located at left back: (a) deep breathing interval 1 s, (b) deep breathing interval 2 s, (c) deep breathing interval 3 s, and (d) deep breathing interval 4 s.
The signals obtained by the sensor (No. 29) located at right back (symmetric with No. 8); sensor (No. 43) located above the right chest; sensor (No. 54) located above the left chest (symmetric with No. 43); sensor (No. 46) located below the right chest; and sensor (No. 51) located at the abdomen (Figure 2(c)) are shown in Figure 11. These sensors together with the sensor No. 22 obtained the strongest signals among all the sensors used in experiments.

Breathing signal from other sensors: (a) normal breathing (19/min) and (b) shallow and fast breathing (45/min) (breathing signal from No. 29 sensor located at right back (symmetric with No. 8)); (c) normal breathing (14/min), (d) slow breathing (10/min), (e) shallow and fast breathing (45/min), and (f) fast breathing (40/min) (breathing signal from No. 43 sensor located above the right chest); (g) shallow and fast breathing (45/min) and (h) fast breathing (40/min) (breathing signal from No. 54 sensor located above the left chest (symmetric with No. 43)); (i) fast breathing (45/min) (breathing signal from No. 46 sensor located below the right chest); and (j) breathing after running (21/min) (breathing signal from No. 51 sensor located at the abdomen).
By comparing the amplitudes of the signals obtained by above-mentioned sensors, it has been found that for normal breathing, sensors No. 1 and No. 22 obtained stronger signals than sensors No. 22 and No. 29 and, for deep breathing, sensor No. 22 obtained stronger signals than sensors No. 1 and No. 29. This suggests that left chest is a relatively optimal position for setting a sensor for monitoring breathing. However, Figure 11 shows that various breathing signals can be captured by the above-mentioned sensors and the signals of different types of breathings have remarkably different features. This indicates that any of the above sensors can be used to identify the types and characteristics of breathing, thus can be used to monitor breathing.
Conclusion
A novel flexible breathing signal sensor is designed to monitor health condition. The wearable and comfortable sensor can measure various kinds of breathings, such as normal breathing, slow breathing, fast breathing, and shallow breathing. Both the breathing amplitude and frequency can be obtained, and the results agree with the actual condition reasonably. This study provides a novel way of design and production of wearable health monitoring sensors.
Footnotes
Acknowledgements
The authors would like to extend thanks to the colleagues at the Advanced Fiber Materials Laboratory (AFML) and at the Flexible Electronics and Energy Lab (FEEL) at the University of British Columbia for their help and support. The authors would like to extend thanks to the Textile Engineering National Experimental Teaching Demonstration Center at Zhejiang Sci-Tech University.
Declaration of conflicting interests
The author(s) declared no potential conflicts of interest with respect to the research, authorship, and/or publication of this article.
Funding
The authors disclosed receipt of the following financial support for the research, authorship, and/or publication of this article: This work is supported by Science Foundation of Zhejiang Sci-Tech University (ZSTU) under Grant No. (14012003-Y); Key Disciplines of Zhejiang Province Universities under Grant No. (2014YBZX02); Priority No.1 Subjects of Zhejiang Province Universities Open Fund under Grant No. (2014KF03); and the Fundamental Research Funds of Zhejiang Sci-Tech University under Grant No. (2019Q027).