
Abstract
Due to the increasing application of carbon fibre–reinforced plastics, the use of recycled carbon fibres can help reduce the tremendous amount of carbon fibre waste growing worldwide. In this context, the processing of longer recycled carbon fibres (>40 mm mean length) into hybrid yarn constructions offers a promising solution. The characterisation of recycled carbon fibre length is essential for textile processes. However, to suit the atypical fibre characteristics of recycled carbon fibres compared to standard natural or man-made-fibres, the development of an adequate measuring technique is required. Investigations on the state of the art suggest that an adapted fibrograph method might pose an appropriate measuring system. Therefore, new test equipment and an alternative image analysing method based on pixel greyscale values were developed. To enable a calibration process, different samples with cut carbon fibre from carded and drafted slivers were intensively tested and compared. In addition, an adapted reference method was investigated by combining single fibre measurement and image processing techniques. In a final step, recycled carbon fibres samples with unknown fibre length were tested. Results proved that the presented measuring system is adequate for the testing of longer recycled carbon fibres in webs or slivers. All measured values were close to the measured reference length values (deviation ±4%).
Introduction
Processing recycled carbon fibres (rCF) into hybrid yarn constructions is a promising approach towards employing the enormous potential of these high-performance fibres in carbon fibre–reinforced plastics (CFRP).1,2 To estimate the achievable yarn and composite properties, characterise the fibre damaging at the individual process steps and properly adjust textile machinery settings (e.g. roller distances of drafting systems), information on the length distribution of rCF in webs or slivers is required. Since rCF are brittle in nature and sensitive to shear and bending forces, they must be handled gently in textile processes. Investigations by Hengstermann et al. 1 also show that a minimum fibre length of approximately 40 mm is required for hybrid yarn manufacturing; to tap into the full performance potential, a fibre length around 80 mm is necessary. 2 Hence, an effective and reproducible measurement method is extremely important.
Although a number of methods for the length measurement of conventional natural and man-made fibres is presented in the literature (and will be detailed in the following sections), a suitable measurement system for long rCF is still commercially unavailable. The required test method must be able to identify the rCF in spite of their extremely small diameter (7 µm), low transmittance, formation as fibre bundles with hundreds or thousands of single fibres, and high fibre lengths (>40 mm mean length). Moreover, this method should be immune to the electrical conductivity of these fibres and gentle to reduce the risk of fibre damage.
The methods used for the measurement of fibre length can be classified into direct and indirect testing. In direct testing, each fibre is evaluated separately, while in indirect testing, several fibres are investigated simultaneously. The fibre length can be obtained based on the length or weight of fibre samples.
Single fibre measuring methods according to test standards DIN 53808-1 3 or ISO 6989 4 are direct measuring methods, where single fibres are removed from samples by one or two tweezers, and the length of each fibre is either measured manually or with the help of a WIRA Single Fibre Length Machine. 5 These test methods are deemed not suitable for the testing of rCF length in webs or slivers due to the extremely time-consuming process, bundle formation, and brittleness of single rCF. This brittleness of rCF fibres also results in their length being shortened more significantly by removing single fibres from the sample using tweezers. Previous tests also showed that the measured fibre length considerably varies by removing single fibres or fibre bundles from rCF samples. Less fibre damage occurs in fibre bundles due to their larger diameter as compared to single fibres, thus protecting the bundle from bending forces during the carding process. 2 However, it is a challenging task to count the number of single fibres in each bundle for the calculation of the fibre length values, while the precise weighing of bundles is impeded by their extremely low weight.
Another direct fibre length measuring device involving air canals and optical sensors is the Advanced Fibre Information System (AFIS, USTER, Switzerland). 6 Fibres are individualised by two cylinders and transported to an opto-electronical sensor by air stream while their individual length is measured. An alternative device in the form of the MDTA-4 (Textechno, Germany) was presented in 2015, where fibres are also individualised, and every fibre is directly measured using optical sensors and image processing. None of these systems has been tested yet for rCF due to their electrical conductivity and the damage they potentially cause to the sensitive electronics in corresponding devices. However, individualisation cylinders from a rotor spinning machine were previously tested by the authors, revealing that the mechanical individualisation process is highly damaging to brittle rCF and therefore impairs test results. 7 It is postulated that this fibre damage occurs in the case of both length testing devices. Importantly, it is unclear whether the implemented image processing systems are able to properly detect the long and extremely thin rCF and yield reproducible results. For example, waste material cannot be tested on the USTER AFIS, doing so can damage instrument components, and voids the instrument and component warranty; also, USTER does not guarantee test results on 100% synthetic fibres, the maximum fibre length is 2 inches (approximately 50 mm). 8
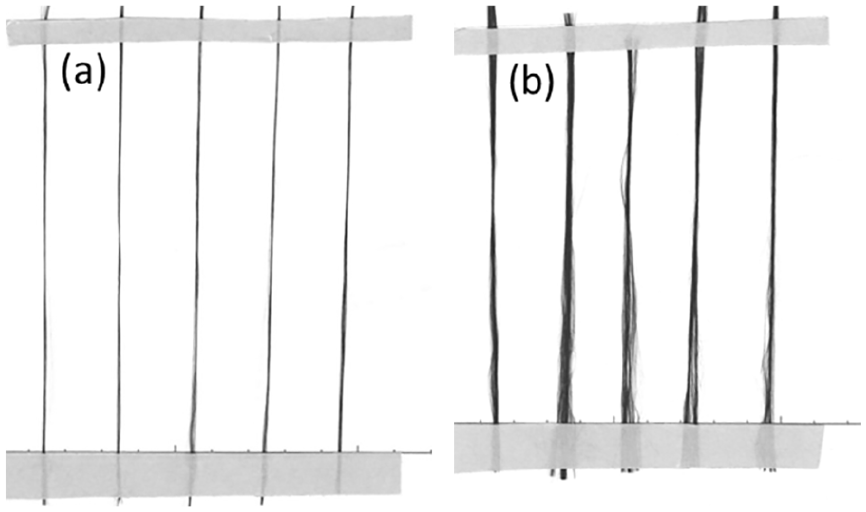
To calculate the length of fibres, direct fibre detection systems based on image processing can also autonomously detect fibres in webs or liquids. Those image processing systems are commercially available, for example, shown in literature.9,10 These test methods were previously investigated by the authors but found unsuitable for longer rCF because the course of individual fibres in the carded webs cannot be followed clearly, as illustrated in Figure 1. The reason for this is mainly caused by the higher slenderness ratio of the fibres, whereby longer rCF were significantly more deformed due to carding.
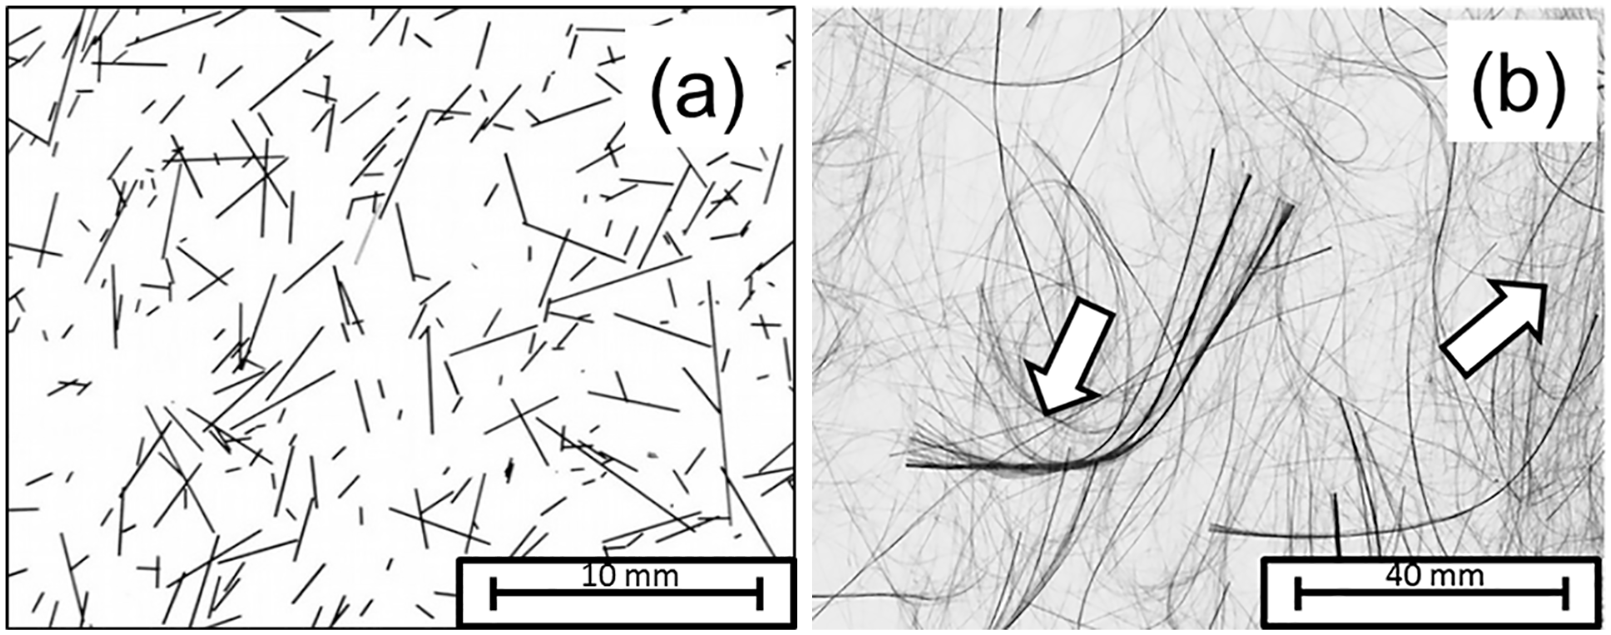
Scanned images of short carbon fibres with a length of up to 10 mm (a) and long carbon fibres with a length of up to 80 mm (b); the fibre length of most of the long rCF cannot be determined unambiguously (see arrows).
Furthermore, there are several indirect length measuring methods. Highly accurate but time-consuming systems are the Suter–Webb Array and Johannsen–Zweigle comb method, where fibres from a sample are sorted by special tweezers with a dual-bank comb sorter, then classified into length groups, and subsequently weighed. 11 Other systems, the Almeter12,13 and the WIRA Fibre Diagram Machine (Wira Instrumentation Ltd, UK), 14 involve end-aligned fibre beards, whereby manual or automatic presorting of each fibre in the sample to a reference line is necessary. The precise sorting of each rCF with a comb sorter device and subsequent weighting lead to the same issue as stated before in the case of the single fibre measuring methods according to test standards DIN 53808-1 or ISO 6989. Furthermore, the capacitive Almeter and WIRA Diagram methods are also unsuitable due to the electrical conductivity of rCF.
Fibre beards with non-end-aligned distributed fibres for indirect length measuring were first introduced by Hertel in 1940 using the fibrograph method. 15 This method was further improved and is now an integral part of the High Volume Instrument (HVI, Uster, Switzerland), which is an important device for cotton fibre measuring. A fibre specimen is extracted and the fibres are randomly clamped forming a fibre beard with randomly distributed fibres. This beard is then parallelized by means of brushes, while non-clamped fibres are removed. In a next step, an optical sensor is used to inspect the fibre beard, thus detecting the amount of fibres due to light transmission. Finally, the characteristic length values of the sample (e.g. mean length) are calculated from the measured span length of the fibre beard. The main advantage of this method is the very low sample preparation effort and the resulting short test duration compared to the other methods. Wu and Wang16,17 presented a novel approach towards the development of a dual-beard fibrograph method, enabling a non-invasive preparation process for fibre beards. Furthermore, the Short Fibre Content (SFC) can be directly measured versus being predicted by an algorithm in the HVI (=Short Fibre Index (SFI)). 18 The Lengthcontrol (TC-LCT, Textechno, Germany) was the first commercially available device that can automatically produce dual-beards from a sliver. However, the optical measuring principle of those systems is based on light transmission, which can be described by the Lambert–Beer derivation model; hence, the calibrated image processing of these devices shows a tendency towards imprecise measurements at higher fibre concentrations in the beard or when using fibre materials other than cotton. 19 For this reason, the HVI and Lengthcontrol devices are not suitable for the measuring of, for example, wool fibres due to considerably increased scattering and reflection in comparison to cotton fibres. 20 In addition, USTER states that the commercially available HVI is only suitable for the measurement of raw cotton bale fibres. 21 This difficulty in terms of accurate image detection by light transmission also applies to rCF.
Thus, most recently, alternative image processing techniques for the fibrograph method were introduced. Wu et al. 22 used a spectrophotometer to scan the reflectance of fibre beard samples based on the Kubelka–Munk theory for the calculation of a fibrogram. Results suggest a high potential, in particular for wool fibres. Other alternative and promising image processing techniques for the fibrograph method were introduced by Hengstermann et al. 23 for rCF and by Jin et al. 24 for cotton fibres. Here, the greyscale values of each pixel of scanned fibre beard images were counted for the subsequent fibrogram calculation. Such a method allows a rapid measurement of the fibre beards, moreover, the required flatbed scanner is relatively inexpensive available on the market. This is also of great importance with regard to possible hardware damage due to the electrically conductive rCF. So far, however, the presented method for rCF could not be calibrated due to a lack of a suitable reference method.
In summary, it is concluded that the fibrograph method gives the best basis for the fibre length measurement of the rCF in comparison to the other described length measuring methods. In particular, a flatbed scanner is suitable as test device for analysing the fibre beards.
The further development of the fibrograph method for rCF and the subsequent calibration process are shown below. For this, however, the development of a suitable reference method is required first, which is also presented here.
Experimental
Material
To enable a high-precision calibration process of the fibre length measuring system, mainly carbon fibres (CF) with known fibre length, type SIGRAFIL C T050-4.0/240-E100 (SGL, Germany) were used. This also significantly reduces the number of samples for fibre length measuring within the reference method. The CF filament rovings were cut into four different lengths (30, 35, 40, and 45 mm). Only CF with a cut length <45 mm were used for the calibration process since the resulting fibre length in the tested slivers is nearly identical with the original cut length prior to processing (see in Results, chapter “Calibration of the fibrograph method”). On one hand, this circumstance is related to the improved carding and drafting process, and on the other hand, it can be explained by the slenderness ratio of the fibres. Shorter CF bundles (⩽45 mm) are strongly aligned in the axial direction; hence, only very little fibre damaging occurs by bending forces during carding. Longer CF bundles (>45 mm) are more prone to bending, thus causing a significant amount of fibres to be damaged through the carding process.
To give an example with unknown fibre lengths, long rCF obtained from multiaxial weft-knitted fabric waste were used.
Description of the adapted fibrograph method
Fibre beard preparation and scanning
The use of the HVI fibre sampler device (Fibrosampler) for fibre beard preparation was investigated by the authors and rated as unsuitable for rCF length measurements due to the specific fibre fixation procedure in combination with the high flexural rigidity of the rCF. Thus, a preparation of parallelized fibre beards is not achievable (Figure 2). For this reason, slivers (e.g. from draw frame) are used for fibre beard preparation.
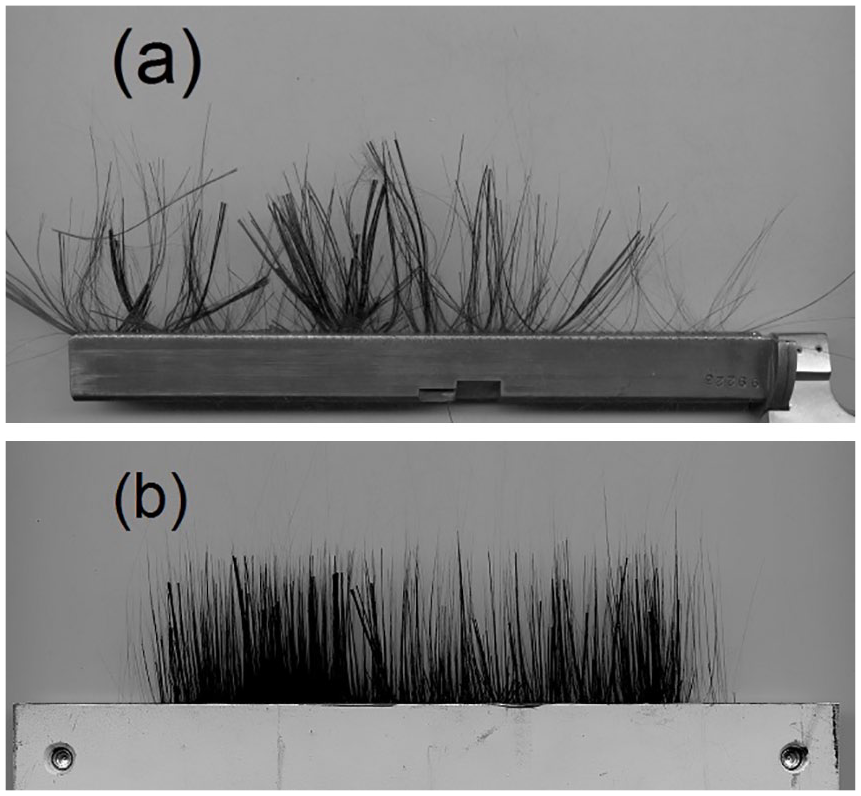
Prepared fibre beard with 40 mm rCF using fibrosampler (a) and self-built clamp (b).
For this, a modified laboratory long staple carding machine (Anton Gulliot, Germany) that allows very gentle processing was employed to produce a web of cut CF or rCF with 100 g/m2 each. The carded webs were then fed to a modified draw frame RSB-D40 (Rieter Ingolstadt, Germany) and drafted to a sliver with a fineness of 4.0 ktex. Previous results suggest that the drafting process of a carded web improves the sample preparation combing process because longer rCF exhibit increased waviness in the webs. The pressure of the draw frame rollers must be kept as low as possible to avoid fibre damaging, while simultaneously enabling a uniform drafting process.
For fibre beard preparation, one or more sample slivers were placed onto the bottom plate of a self-built clamp and fixed by the upper plate, including a rubber covering and two screws. The rubber cover prevents the smooth fibres from being pulled out during subsequent combing.
The width of the clamp length is 120 mm. After fixation by the clamp, non-fixed fibres were gently removed using a fine comb, simultaneously promoting fibre parallelisation, as shown in Figure 2. The prepared fibre beard was then scanned by a flatbed scanner Perfection V550 (Epson K.K., Japan), which offers modified housing to directly insert the complete clamp including fibre beard into the scanner.
The scanning parameters were set to 600 dpi, 8-bit greyscale and a brightness/contrast of 10/0 by previously conducted investigations. It was also found, that a higher resolution and higher colour depth does not affect the accuracy of image processing but is considerably more time-consuming. Brightness and contrast were adjusted to achieve a compromise between maximum image brightness and sufficient contrast for the detection of even very thin fibre bundles and the avoidance of light reflections of the shining rCF surface, which would influence the measured pixel values.
Evaluation of scanned fibre beard
The evaluation of the scanned fibre beard is computed by Matlab R2018a (The MathWorks Corp, USA) software, beginning at the clamping line from 0-mm span length, as illustrated in Figure 3.
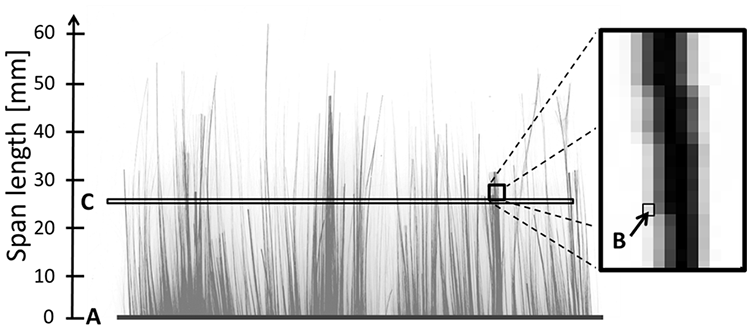
Scheme of length measurement of a fibre beard; A: clamping line, B: pixel value of the marked pixel (=37) and C: pixel value sum at a span length of 28 mm (=29,605).
From the scanned image of the fibre beard, the pixel value of each pixel in the range from 0 to 255 (8 bits) is determined and counted as a function of the belonging span length. To do this, a value of 112 is added to each pixel value to raise the background colour (pixel values in the range of 143–146) to a uniform value of 255 first. By subsequently inverting the pixel values, each pixel has a value between 0 and 143. Using this procedure, the number of fibres in the bundles can be determined very precisely, compared to a simple black and white binarization (1 bit). Figure 4 shows an inverted fibre beard image (a) and a histogram (b) with the associated pixel values. It can be seen, that approximately 22% of all pixels have a pixel value of 0 (=pure black) and thus are not taken into account in the calculation of the fibrogram.
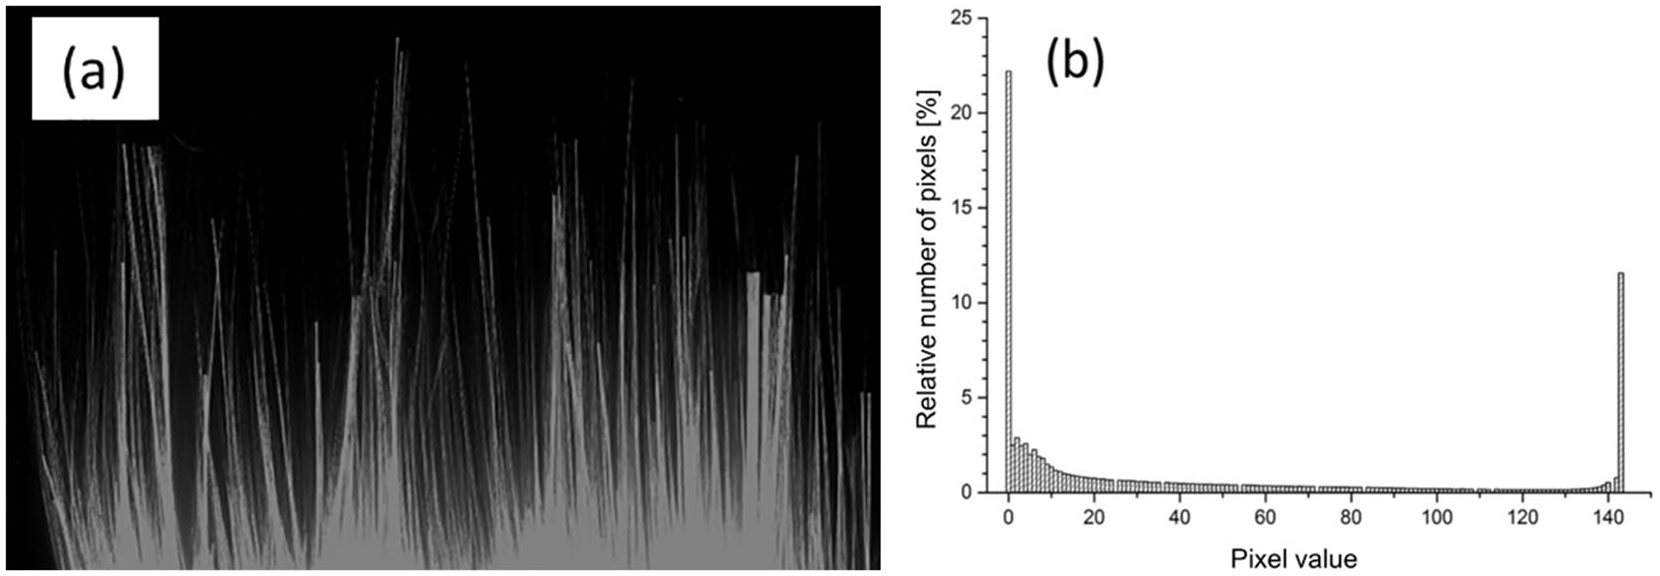
Inverted fibre beard image (a) and associated histogram (b).
Based on the pixel value sum of each span length, a span length diagram (=fibrogram) can be compiled by calculating the percentage of the pixel value sum (=number of fibres) per individual span length from the pixel value sum at 4 mm (=total number of fibres). As many fibres overlap in the area directly above the clamping line, it is an accepted procedure in HVI testing to start calculating from 0.15-inch (approximately 4.0 mm) span length, which was also applied in our research. An example compilation of a fibrogram is shown in Table 1. Two fibrogram samples are presented in Figure 5. Full interpretations of fibrograms have already been provided by several authors15,25–28 and will therefore not be discussed in detail in this article.
Example fibrogram compilation.

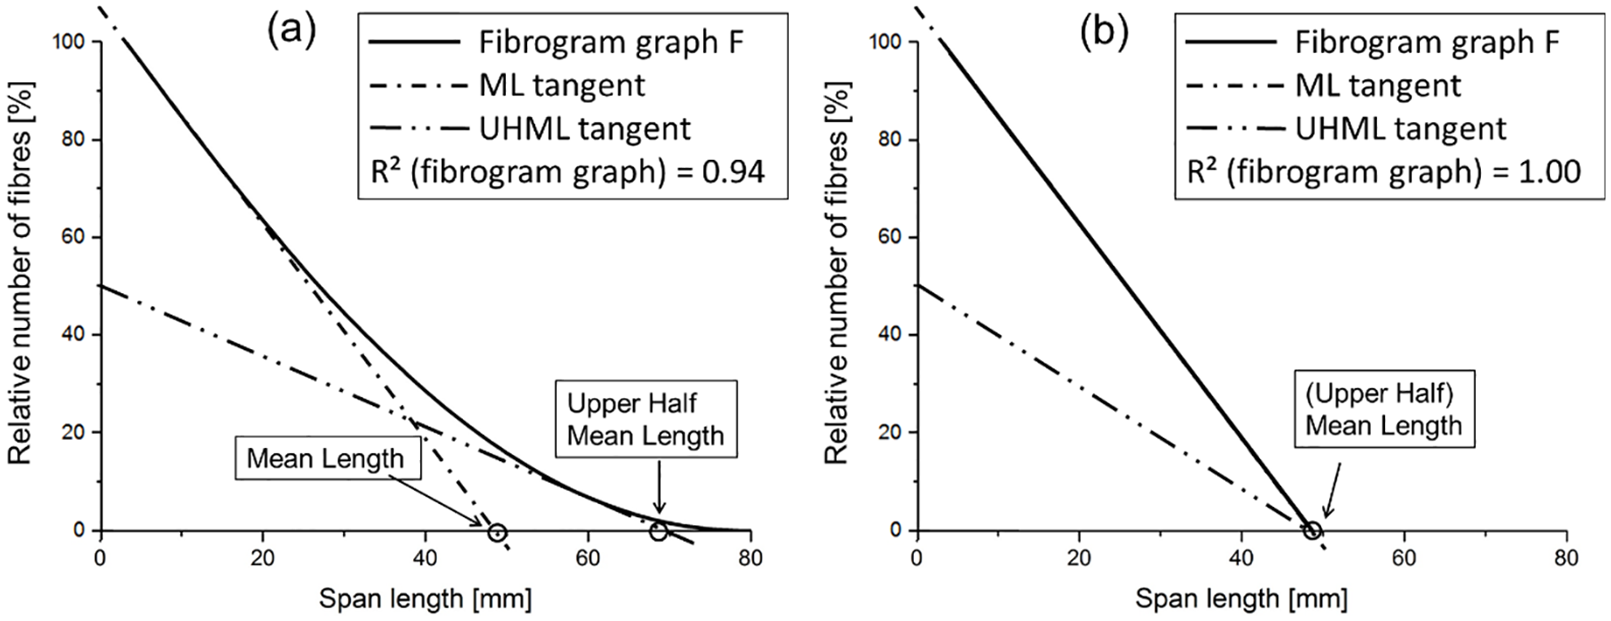
(a) Typical fibrogram graph F with different fibre lengths in the sample with measured mean length MLF: 49 mm and upper half mean length UHMLF: 68 mm; (b) theoretical fibrogram graph F with only one fibre length in the sample with (upper half) mean length (UH)MLF: 49 mm, according to literature.28,29
From this fibrogram, significant length values, that is, mean length (MLF) and upper half mean length (UHMLF) (by number) were calculated and averaged afterwards, by
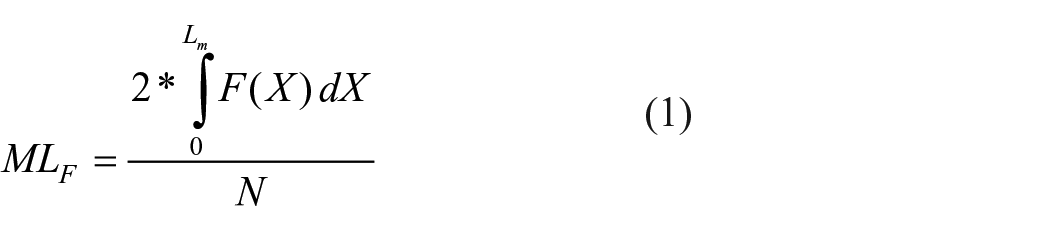


where L is the span length of the fibre sample, Lm is the span length of the longest fibre in the sample, F is the fibrogram graph, N the total number of fibres in the fibre beard (=the pixel value sum at 4.0 mm) and X the distance, according to Chu and Roger Riley, 25 and n is the number of fibre beard samples for each test.
To give information to the accuracy and reproducibility from different samples of fibrograph length testing, the CVF of the

Appraisal of fibre length distribution
Within the fibrograph method, also the USTER HVI, characteristic values ML and UHML are given to estimate the fibre length distribution; furthermore, the uniformity index (UI) can be calculated based on ML and UHML, according to Lawrence 30
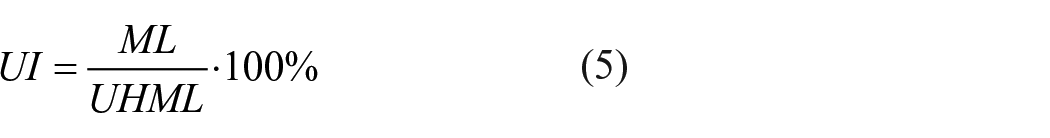
According to Hertel, 15 this UI is closely correlated with the coefficient of variation of the mean fibre length. From these three characteristic values, sufficient information for the achievable yarn and composite properties, fibre damaging at the individual process steps and adjustments of the textile machinery (e.g. roller distances of drafting systems) can be obtained, and are also given in this investigation.
Description of the adapted reference method
In order to calibrate the fibrograph method, information on the fibre length of CF and rCF prior to and after textile processing within a reference method is required.
This developed reference method is a combination of measuring the length of CF or rCF fibre bundles with a single fibre measuring method and calculating the number of fibres per bundle based on scanning and image processing.
As the central approach, it was demonstrated by Hengstermann et al. 23 that the number of fibres in rCF bundles (up to approximately 1000 fibres) linearly corresponds with their measured pixel values sum. Based on that information, it is possible to test long rCF while measuring the length of bundles with a single fibre measuring method, but without single fibre extraction from the rCF bundle. Subsequently, the number of fibres per bundle can be calculated by scanning and image processing.
From the known bundle length and number of fibres in each bundle, the MLR and UHMLR (by number) as well as the related standard deviation


where LB is the bundle length, NB is the related number of fibres in the bundle and nF is the total number of fibres. According to ISO 6989, 500 samples should be taken for the single fibre length measurement method, in addition the 95% confidence limit C should be <5%, which is calculated by
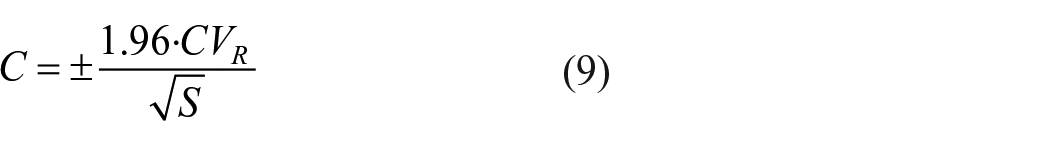
with S the sample size (=number of bundles) and the coefficient of variation in the average fibre distribution CVR by

Calibration of the adapted reference and fibrograph method
Calibration of the reference method
In a first step, image processing was evaluated based on different fibre bundles with known numbers of fibres in the bundles. Ten pre-defined bundle specimens were tested with approximately 40–1000 fibres per bundle and five bundles per specimen (Figure 6). The number of fibres in each bundle was counted beforehand manually. Due to the very low diameter (7 µm) of the single rCF, approximately 10% error in the number of the fibres can be considered.
Fibre bundles with approximately 100 (a) and 300 (b) fibres per bundle.
Subsequently, each bundle was scanned (scanning parameters identical with the adapted fibrograph method), and the resulting images were processed with the ImageJ software, 31 where the pixel value sum for each bundle was calculated and divided by the bundle pixel length. Based on this calculation, the relationship between the average pixel value sum of bundles and the known number of fibres in bundles was established and summarised as bundle factor.
Calibration of the fibrograph method
After the investigation of a reference method, the calibration process of the adapted fibrograph method was executed. Due to the decreased transparency of CF beard samples compared to samples with white or light grey natural fibres, the potential range of fibre amount within a beard was anticipated to be considerably smaller as well, thus facilitating a properly operating fibrograph method. Hence, the calibration process was initiated by precisely determining the optimum number of fibres in the fibre beard, using cut CF of equal length. For each CF cut length, 10 fibre beard samples, each with a different number of fibres, from rCF draw frame slivers were produced and tested.
Two fibre beard sample images are shown in Figure 7. To obtain information on the number of fibres per beard, fibres were cut at the clamp line after measuring and weighed on a scale. If the number of fibres is too low, the resulting fibre distribution is not representative in the sample beard. In contrast, if it is too high, smaller fibres are overlapped by longer ones and cannot be identified using the image processing method. In both cases, measurements do not yield proper results.

Sample fibre beards with 35 mm fibre length and different weights of cut beards: (a) 64.4 mg and (b) 128.5 mg.
After determining the appropriate number of fibres in the beard, the actual fibre length measurement within the fibrograph method can be calibrated. For this, the characteristic reference values MLR, UHMLR und UIR were determined as exactly as possible with the developed reference method first. For each CF cut length (30–45 mm nominal fibre length), 50 cut CF bundles were gently extracted from the slivers and measured manually with the help of two tweezers. In a next process step, each bundle was scanned to calculate the number of fibres in each bundle.
After determining the reference length, the characteristic values
Exemplary fibre length measurement of rCF with unknown length using the reference and fibrograph method
Subsequent to calibration with cut CF, the length of long rCF was determined. Thus, 10 fibre beard samples were prepared from slivers and tested by means of the adapted fibrograph method, and the
Results and discussion
Calibration of the reference method
The results of the established relationship between the number of fibres and the average pixel value of the bundles (=bundle factor) are presented in Table 2.
Calculation of the bundle factor for the reference fibre length.
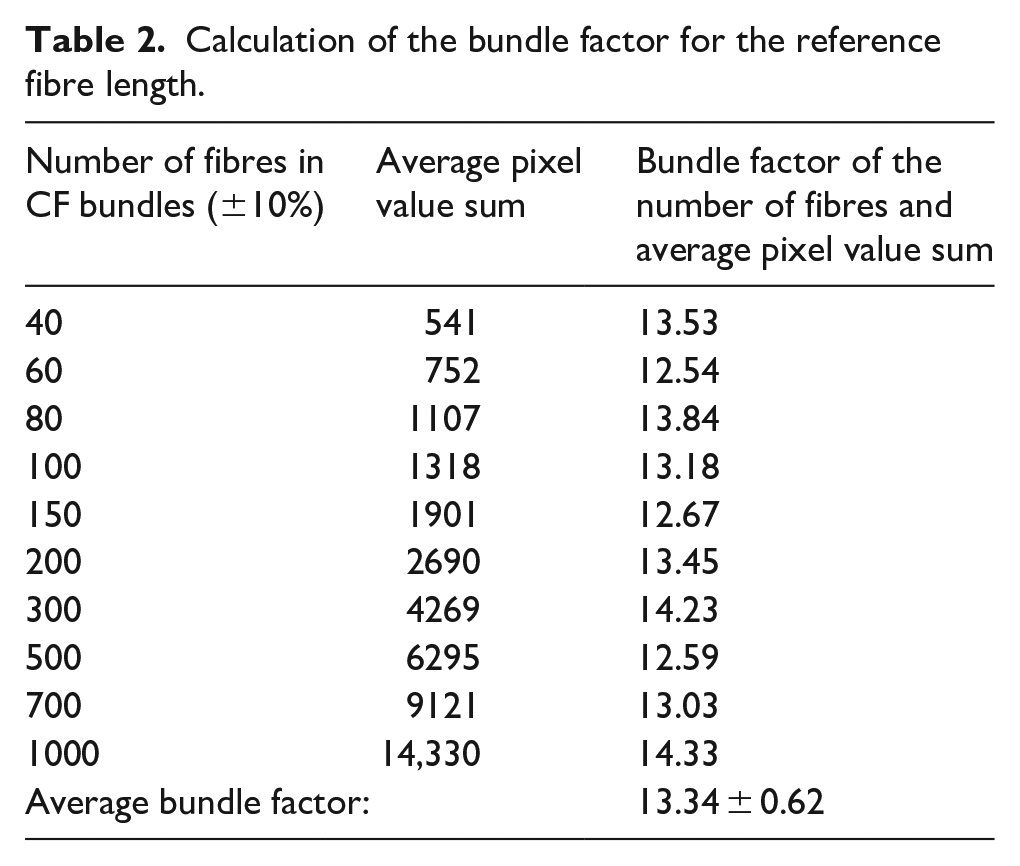
The presented investigation resulted in an average bundle factor of 13.34 ± 0.62 by use of the presented testing equipment and scanning parameters. This factor indicates the relationship between the number of fibres and the average pixel value sum of CF bundles. For example, a tested CF bundle with an average pixel value sum of 7588 contained approximately 569 ± 27 fibres.
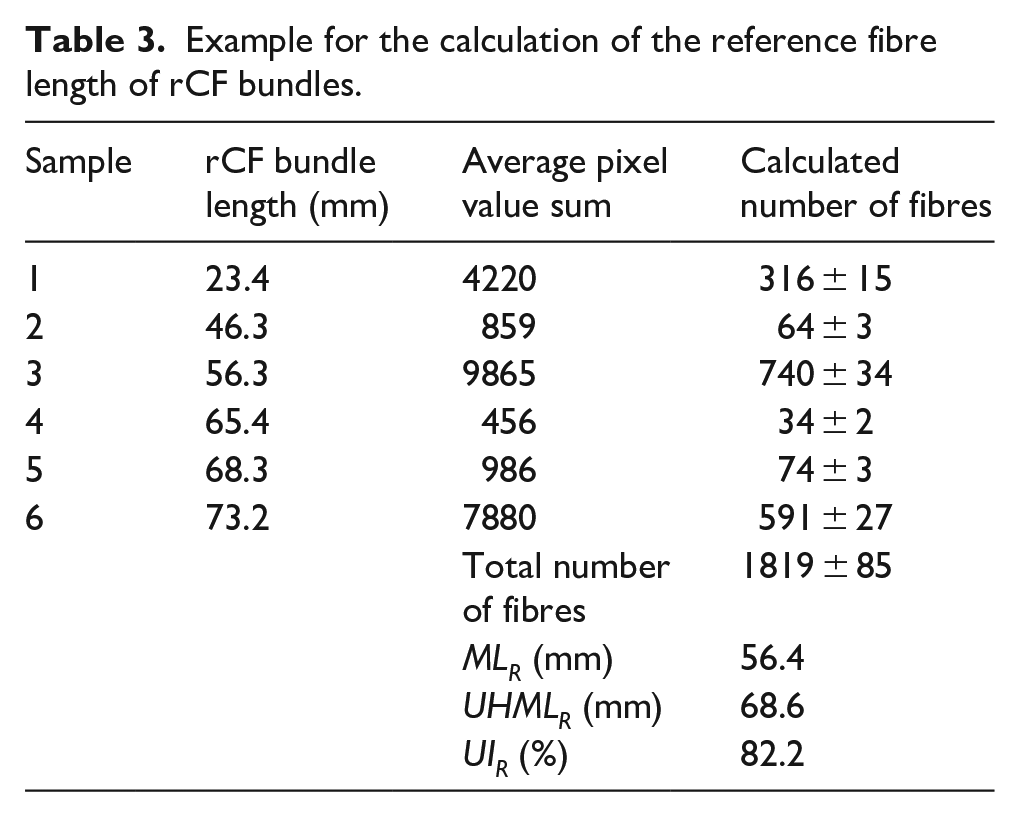
From the measured bundle length and number of fibres in the bundle, the reference (upper half) mean length (UH)MLR can be calculated. An example for this calculation is provided in Table 3 based on six rCF bundles.
Example for the calculation of the reference fibre length of rCF bundles.
Calibration of the fibrograph method
As all CF were of identical lengths in this test, a fibrogram graph F in the form of a straight line was anticipated (see Figure 5 (b)). To evaluate the variance of results caused by the changing number of fibres in the beards, the coefficient of determination (R²) for a linear fit was calculated, where R2 = 1.00 represents this perfectly straight line of the fibrogram graph F. Corresponding test results are listed in Table 4.
Fibre beard samples with identical length and varying number of fibres.

For better understanding, the influence of the different number of fibres in the fibre beard is exemplified in Figure 8. This figure clearly reveals that the straightness of the line considerably differs if the fibre count is either too high or too low.

Fibrogram of three samples with 35 mm fibre length and different numbers of fibres in the beard; the linear fit (R2 = 1.00) is illustrated as dotted line.
Results reveal that the best accuracy (=highest R2) was achieved with samples number 3, 3, 5 and 7 for 30, 35, 40 and 45 mm, respectively. This result can be explained by the proper number of fibres in the beard sample, where only very few fibres overlapped. However, weighing the fibres cut from the beard samples after image processing does not serve as indicator for the appropriate amount of fibres, as this value changes depending on fibre length. Hence, this method is particularly unsuitable for rCF due to their unknown length so that another solution approach was established (see Figure 9) by selecting the pixel value sum at 4 mm span length as reference, where nearly all fibres can be found.
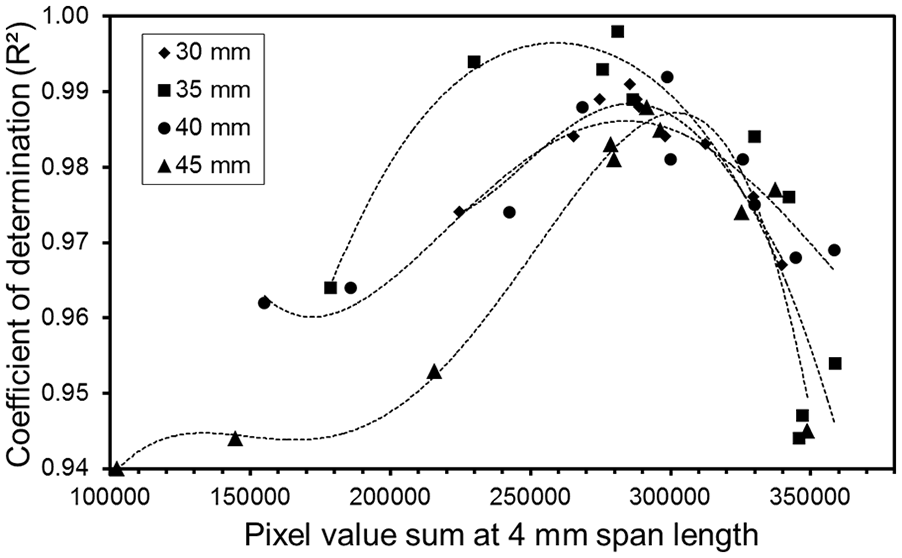
Relationship between the calculated coefficient of determination (R2) from Table 4 and the belonging pixel value sum at 4 mm span length; the graphs of the polynomial regressions are illustrated as dotted lines.
Figure 9 highlights that the highest R2 value approximately coincided with the same value of each pixel value sum at 4 mm for each fibre length sample. For the determination of this value, a fourth-order polynomial regression was set for every sample length, where each maximum was calculated and averaged, resulting in the value = 284,300 ± 17,808. For further testing, this value was set as characteristic pixel value index to examine whether the number of fibres in the fibre beard sample was appropriate, too high, or too low.
Afterwards, the fibre length of cut CF (30–45 mm nominal length) was investigated by the adapted reference method, and 10 samples of each cut CF length with previously determined, optimum number of fibres were finally tested using the adapted fibrograph method. Results are shown in Table 5.
Results of fibre length measurements after textile processing; with cut CF.

The measured average mean length results within the fibrograph method
However, a correction value is generally required when using the fibrograph method to determine the true fibre length of a sample because the fibres need to be fixed in the clamp. This results in the fact that the measured length values are always several millimetres shorter than the true fibre length. In the case of cotton fibres, a clamp holding length of 4.06 mm was reported by Krowicki and Thibodeaux.
32
In addition, for crimped fibres such as cotton or wool, the crimp cannot be eliminated within the fibrograph method, thus additionally shortening the tested fibre length. Hertel added a correction factor of 1.19 to the measured length values of cotton fibres for the calibration of the fibrograph system in Hertel.
15
However, in our case, it appears to be more appropriate to add a correction summand instead of a factor to every measured fibre length. This is particularly true for fibres with significantly higher lengths compared to cotton, as a correction factor has a more pronounced impact at higher lengths. Based on the previously described experimental setup, a clamp holding length of 8.1 mm was determined by calculating and averaging the difference values between MLR and
Exemplary fibre length measurement of rCF with unknown length using the reference and fibrograph method
In previous calibration tests, exclusively CF with known fibre lengths were investigated, whereby long rCF with unknown fibre length were examined in this final test. For the calculation of the rCF reference length after textile processing with

Fibre beard sample from rCF with unknown fibre length and averaged fibrogram from all 10 samples.
Results of fibre length measurements after textile processing; with rCF.

The fibre length distributions of the rCF length tested within the reference method before and after textile processing are shown in Figure 11. It can be seen that the fibre length distribution drastically changes, the MLR, UHMLR and UIR before textile processing was 75.6 mm, 90.6 mm and 83.4%, respectively. This is mainly attributed to the fact that the rCF with fibre lengths greater 45 mm are significantly shortened by the carding process.

Frequency histograms of rCF length tested within reference method before and after textile processing.
The results produced by the fibrograph method after textile processing showed an
The test duration with the adapted reference method with 500 rCF bundles was approximately 9 h, with the adapted fibrograph method with 10 fibre beard samples around 35 min.
Conclusion
In this article, a fibre length measurement system of long rCF in webs and slivers for subsequent yarn spinning based on an adapted fibrograph method was presented. According to the state of the art, it is estimated that this fibrograph method, measuring non-end-aligned fibre beard samples, is an appropriate and fast testing principle for the measuring of long rCF due to their specific fibre characteristics. Therefore, a self-built clamp was used and a conventional flatbed scanner was modified for the testing of fibre beards that consist of long rCF. By means of an alternative image processing technique compared to the original fibrograph device or USTER HVI, which involve the counting of greyscale values for each pixel of scanned fibre beard images, a fibrogram can be compiled, and the mean, upper half mean length and the uniformity index can be calculated. Since the appropriate number of fibres in a fibre beard is an essential factor for precise measuring, the pixel value sum at 4 mm span length (284,300 ± 17,808) was set as characteristic index for subsequent testing. Based on the presented experimental setup, a correction value of 8.1 mm was determined to compensate the clamp length and achieve the reference fibre length, whereby this value was based on measuring of different known fibre lengths by using an adapted reference measurement method. These established parameters of the adapted fibrograph method allow for precise length measurements, whereas the deviation of the tested length from the reference fibre length amounts to ±4%.
It is anticipated that the developed testing technique will facilitate the characterisation and quantification of fibre lengths of long rCF in webs and slivers, thus significantly optimising the textile processing of these fibres into hybrid yarn constructions.
Footnotes
Acknowledgements
This article presents parts of the results from the research program of the German Research Foundation (DFG CH 174/46-1) at the Technische Universität Dresden.
Declaration of conflicting interests
The author(s) declared no potential conflicts of interest with respect to the research, authorship and/or publication of this article.
Funding
The author(s) received no financial support for the research, authorship and/or publication of this article.