
Abstract
Conventional pullout test devices are mainly designed to measure the shear strength indices of the geosynthetics–soil interface. This article introduces a new model container to study the influence zone of geosynthetics in pullout test. Several basic image processing methods were employed to analyze the grain motion of two gravel compositions in pullout tests. The trajectories of grains in the gravel differ at different heights; specifically, a more active motion was observed if the grain was closer to the geosynthetics. Moreover, grains were found to move not only horizontally but also vertically as well as to rotate on pulling out the geosynthetics. The range of a grain on the move is almost constant during the pullout and determines the influence zone of the geosynthetics. Image processing revealed that the influence zone was eight times the average grain size above the geosynthetics and 4–5 times the average grain size below the geosynthetics. The boundary condition thus significantly affects the influence zone.
Introduction
Soils, reinforced using geosynthetics, have been used in the construction industry since the 1960s. A reasonable spacing maximizes the reinforcement effects. 1 Benefits of smaller reinforcement spacing for performance improvements in such soils were realized in both practical and experimental studies;2–5 in general, the results suggest that the smaller the spacing, the better the reinforcement efficiency. However, when the spacing is too small (less than 30 cm), reinforced soil exhibits behaviors different from that for normal spacings. It restricts the choice of soil in construction and even affects the construction efficiency.6–9
The agreement on the best reinforcement spacing has not been reached despite decades of research. The commonly used reinforcement spacing in a geosynthetic-reinforced-soil system is 20 cm under concentrated vertical loads, 9 whereas the value is larger being 60 cm according to Elton and Patawaran. 4 General construction specifications require the maximum spacing to be no more than 60 cm, whereas some limit it to 1 m. Nevertheless, in specific specifications (e.g. on earth and rock dams), the requirement for reinforcement spacing is less than 60 cm. A model test conducted on a geotextile-reinforced flexible abutment 10 found that a reasonable reinforcement spacing should be between 30 and 50 cm. In another test, 11 the best spacing with weathered clay soil was found to be about 30 cm. In practice, reinforced structures may be destroyed in earthquakes when the reinforced spacing exceeds 80 cm, and survive without damage at 60 cm (1999 Taiwan-set earthquake). 12 Considering factors such as reinforcement spacing greatly restricts the choice of soil in construction, it is necessary to conduct studies on the determination of a reasonable spacing. In narrowing down the best spacing, several meaningful studies have focused on soil–geosynthetic interactions such as geogrid properties influence, boundary conditions effect, and displacement rate.13–21 Aside from these studies, the influence zone of geosynthetics is deemed important in determining a reasonable reinforcement spacing. 22 This influence zone is governed by the thickness of the interface between soil and geosynthetics.
The interface thickness may be estimated using numerical simulation methods such as the discrete-element method (DEM). Various DEM simulation results showed that the thickness needs to be about 5–7 d50, 23 5 d50 or 10 d50,24,25 and 5–6 d50; 26 here d50 is the average grain size (diameter). Triaxial test DEM simulations of reinforced soil indicate that a relatively good reinforcement effect is obtained when the spacing is 15–25 d50. DEM analysis of triaxial and pullout tests 27 found the thickness of the interface to be about 13 d50.
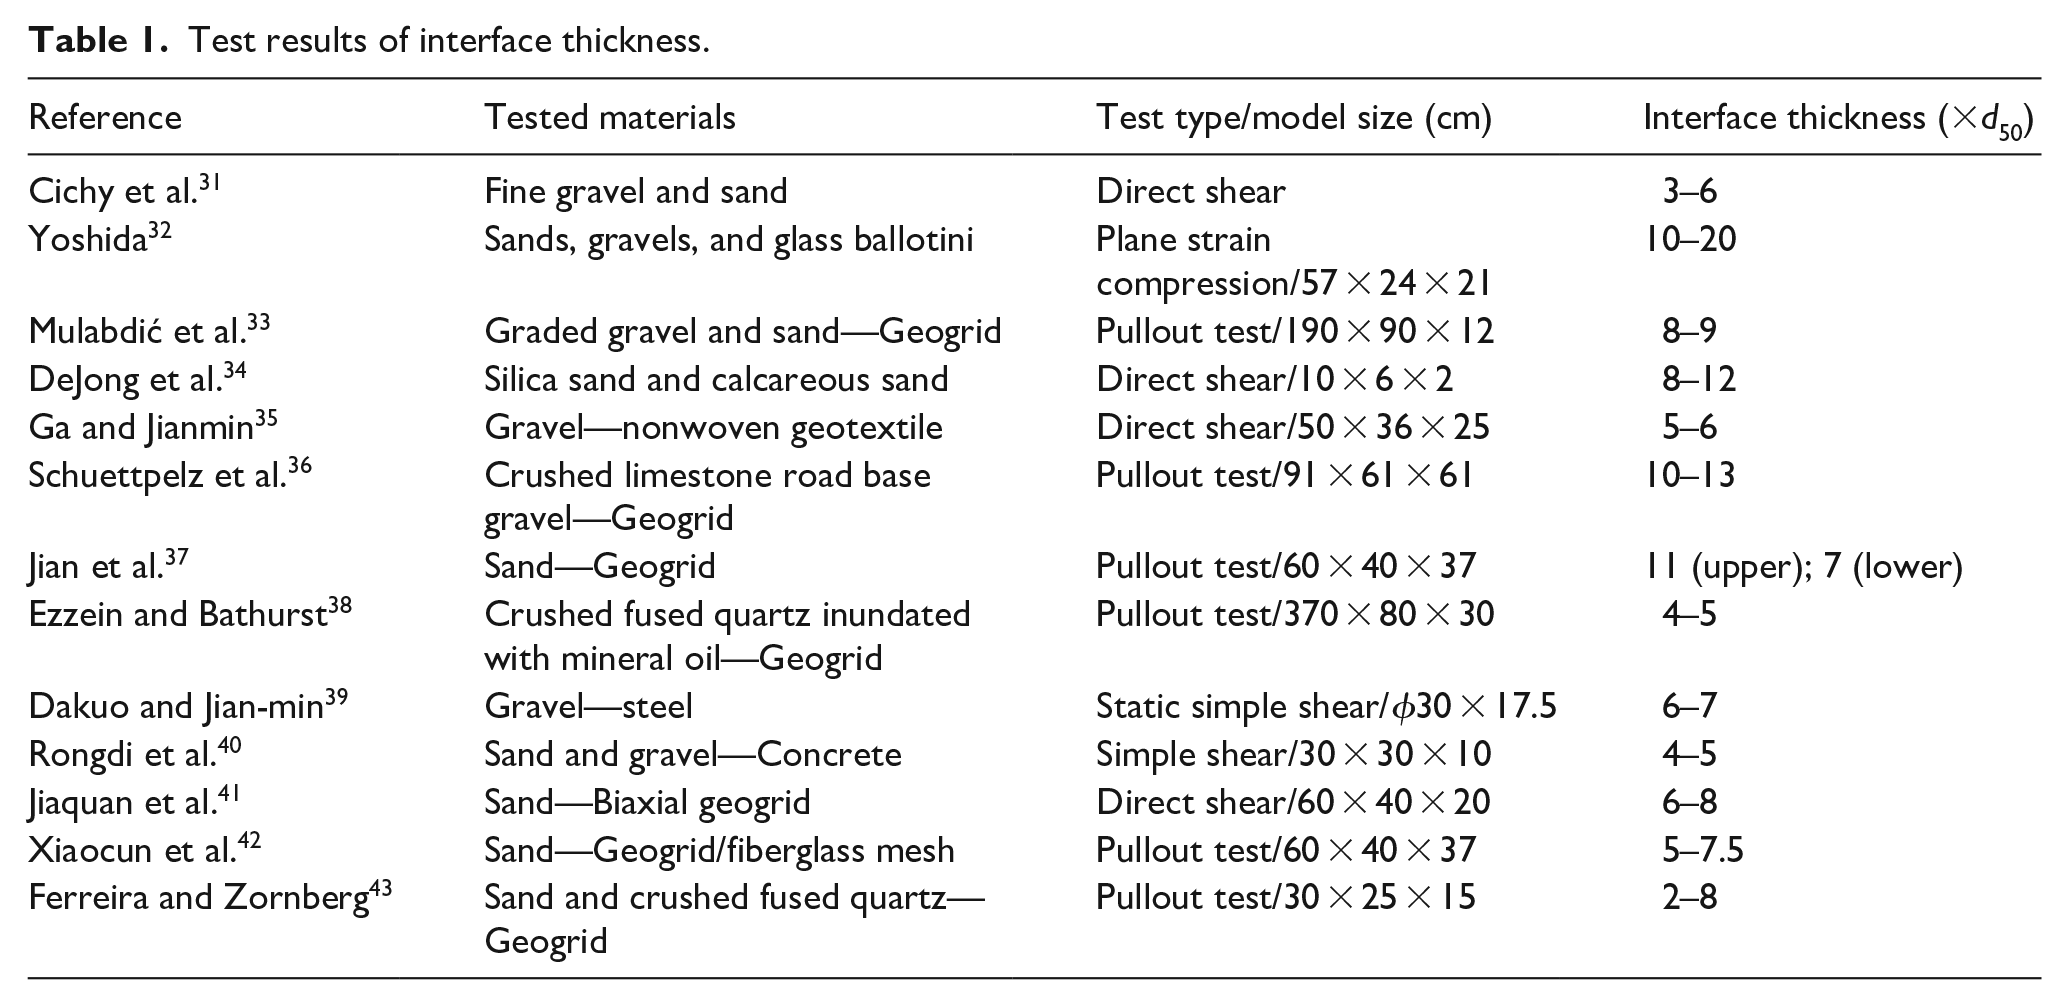
Laboratory experiments are also an effective way to study the influence zone. A laboratory parametric study 28 found that the ratio of interface thickness to adjacent element size ranges from 0.01 to 0.1. With the development of experimental techniques, a mesoscopic study on the characteristic of the influence zone of geosynthetics was achieved. Photographic methods were adopted by Uesugi et al. 29 to observe the movement of grains and the formation of shear band during shearing tests. Cyclic three-dimensional simple shear testing of interfaces (C3DSSI) was improved and provided recordings of the relative motion of the stack using digital photography. 30 Interface thicknesses ascertained in laboratory tests and reported in the literature (Table 1) indicate that the thinnest interface is 2 d50 and the thickest is 20 d50.
Test results of interface thickness.
In regard to soil–structure interaction, the types of experiments are various, including direct shear tests and pullout tests. Direct shear testing is a widely used method to investigate the mechanism underlying reinforcement.44–46 Such tests have been conducted to study the mechanical properties of soil–concrete interfaces 47 and established a hyperbolic relationship between shear stress and relative shear displacement. A similar test was conducted to study the frictional resistance at the sand–steel interface. 48 Some researchers also performed pullout tests to explore those factors influencing geogrids imbedded in granulated soil.49–53 The pullout characteristics of waste tire strips in a compacted sand were also examined and tested, 54 together with the uniaxial and biaxial geogrids under the same conditions. In addition to conventional devices used in the direct shear tests and pullout tests, some new devices were also invented to study the influence zone of geosynthetics; for example, a new device for cyclic testing of sand–concrete interfaces was invented by Desai et al., 28 and an apparatus called C3DSSI was invented to investigate the cyclic behavior of the interface.55,56 The aforementioned apparatuses are normally used to test the shear strength index between geosynthetics and soil, during which the size of the specimen, and especially its height, is always constrained. Without the employment of advanced sensing techniques,57–60 we present a simply designed model box for the pullout test in this article.
In addition, several image processing and target tracking methods have been extensively used in pullout test. Non-destructive X-ray radiography was used to study sand motion during geogrid pullout. 61 Particle image velocimetry (PIV) was adopted to examine the particle displacements and strain distribution of grains adjacent geogrids in pullout tests.62,63 Digital image correlation (DIC) was utilized to monitor the displacement of geosynthetics and surrounding target grains.43,64 This article uses simple image processing methods to study the influence zone of the interface.
Test device
Because the present pullout test mainly focuses on studying the influence zone of the interface, there is no need to examine the vertical and horizontal forces. Therefore, a simplified loading method and a model box was designed for our tests (Figure 1). The dimensions of the model box were 0.8 m (length) × 0.3 m (width) × 1.2 m (height). For a clear observation of the displacement of the soil grain, two vertical longitudinal panels, made of transparent tempered glass, were sectionally fixed to an aluminum alloy frame to form the model box. The panels on the other two vertical sides were 30 cm long and 10 cm high and can be disassembled into several segments. There is a 2-cm-wide pre-set gap in the surface of the panel on the pulling side. A manual runner (Figure 1) is operated to actuate a pulling force and is attached to the other side of the model box to produce a balance of forces. This simple but flexible runner was operated manually without other traction equipment. The ribs are wound around the shaft of the runner. This device enables the motion between the geosynthetics and the grains to be observed, thereby allowing the displacement distribution of the grains on both sides of the geosynthetics to be obtained aided by image processing methods.

Photograph of the pullout test device.
Properties of the materials
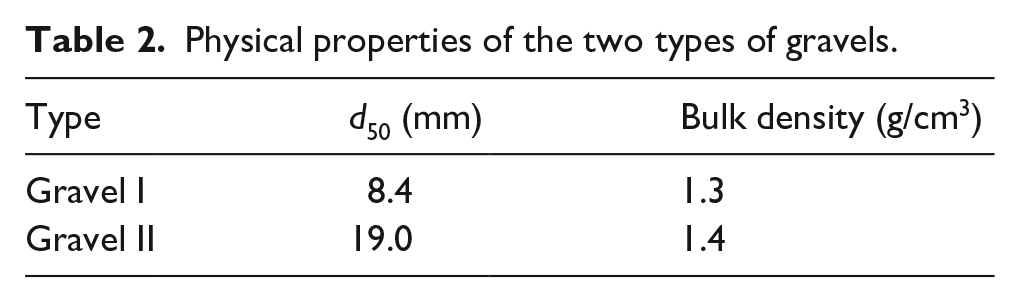
The filler used in the test was dry gravel of two types (labeled Gravel I and Gravel II) differing in grain size. Their grain size distribution curves were obtained in the test (Figure 2); their physical parameters were also measured (Table 2). According to Unified Soil Classification System (USCS), these two kinds of gravels belong to the poorly graded gravel type. Three different geosynthetics were used in the tests: canvas, uniaxial, and biaxial geogrid (Figure 3); their physical properties are provided by the suppliers and listed in Table 3.

Grain size distributions of (a) Gavel I and (b) Gavel II.
Physical properties of the two types of gravels.

Photographs of (a) canvas, (b) uniaxial geogrid, and (c) biaxial geogrid.
Physical properties of the geosynthetics.

A set of independent pullout tests, labeled A–D, were performed, in which, canvas and the uniaxial and biaxial geogrids were imbedded in different thickness of dry Gravel I and Gravel II (Table 4). In Table 4, the values in parentheses in the “Layout” column give the thicknesses of the gravels; L refers to the length of the geosynthetics imbedded in the soil. In the test, the surfaces of some grains were painted white and the filler was layered into the container by installing the side panel (10 cm high) several times and then filling up with soil until it reaches the predetermined height. Ten compact passes are conducted for each layer with a light plate vibratory compactor, whose compaction force is 50 kg. To start the test, we slowly rotated the runner and pull the geosynthetics out. A digital camera recorded the whole test process for later imaging analysis.
Layout and final sequence of pullout test.

Test results
Visible test phenomena
In several attempts, the grains were broken during the pullout (Figure 4). The layout and final sequence of different trials are listed in Table 4. In most tests, grains close to the pullout runner rose upward, whereas on the other side, they sank with the appearance of cracks on the surface (Figure 5). The measured maximum sinking was 3.6 cm in Test A. The main reason for this phenomenon is because the grains in the influence zone moved along with the geosynthetics, and therefore thrust upward; conversely, grains on the other side fell under gravity.

Photographs of broken geosynthetics in the tests.

Deformation of the gravel in pullout tests.
Outline of the influence zone
Image processing method
To outline the influence zone, the displacement of the grains at different heights were captured in video. Taking Test A from Table 4 as an example, we analyzed the movement of the grains using a simple image processing method: (1) 24 photos of the featured grain (i.e. t = 0–120 s) were captured at the interval of 5 s from the recorded video of the whole pullout process; (2) nine typical grains (Figure 6; labeled Grains 1–9) at different heights on the upper and lower sides of the geosynthetics were chosen; (3) for a specific characteristic grain, its central position at different moments was tracked by scanning each photo using a photograph browsing software redeveloped with AutoHotkey script language; (4) the centers of the nine characteristic grains at different moments on a single figure were drawn, and the 24 successive positions of each grain were connected in sequence, from which the trajectories of motion for each of the nine grains were generated.

Nine characteristic grains outlined in yellow and numbered 1–9.
Analysis of the results of image processing
In Test A, the trajectory of the motion of Grain 4 was analyzed (Figure 7); the arrows indicate the pullout direction, and the 24 dots along the trajectory represent the 24 selected instants. The grain moves to the left in the horizontal direction, whereas in the vertical direction, the grain initially moves upward then downward. Figure 8 shows the trajectories of motion of the nine featured grains, and Figure 9 shows the connected positions of the grains at different instants. We acquired the motion of the grains by comparing the positions at successive instants. By setting the initial position of the x-coordinate of the nine grains to zero, a displacement curve of each grain (Figure 10) was obtained. Thus, the value of the x-coordinate precisely represents the horizontal displacement.

Trajectory of the captured motion of Point 4.

Trajectories of the motion of the nine featured grains.

Locations of the nine featured grains at different time points.
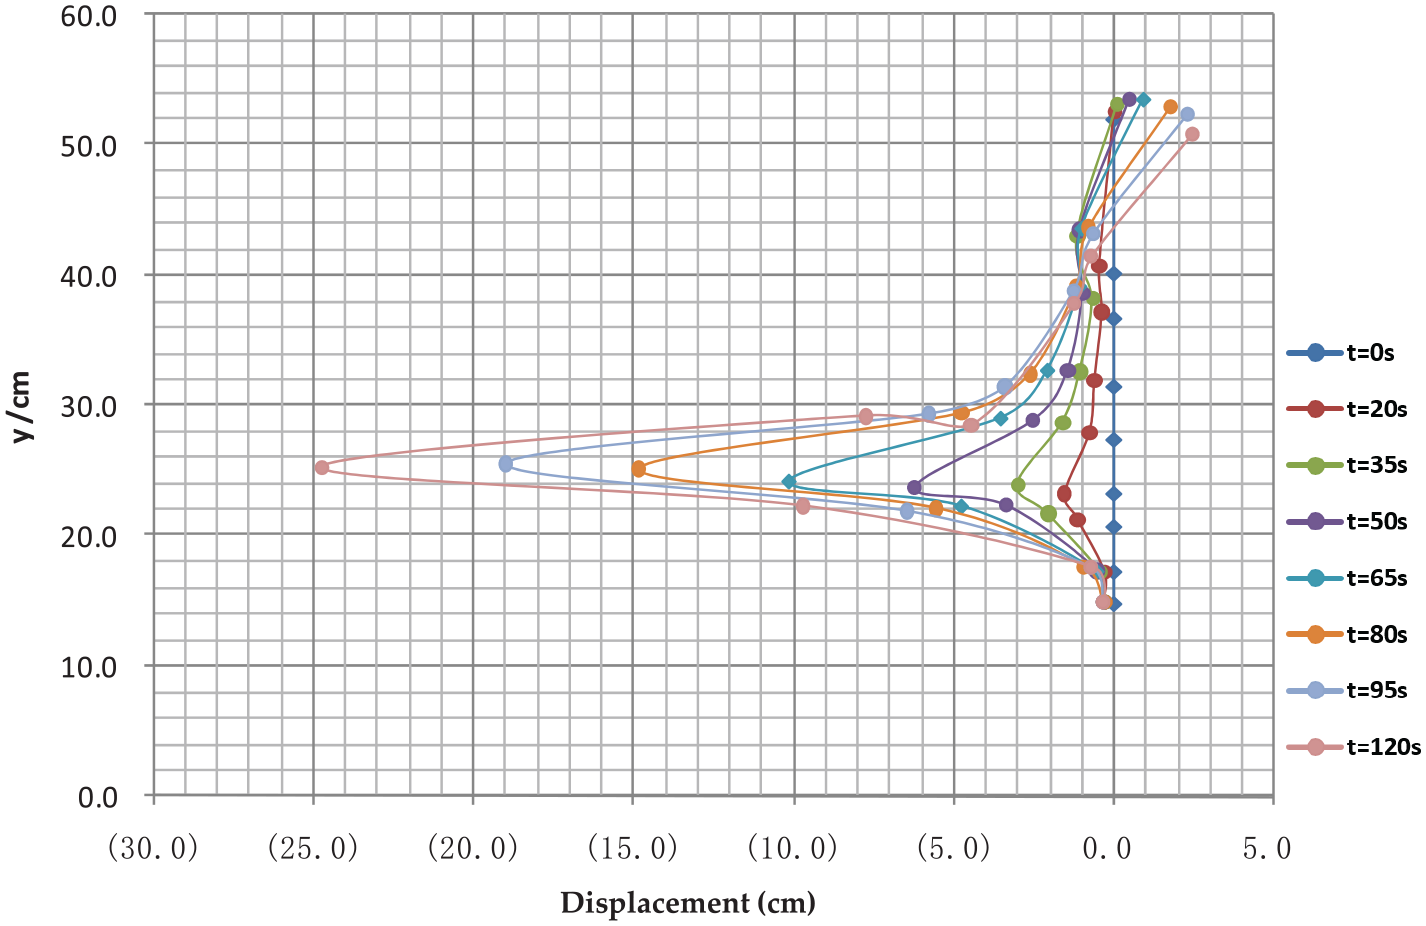
Displacements of the nine featured grains at different time points when setting the initial position of the x-coordinate to zero.
From Figures 8 to 10, the grain trajectories depend largely on the distance between the grain and the geosynthetics. Grains closer to the geosynthetics have larger horizontal displacements; those furthest away move in the opposite direction from the motion of the geosynthetics. Grains far above the geosynthetics have obvious vertical displacements; they initially rise and then fall. In contrast, grains below the geosynthetics barely move vertically.
Grains with zero horizontal displacements define the interface between the soil and the geosynthetics (Figure 10). We see that the lower influence zone ranges from about y = 15 cm to y = 24 cm, while the upper influence zone ranges from about y = 24 cm to y = 40 cm (grains that move in the opposite direction near the upper surface are excluded from the influence zone, as their movement lacks boundary constraint). In addition, the range of movement of the grains remains unchanged during the pullout process, indicating that the thickness of the gravel–geosynthetic interface remains constant.
As the average grain size of Gravel II was 1.9 cm, the thickness of the lower influence zone was therefore about five times the average grain size, and the upper influence zone was about eight times the grain size. The thicker upper influence zone is likely because the upper boundary condition is less constrained.
Application of supplementary image processing methods
To obtain intuitive insight into the motion of grains, we followed the motion of nine selected gravel grains by cutting the images of these grains out using Photoshop software and superimposing 24 successive images onto a single image (Figure 11). As seen in Figure 11(d), the movement directions of grains change while translating; this change in the movement direction (i.e. θ in Figure 11(d)) is more obvious if the grain is closer to the geosynthetics.

Relocation of some grains during the test: (a) initial positions of grains, t = 0 s, (b) superpositions of grains during pullout, t = 40 s, (c) superpositions of grains after the geosynthetics is pulled out, t = 80 s, and (d) generated trajectories of motion for the nine grains, t = 120 s.
The aforementioned results are limited to the nine selected grains. To develop the whole displacement field during pullout, a digital speckle correlation method (DSCM)-based software was used. 65 The basic principle for the DSCM in detecting the displacement of particles is to compare digital images of the displaced particles with the original one by adopting a mathematically well-defined correlation function based on some subset of pixels. 66 For this purpose, the contour schemes for the horizontal and the vertical displacements at t = 10, 60, and 120 s were obtained (Figures 12 and 13). In Figure 12, the thickness of the lower influence zone is about four times the average grain size, and the thickness of the upper influence zone is about eight times the average grain size. Both results are consistent with the previous analysis based on the particle displacement curve. Figure 13 shows that the gravel within the influence zone of the geosynthetics and adjacent to the runner was uplifted, whereas near the other end it subsided (consistent with the profile found in Figure 5). Moreover, the horizontal and vertical displacements grow during the pullout of the geosynthetics. The horizontal displacements of grains out of the influence zone (above and below the geosynthetics) are negligibly small; the vertical displacement of these outside grains above (below) the geosynthetics is large (small).

Contours of the horizontal displacements at three time points: (a) t = 10 s, (b) t = 60 s, and (c) t = 120 s.

Contours of the vertical displacement at three time points: (a) t = 10 s, (b) t = 60 s, and (c) t = 120 s.
Conclusion
A specially designed device for pullout tests was described, and independent tests with two different gravel beds were presented. The video taken during the tests were analyzed using several basic image processing methods, so that the motion of grains adjacent to the geosynthetics could be investigated. The main conclusions drawn are as follows:
Movement directions of grains change while being translated during the pullout process; both the rotational and translational motion of the grains are more obvious when they are closer to the geosynthetics.
Grains on the move are limited to a certain range during the pullout process; this range can be regarded as the influence zone of the geosynthetics during pullout. The thickness of the influence zone was found to be related to the grain size, but not to the relative grain–geosynthetics displacement.
The influence zone depends largely on the boundary condition; the thickness of the upper influence zone is found to be about eight times the average grain size, whereas that of the lower influence is only about 4–5 times. The main reason for the difference is that grains below the geosynthetics are strongly constrained by the bottom of the model box, whereas those above the geosynthetics are less constrained.
The horizontal movement of the grains out of the influence zone of the geosynthetics is not obvious; in contrast, the vertical motion of these grains above the geosynthetics is noticeable, whereas below the geosynthetics, it is negligible.
We note several shortcomings of the present pullout tests: (1) because a normal load cannot be applied by the pullout device, the normal stress on the geosynthetics is actually the weight of the filler, which differs influence from the soil–geosynthetics interaction in the actual setup; (2) the upper surface of the filler in the test is a free boundary; further investigations with a constraint applied to the upper surface are needed; (3) the model box is enclosed by rigid walls, which may also affect the motion of grains. Note that, in the design of reinforced earthworks, the spacing between layers of geosynthetics may be determined from the thickness of the influence zone. Regardless of these drawbacks, a spacing of no more than 10–13 times the average grain size is recommended from the test results given in this article. Nevertheless, this recommended value surely needs further verification considering the uncertainties arising from influential factors such as boundary conditions and load conditions.
Footnotes
Author contributions
Conceptualization was performed by Y.J. and H.W. Methodology, investigation, writing, original draft preparation, review and editing of manuscript, visualization of the study were performed by H.W. and J.F. Software and formal analysis were performed by H.W. Validation and data curation were done by T.Z. Resources, supervision, project administration, and funding acquisition were by Y.J.
Declaration of conflicting interests
The author(s) declared no potential conflicts of interest with respect to the research, authorship, and/or publication of this article.
Funding
The author(s) disclosed receipt of the following financial support for the research, authorship, and/or publication of this article: The research was funded by the National Key Research and Development Program of China (grant no. 2017YFC0404802), the National Natural Science Foundation of China (NSFC; grant no. 41790434), and the Key Research and Development Program of China Railway (grant no. K2019G033).