
Abstract
In this research article, System of Systems Methodologies framework has been extended in order to propose that System Dynamics approach has the capability to model and simulate the aspects of System of Systems. It, therefore, invokes a new concept of System of Systems Dynamics in the literature. Then, in order to perceive the practical implications, a case study account of a textile weaving organization has also been demonstrated. The organization under consideration had high cycle time due to unnecessary work in process, and reduced production capacity because of rolling blackouts. The study was conducted to model and modify the existing scenario intended to put forward a preferred future scenario. The proposed future state was constructed using selected Lean tools required to address the ongoing concerns. In order to realize the prospective Lean scenario, a capital investment model was run in relation with the setup developed to carry out capital budgeting for multi-fuel captive power plants. System of Systems Dynamics in the presence of lean concepts proved to be an intuitive and comprehensive approach for making strategic decisions. The model can serve as a planning tool to evaluate the financial impact on the overall profitability of the company under consideration.
Introduction
The goal of any manufacturing system is to produce the highest quality products in the shortest lead time possible with the least amount of resource investment delivered to the customer at the lowest possible cost. 1 But this goal is not an easy task and becomes a dream for many companies due to following basic reasons. The production system contains agents that are interconnected technologically and sociologically. The agents interact dynamically to give rise to complicated behaviour (technology–technology interactions) and complex behaviour (human–human and human–technology interactions). Such behaviour can lead local failures to global collapse specifically involving unpredictability of breakdowns, nonlinear interactions among parameters such as work in process (WIP), cycle time, throughput, information and material flows. The production organizations thus exist in a state of uncertainty, and as moving further away from equilibrium towards instability, they can undergo highly complex behaviour, 2 in the form of self-organization to induce innovations and creativity. 3 These organizations are also sensitive to initial conditions, and changing of one production parameter generates unpredictable outcomes resulting in a chaotic behaviour. The chaotic behaviour of production system emerges expressly from erratic issues related to quality (e.g. unseen defects), machine operations (e.g. machine breakdowns), human routines (e.g. workers’ strike) and so on. Exogenous factors also affect the production system due to, for example, customers’ behaviour (sudden change in demand), suppliers (cost and quality issues) and so on. Thus, it is recognized that the production systems are in a permanent state of development and, therefore, complex. 4 Broadly speaking, the complexity comes from heterogeneity among the systems, emergence in their behaviour and uncertainty of the environment. In addition, they possess peculiar characteristics of System of Systems (SoS),5–7 whereas SoS defining characteristics are as follows: Operational and Managerial Independence, Evolutionary Development, Emergent Behaviour and Geographic Distribution.8–11 SoS is a concept to synergize the autonomous systems made to operate for a common objective. It is, however, a new discipline with limited theory on how SoS develop and are managed. 12 The researchers are trying to figure out its true dimensions, simultaneously exploiting the hitherto established notions recognizably largely in defence area. In manufacturing sector, a formal SoS approach is necessary to understand the complex production dynamics. Adapting the SoS point of view to the field of manufacturing systems and introducing a ‘general purpose framework’ for different tools integration in a systemic and multidimensional logic could also be useful. 13
Since SoS including production systems is dynamic and different from each other having their own preferences, the performance functions of operational activities in one domain affect the processes of other domains. Therefore, the preferences are important to be analysed and optimized through new models and mechanisms to prevent the locally optimal decisions. Moreover, the evolutionary and emergent behaviour of SoS cannot be understood by analysing only the constituent parts due to nonlinearity present in the complex interactions of socio-technical systems. However, the modelling and simulation can fairly identify the patterns of interaction of complex dynamics. To this end, System Dynamics (SD) applying the modelling formalisms of causal loop with stock and flow diagrams (SFDs) can be used for SoS simulation due to a number of reasons detailed in the next section. Succinctly, it is contended that the modus operandi with which multiple divergent views are integrated to obtain the global effect designates SD (special case) as System of Systems Dynamics (SoSD). In this work, a due position for SoSD has also been allocated on the spectrum of SoS Methodologies. 14
The introduction of SoS approach in production system would require redesigning of manufacturing processes and operations, even layout of the factory to better monitor and communicate the shop floor activities. In order to remodel functions and processes, one possible choice comes from Lean practices. Lean manufacturing (LM) is a multi-facets concept of tools and techniques including Just in Time, Kanban, Cellular Manufacturing, Muda and so on.15,16 Procedurally, LM does not focus on direct control but effectuates it indirectly restricting the buffer through improved transparency and Kanban system. 17 It not only steers process improvement but also maintains the flow of processes. Therefore, the low-level supervision at factory floor is not required, and more autonomy is ceded to the systems. Despite the fact, a number of companies have difficulty achieving even a fraction of the benefits that Lean studies have shown. 18 This is because in Lean more emphasis is supposed to place on individual components rather than on their relationships – the underlying source of complexity. Moreover, to be effective, Lean should be in the strategic plan of the organization instead of an isolated strategy. 19 Considering the existing shortcomings, it is indispensable to think beyond Lean to reinvigorate and adapt it according to the changing requirements of the day. We integrate Lean with the cutting-edge conceptions of SoSD (Lean SoSD) to understand the complex production dynamics. The article attempts to provide strategic solution of technical relationships and managerial decisions by Lean SoSD methodology through case study of a textile mill. The relevant foundational work of this conception, named as Smart LM, can be looked up in Mahmood and Montagna. 6 The research work presented here is part of a series of SoS case studies performed in textile industry. In this specific field research work, Lean SoSD has been employed to counter the imminent threat to the company’s long-term strategic interests by evaluating the feasibility of captive generation of power at the case company situated in Pakistan.
The next section extends a generic framework of SoSM to characterize complexity in relation to the participant stakeholders with a broader view to categorizing systems and define a niche for SoS. Section ‘SoSD in Lean’ analyses SoSD in LM by constructing a causal loop diagram (CLD). Section ‘Case study: investment evaluation in a weaving mill’ illustrates a research case study accomplished in a weaving mill to delineate its reduced production capacity due to rolling blackouts, and to come up with a defensive electricity generation plan through captive power plants (CPP). The sub-sections model and simulate future scenarios with investment appraisal results. Finally, the last section concludes the article and the case study.
System of Systems Methodologies – extended
System of Systems Methodology (SoSM) 14 provides a choice framework for assigning an appropriate methodology to peculiar systemic complexities. The aforesaid framework offers to categorize systems methodologies with reference to the degree of complexity and stakeholders. We extend SoSM framework to understand the scope of various approaches and define a niche for SoS. SoSM has been mapped on two dimensions as shown in Figure 1. The horizontal dimension lays down three sets of stakeholders classifying them as unitary, pluralist and conflicting or coercive, put in order by intensifying diversity of interests and objectives. Unitary means that there is a singular or a common viewpoint among the stakeholders, pluralistic indicates diversified or multiple viewpoints, whereas conflicting signifies that viewpoints conflict with each other. The vertical dimension is also represented by three groups of systems as simple, complicated and complex, ordered by escalating complexity of interactions. More than that, we divide the entire plane into two sections, complexification and diversification, growing along the system axis and stakeholder axis, respectively.
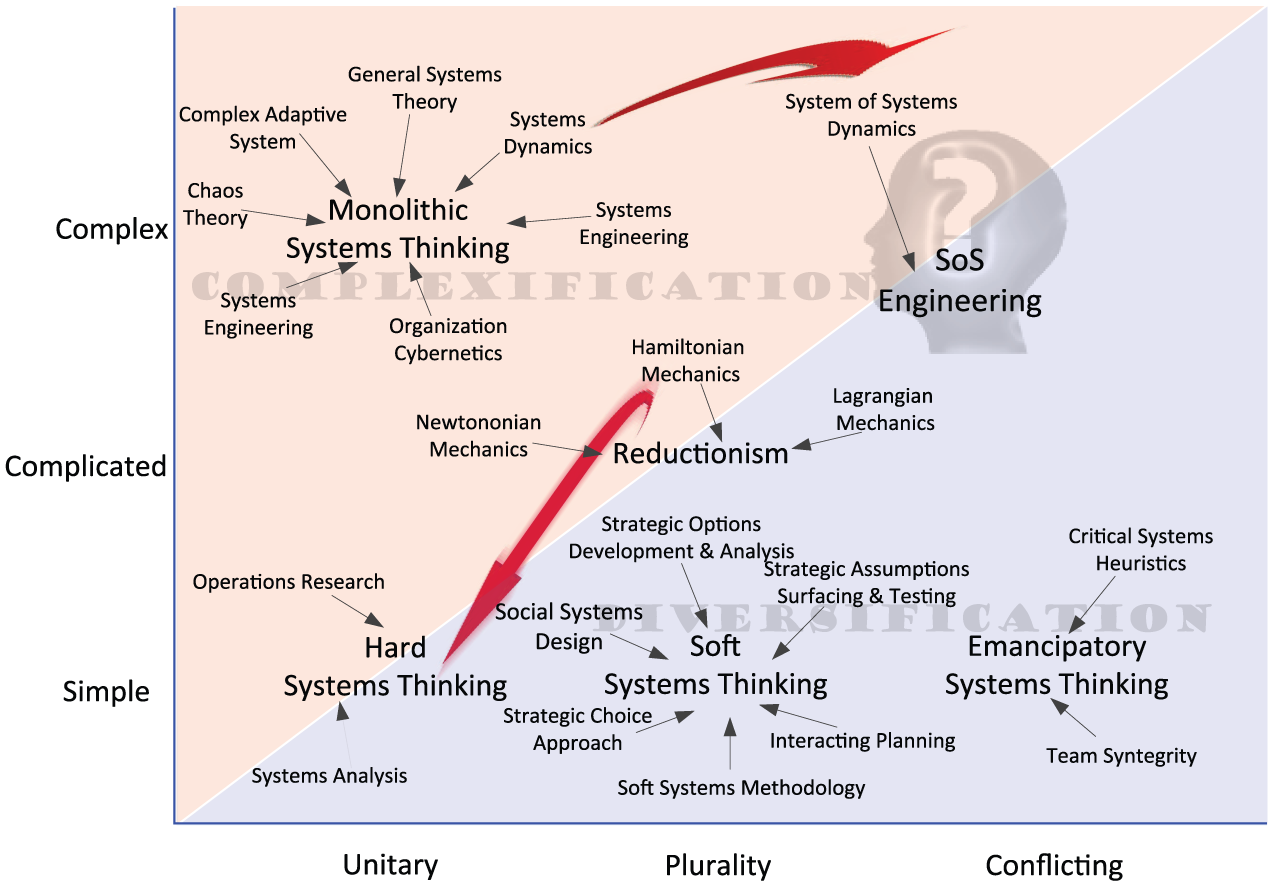
System of Systems Methodology – extended.
For the interest of brevity, only some of the SoSM approaches have been presented and outlined here. It is not necessarily valid that a certain kind of approach is better than the other, but instead each approach has a distinct scope that depends upon the type of system and the context in which the system is being operated. Moreover, one method or technique is not limited to a specified group of systems but can also be extended in multiple domains as a combination with other mechanisms.
First, the problems of simple-unitary nature can be addressed by hard approaches such as Operations Research (OR) and Systems Analysis. Checkland 20 places such approaches under the umbrella of hard systems thinking. Hard approaches focus on methodological and mathematical modelling aspects, and, therefore, they can solve issues related to scheduling, queuing, routing, inventory and so on. But with such an approach people are treated as constants rather than variables. Furthermore, hard OR appears to be a uni-dimensional approach that has limitations for complexity and plurality. As a consequence, when the relationships are impossible to model mathematically, hard approaches turn out to be really hard to apply for complex issues. When the diversity of stakeholders is introduced in simplex systems, the category of systems transforms into simple-pluralist which can be manoeuvred by Soft Systems Thinking. Soft techniques are employed for complex organizational issues concerning nonlinear systems of multiple causally related loops. Soft OR results in qualitative solutions to differ from classical OR by the fact that the former designates people as problem solvers and decision makers. These approaches include Soft Systems Methodology (SSM), Strategic Options Development and Analysis (SODA), Interactive Planning, Social Systems Design (SSD), Strategic Assumptions Surfacing and Testing (SAST), Strategic Choice Approach (SCA) and so on. When diversification of stakeholders in terms of interests and objectives increases to the extent that no compromise is attainable, it enters the realm of simple-conflicting area. In this region, Emancipatory Systems Approaches – Critical Systems Heuristics (CSH) and Team Syntegrity – deal with these types of systemic issues.
The horizontal region just above the simple systems constitutes systems having problems of complicated nature. These systems show structural complexity rather than behavioural complexity; therefore, emergence is not associated with them. Reduction techniques are used to investigate these complicated systems; the problem is reduced to simple variables by Newtonian mechanics, Lagrangian mechanics or Hamiltonian mechanics and dealt with alike. While the problems extended far on vertical axis are of complex-unitary nature. The systems in this zone are either literally monolithic or behave in a monolithic fashion exhibiting unitary consensus over objectives. The issues linked with these systems are worked out by the methods such as SD, Systems Engineering, Complexity Theory, CAS, General Systems Theory, Chaos theory and Organization Cybernetics.
As a final point, the systems that are found on the continuum of increasing complexity and divergence pose challenges in understanding and managing them. These systems that lie between Complex-Pluralistic and Complex-Conflicting areas are known to be System of Systems. To be more precise, such systems are found at the interface of Complexification and Diversification where the context is diversely complex. The former comprises complexity dominated by technical aspects, while the latter is composed of social complexity due to the involvement of stakeholders. The question mark at this confluence implies that a lot of explorative study is needed in this discipline. The underlying challenge is that the multiple stakeholders with conflicting interests and objectives be made to work together in a formal context while maintaining their autonomy. Bridging this gap with the multi-pronged and multi-disciplinary approach is the dedicated domain of SoS Engineering.
As has been mapped out and mentioned earlier, SD is apt for unitary-complex issues. It is a continuous computer-aided simulation method differentiated from discrete-event simulation (DES) by the fact that it helps understand not only the correlation but also the underlying causality. This aspect of the technique is extremely important in SoS where complexity lies due to interaction of the agents at lower levels upon reacting feedbacks and nonlinear effects of causal relationships. Assuming this view for continuous unearthing and understanding of the causal relationships might eventually help our journey from indeterminism to determinism in the SoS world. A special case of SD is said to be SoSD due to the presence of following common key points in SD and SoS:
SoS are socio-technical systems in which ‘human-in-the-loop’ factor is important. SD modelling technique has the capability to capture complexity of the real world by modelling both the behaviour of systems and intervention by human.
Since SoS are distributed and decentralized, multiple disparate models of trans-domain contexts are needed to build and assimilate to simulate the SoS behaviour. SD presents holistic view by simultaneously exploring the interactions at system and subsystem levels. Instead of monolithic simulation, the heterogeneous systems can also be simulated separately and in relation (interacting) with other systems with the flexibility that particular area of a system can be analysed in detail. Therefore, construction of the model of models is possible to observe the holistic view and achieve global optimization. Thus, the conflicting viewpoints of diverse groups and stakeholders in multilevel and multidimensional structures of SoS can be accommodated.
SD methodology is an approach that includes nonlinearity in its simulation due to the following: Nonlinear interactions (positive feedback loops). SoS are reactive systems having complex information feedback mechanisms. The multiple interacting feedback loops are coupled and nonlinear which show the effects of dynamic complexity. The overall self-organizing behaviour of SoS is understood through comprehending connectivity and interaction between the positive and negative feedback loops. Delays in cause and effect. Uncertainty and control are the characteristics of SoS modelling which become more significant when temporal outcomes have repercussions. In other words, cause and its effect have distant relations due to the presence of buffer of time that lead to nonlinear behaviour.
The systems embedded into SoS remain no longer independent and their behaviour is deep rooted in the interconnectedness. The inability of SoS to be reduced behaviourally to micro level (as against complicated systems) through decomposition is termed as complex emergent behaviour. SD is best suited to analyse SoS because it captures the dynamic relationships and feedbacks of the integrated systems without decomposing them.
The continuous behavioural feedback of SoS requires continuous decision making by process modelling of SD.
In addition, SD can capture hard and soft data, multitude of variables, large scale systems and so on.
Thus, SoSD through continuous modelling can be used to investigate the impact of system structure on decisions and vice versa over a long period of time. Although the present tools and concepts of SoSD may not be sufficient to meet SoS requirements, it can be enhanced along with the SoS concepts itself. SoSD addition into the repertoires of SoS Engineers will surely enrich the SoS way of thinking by capturing the multifaceted aspects.
SoSD in Lean
Tracing exact causal relationships in complex systems is an unattainable job; however, CLD of SoSD can provide understanding of the systems by identifying a number of factors, variables and their feedbacks. Often, CLDs are useful for analysing systems with multiple feedback loops, 21 as well as for exploring SoS with complex reactive loops. The multiple systems of manufacturing also generate dynamic behaviour due to interdependency and feedback structures. It creates implications for decision-making process, for example, maintenance affects production output, quality and scheduling; the scheduling in turn can disturb the raw material availability and vice versa. The qualitative intricacies, baffling links and vicious circles of production systems can intuitively be captured in a CLD. Before quantitative analysis, CLD has been developed for generic methodological scenario analysis of interrelated factors vis-à-vis Lean tools in SoS organizational perspective as shown in Figure 2. Gazing at the simplified Lean SoSD, it can be observed that the dynamics of manufacturing decisions and actions of maintenance, production planning, inventory control, employee and customer satisfaction loops and so on are interdependent.

A causal loop diagram for Lean System of Systems Dynamics.
The various feedback loops responsible for complex predicament can be traced out including that marked in the causative structure. In these loops, certain parameters are of decisive nature that has potential to dramatically change the scenario to 180°. It can be spotted that the Lean initiatives through various tools ultimately decrease both lead time and cost of production. The tools such as VSM, poka yoke, kaizen and jidoka have direct impact on quality, while JIT, 5S, SMED, Kanban and lot size mostly deal with responsiveness. The pace and economy of the production processes are controlled by implementing pull strategies throughout the value chain. The several factors and their effects are in play, for example, introducing pull system ultimately causes customer satisfaction, and likewise, suppliers’ partnership reinforces the profit margins to satisfy employees and so on. The segment Customer Focused System containing the loop ‘Customer Satisfaction’ plays dominant role in the overall behaviour of the system. The loop describes the dynamic interactions of quality, stock and uncertainty in demand. In maintenance system, maintenance autonomy of the organization is ensured through total productive maintenance (TPM) and visual controls. TPM in the loop requires a shift in responsibilities, for instance, the machine operators are involved by assigning the additional basic tasks of cleaning, inspecting, routine maintenance, oiling and greasing.
The endogenous factors are not restricted to premises of the factory and almost hit every other factor directly or indirectly. For example, high ‘unplanned breakdowns’ intensify ‘production pressure’ which in turn has direct impact on employee’s performance, production, maintenance and quality parameters. The reverberations pass on to marketing department and eventually influence the customers to hit back in the form of ‘production pressure’. But with the prudent holistic root cause analysis, such no-win situations can be avoided proactively. Thereupon, as to keep the favourable outcome at higher level, the task of a good management is to regulate and manipulate the variables accordingly when a new state emerges.
Case study: investment evaluation in a weaving mill
Materials and methods
The implementation of the concept has been demonstrated through SoSD case study methodology using quantitative data. The authors have embarked on a series of case studies and explorative work about application of SoS approach in manufacturing with a focus on LM.6,22 Thus, this research is an extension to previous published and ‘under-peer-review’ work and specifically analyses the long-term strategic objectives of a company.
The mills manager of the case company was initially contacted via phone to familiarize the blueprint of research and seek permission for executing the case study. Later, the formal procedures were finalized during a personal meeting. Grappled with the threat of losing customers due to constrained capacity issues, the research in the company was directed to explore the operational and economic aspects of a capital investment. The research premise was that the application of Lean SoSD would boost decision-making process, reduce WIP, lead time and enhance the operational visibility. The specific query was that whether the equivalent production loss due to rolling blackouts be outsourced or to utilize full capacity by capital financing? The broader objective, however, was to carry out exhaustive study on the subject matter to minimalize the gap between theory and practice opening the door for further research.
A small group which was named as ‘SoS Dynamists’ was involved except for technical construction of equations and parameters in the model. The primary author had the principal responsibility for data collection and analysis, modelling process and interpretation for financial and economic evaluation. The sequence followed for the implementation of the research work is as follows: problem identification; extraction of variables from conceptual CLD; and the modelling intervention to be Lean and for analysis of economical decision effectiveness through Vensim®. The project extended over a period of several months. Hereafter, the background and scenarios of the case study would be discussed.
Case study background
This quantitative research section has been compiled during the comprehensive case study accomplished for the process improvements of a weaving mill – a sector of textile value chain. The weaving mill for this research was chosen from central Punjab, which is the most industrialized province of Pakistan (South Asia). Textile and clothing (T&C) sector is the biggest industry and economic engine of Pakistan’s industrial growth. The longest production chain absorbs 40% of the total local workforce. It is the topmost foreign exchange earner (around 60%) and contributes 8% to the national gross domestic product (GDP). 23
Despite the outperformance and sustained growth over the past years, the sector is currently unable to fulfil local and international commitments due to the worst energy crisis in the country. The unavailability and high cost of electricity is a key obstacle for value addition in the textile industry. The insufficient energy provision has brought the industry to the brink of closure by restricting the capacity utilization to only 60%. 23 Despite investments in generation capacity, electricity demand continues to exceed supply causing blackouts as long as 8–10 h/day in cities and sometimes double that in rural areas and is widely recognized as a severe obstacle to growth and poverty reduction. 24 Naturally, the offset strategy is to generate electricity through CPP, but it is a double-edged sword as it multiplies the cost of production as well. Nevertheless, in the following, it is circumstantiated that how a prudent mixed source of electricity can develop CPP into a viable option.
Vensim model description and scenarios
Processes involved
The mill under observation comprises 252 looms of Tsudakoma Japan, three sheds of 72 looms and one small shed of 36 looms. The unit is manufacturing 65–85 different qualities utilizing the raw material of yarn from Ne 8/1 to Ne 100/1 to cater to customers of wide range. The production capacity of the company is 3.9 million metres per month on average depending upon picks per inch. But currently the plant is capacity constrained and producing monthly 2.6 million metres only due to rolling blackouts of about 8 h/day. In order to understand the scenarios well, it is necessary to possess the basic understanding of weaving processes; please refer to Adanur 25 for the complete description.
Existing scenario
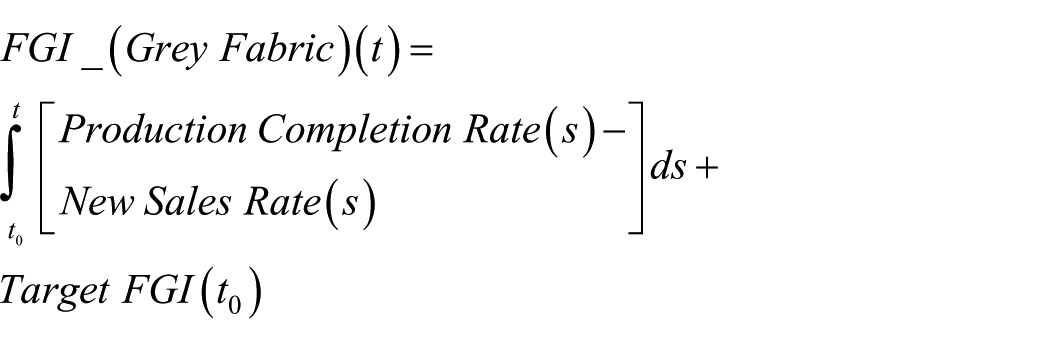
It is difficult to identify information and material flows in a conceptual CLD; hence, the SFD has been constructed to create dynamicity, mathematical equations and quantification of parameters. The stocks are accumulation of information or material, and the flows are rates to be added or subtracted from these stocks. The relevant variables have been taken from the CLD already developed (Figure 2) to construct SFD for both the scenarios. The prevailing circumstances of the mill have been reconstructed in Vensim as shown in Figure 3. The simulation started at time zero, setting the TIME STEP 1.5 h for a period of 100 days. The equations related to the model are as follows


The current model.
The model operates under the assumption that the processes do never starve as a result of raw material unavailability and that no waste is produced during the process. Since the model is not tailored to indulge at micro details but to aggregate the dynamics of activities for making macro-level global decisions, the product varieties of the company have not been introduced here. For modelling purposes, if there are threshold values, the nth ORDER DELAY or CONVEYER is a better choice which accumulates quantities at a particular point to create a very steep peak in the outflow. But being concerned with the average flow time of the entities rather than their threshold values, a third-order delay is a good approximation that signals a smooth response to any change in the system’s behaviour. Therefore, the model has been built upon a third-order delay to simulate the two-step production system.
In normal circumstances, the mill has advance orders for 2–3 months to dispatch shipments to Italy, Germany and Spain with the Delivery Time of 30 days. The historical sales data have been used as an input to forecast Sales Order. The specific market demand for the considered mill has been turned into stochastic sales orders with dependent distribution. Since the white noise is independent and non-correlated, the large models absorb the feedback shocks and the model remains unaltered. On the contrary, pink noise causes the model to behave like a real world 26 by bringing about attenuation based on frequency highlighting the small variations while absorbing the large fluctuations over a short period of time. Therefore, white noise has been transformed into auto-correlated pink noise of the first order exponential, smoothing the delay of white noise with various functions such as Ramp, Pulse and Sine functions as shown in Figure 4.
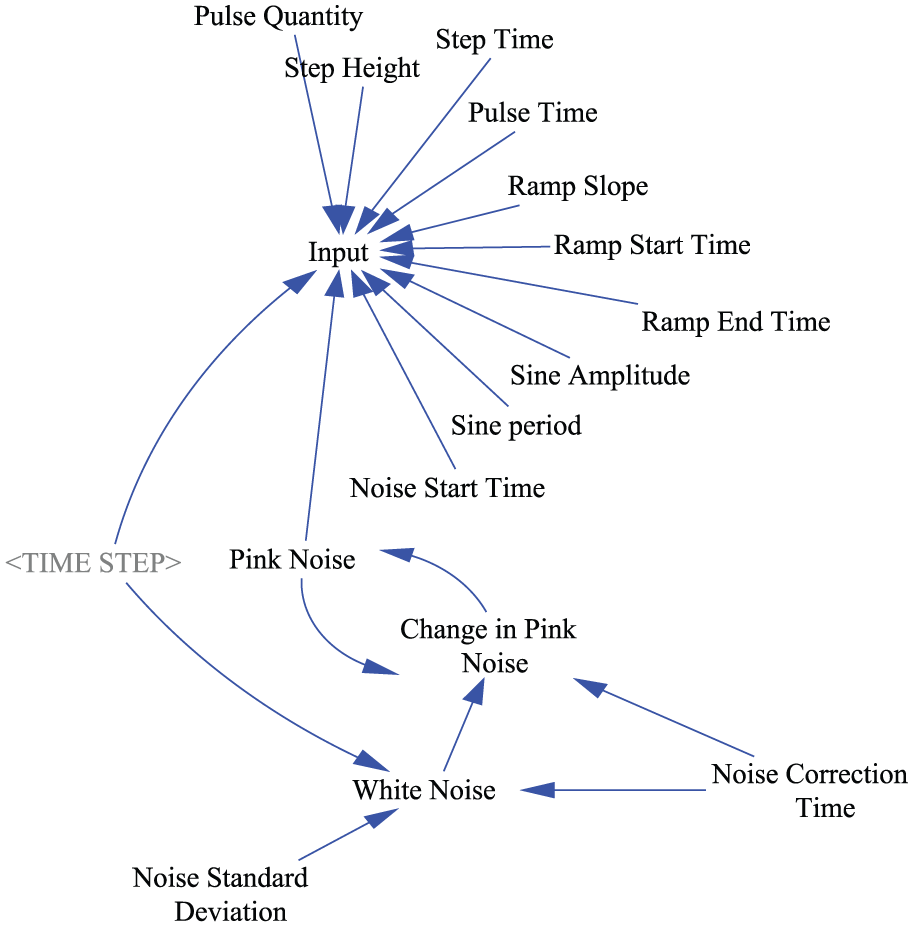
Input to sales order showing various functions.
The equation for input to Sales Order is as follows


Thus, by virtue of pink noise, more realistic sales dynamics have been retrieved, as can be observed in Figure 5.

Cycle time and sales rate of current scenario.
The flat upper bound of the sales behaviour indicates that the profitable sales have been rejected due to capacity constraints faced by the rolling blackouts. A total shutdown of 8 h/day has reduced the daily production from 130,000–87,000 m. Consequently, as ad hoc measures, some orders equivalents to ‘decrease in production’ have been outsourced to Karachi (another city that does not have such blackouts) to avoid claims for delayed deliveries. Another problem (partly linked with this issue) was the malpractice to accumulate mountains of WIP causing labour either idle or extremely engaged on and off. That, in turn, inflated the manufacturing cycle time up to 5 days putting a barrier to initiate new urgent orders, sometimes suffering their loss. This routine was just the reverse of Lean philosophy that has also been taken up and addressed in the future scenario.
Future scenario (the Lean model)
The future Lean model where upstream and downstream processes are driven by pull system has been constructed as illustrated in Figure 6. The realization of the Lean state requires investment in captive power generation. The logic together with resilience of the model has been expressed below.
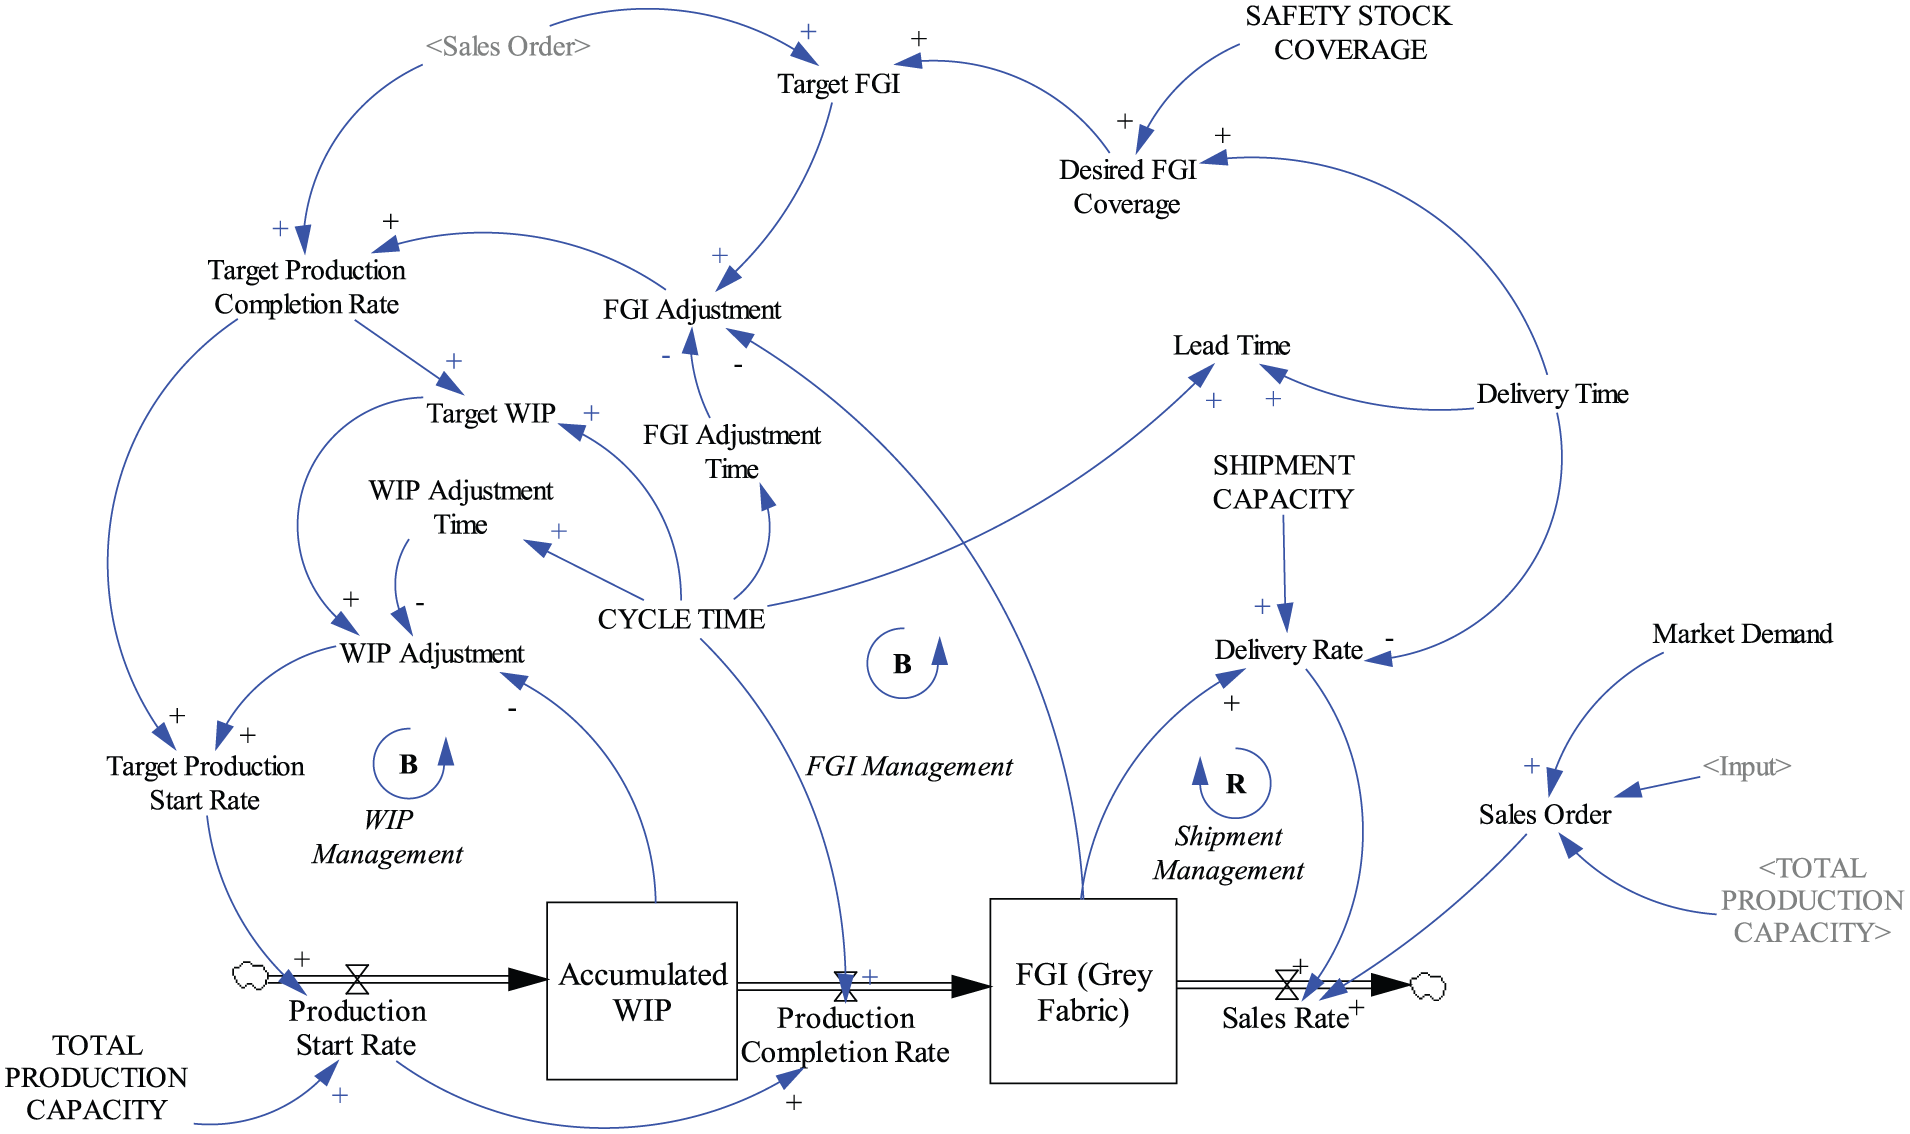
The Lean model.
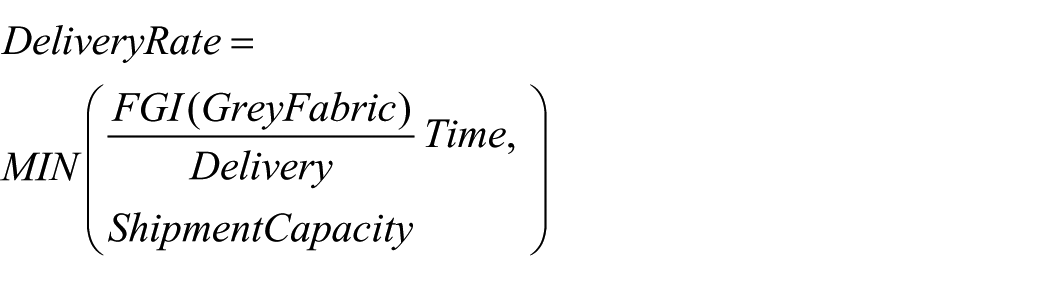
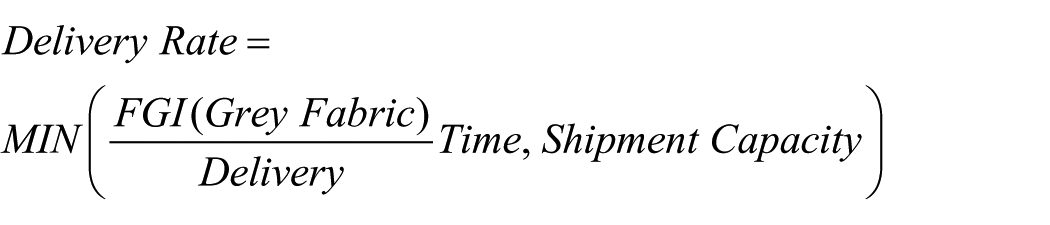
The model is managed through different loops such as WIP Management and FGI Management marking the first-order delay in their adjustments. The process has predefined limitations of holding capacities for WIP and FGI. These capacity constraints are inherently met by the Target WIP and the Target FGI which successively are controlled by cycle time, safety stock coverage and delivery time delay. After keenly observing the model, it was decided to put ‘maximum limit’ equivalent to Total Production Capacity to the Sales Orders. Removing this cap would create unnecessary ‘thrill’ in the system when demand is more than what can be manufactured. In contrast to reality, it would inflate model parameters such as Target WIP and Target Inventory, and assuming these quantities as initial values for WIP and FGI might create pile of inventories at the outset that has to be flattened with the elapse of modelling time. The Target Production Start Rate takes feedback from two balancing loops of ‘WIP Management’ and ‘FGI Management’ coupled with an exogenous variable, ‘Sales Order’. In a stable environment under pull strategies, the system finally finds equilibrium where delivery rate is equal to Production Start Rate (PSR). The PSR is set minimum of the values of maximum production capacity or the rate required by the downstream operations. Such considerations turned the model lean and more robust for extreme cases. Incidentally, the model was validated by assigning the outmost values to input variables.
Figure 7 shows lean behaviour of sales as a result of full production capacity and reduced cycle time of 2.5 days. The production is envisaged to be shipped depending upon the sales orders that comply with the following shipping pattern. If the batches of production are dispatched from the FGI stock, a signal will be sent back to the downstream workstations to pull the processes; otherwise, a new order will be placed in the queue. Now, the following segment would evaluate the investment feasibility to realize future scenario.
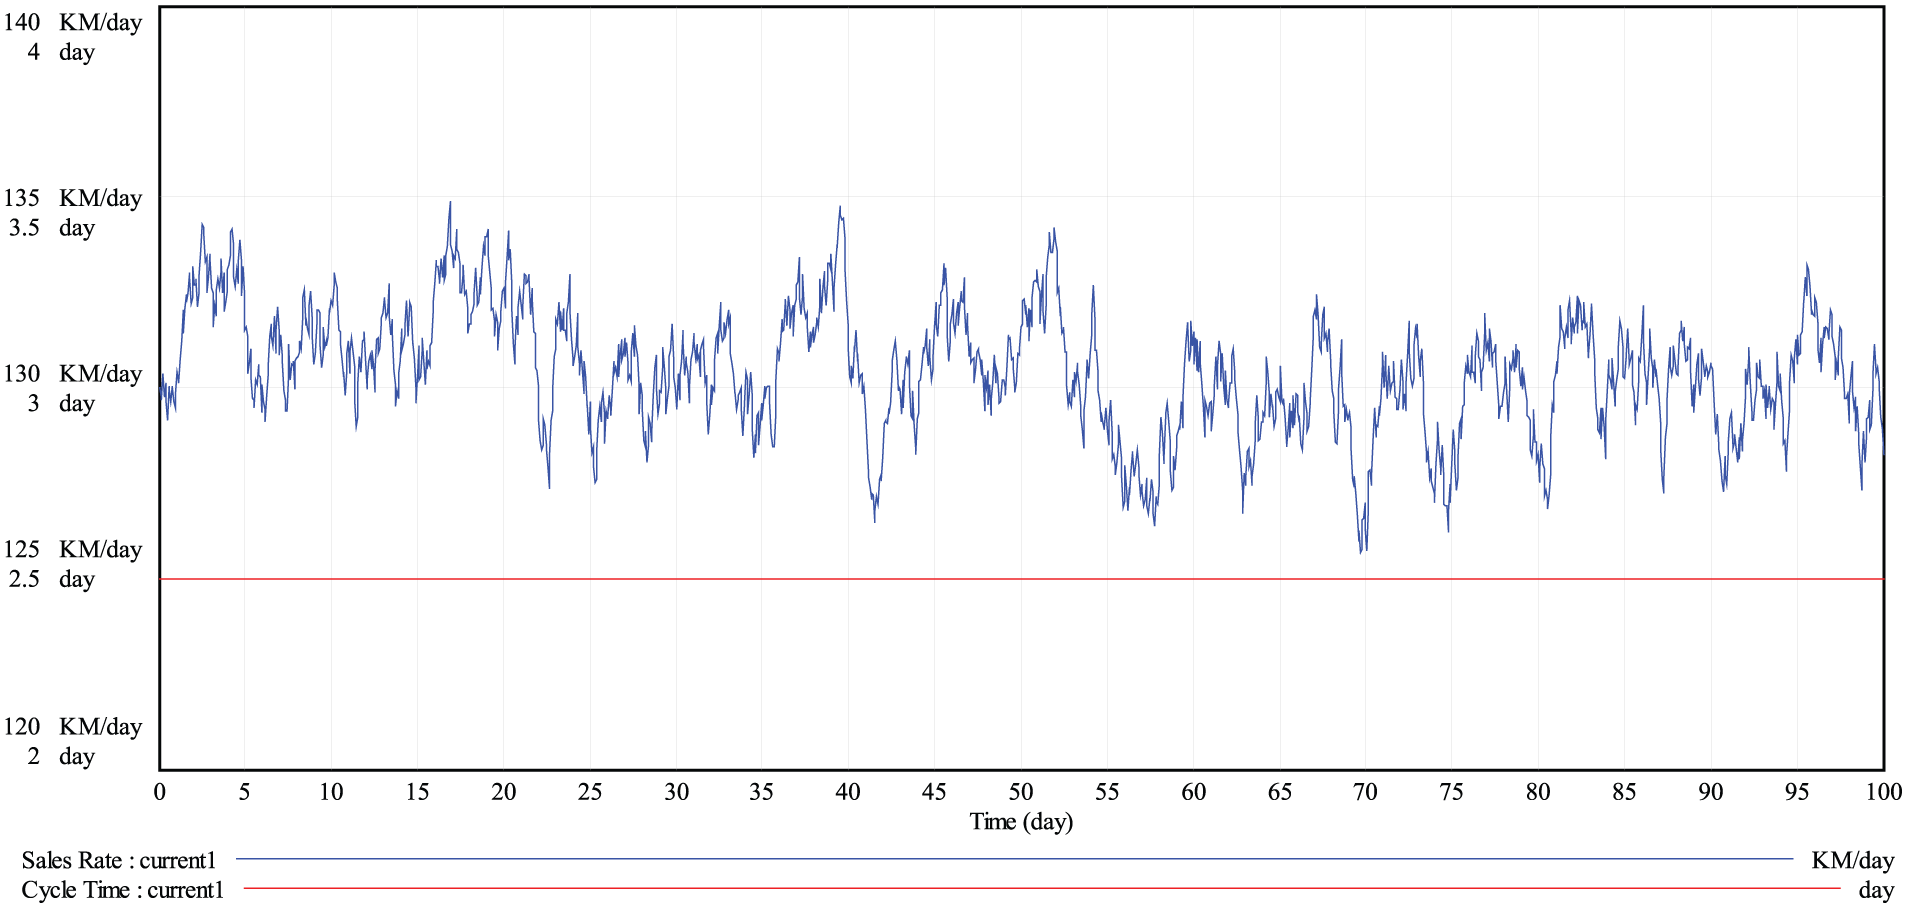
Cycle time and sales rate of future Lean scenario.
Investment evaluation
The existing production capacity is not sufficient to fulfil customer order rate. The proposed scenario is only workable when the plant runs on full capacity, but that involves capital spending on electricity generation plants and building construction. Since the unmet production demand is permanent, the factory setup must be designed to function three shifts a day, each shift being of 8 h. The investment activities will warrant continued supply of electricity in the mill, which is vital to drive machines, air compressors, air conditioning systems, lab instruments and to illuminate the workplace. The department-wise basic electricity consumption has been calculated as shown in Table 1.
The power consumption of the selected weaving mill.

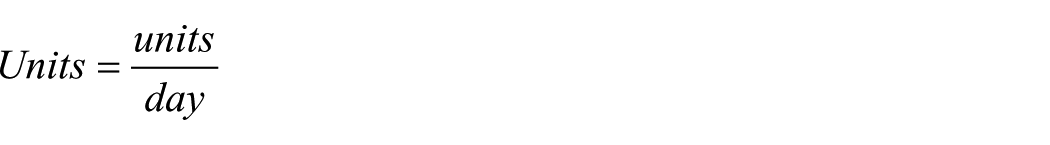
Most of the power is utilized by compressors and looming or weaving process which is 49.92% and 21.70% of the total power consumption, respectively; within loom mostly the energy is employed for shed opening, weft insertion and beating up functions. The rest of energy is expended by auxiliary and preparatory processes. When cumulative electrical energy (3317.760 MW) consumed in a month is divided by the total monthly production of 3.9 million metres, the power consumption turns out to be 0.851 kW h/m of fabric. The rise in the required energy to produce 1 m of fabric in modern weaving is due to the tendency of replacing human jobs by automated machines. But this increase in energy usage is paid off by the enhanced productivity.
The hourly total power consumption (4608 kW) suggests that 5 MW generation capability is enough to operate the weaving plant. It was envisaged to plan generators with small capacities to minimize the loss of production during overhauling or malfunction of some generator. Hence five 1-MW generators each with availability of 94% were proposed. In the furtherance of determining the type of fuel and source of power, different practical data were gathered and analysed for costing purposes. The financial figures for the computational purposes have been expressed in Pak rupees (Rs.). The variable cost factors for generation of electricity are maintenance charges, fuel expenses and MWh produced. The cost of gas is Rs.1670/ha m and that of furnace oil is Rs.60/L. The average variable cost (the generation cost) per unit (kW h) calculated for generator with natural gas as fuel is Rs.6.10 and with furnace oil is Rs.22.62 while the total price per unit available from national grid is Rs.13. Since neither the supply of electric power from the national grid nor the continuity of natural gas is ensured, the generation from furnace oil (even at high cost) must be incorporated when supply from both of them is out of reach. So the electricity source options in order of preference are to (a) produce electricity from gas, (b) benefit from national grid and finally (c) generate power from furnace oil. Taking these into account, dual fuel generators are the appropriate choice that could operate on gas as well as on furnace oil. The capital expenditure for such power plants is Rs.130 million and for the building is around Rs.5 million intended for the installed capacity of 5 MW.
The daily average scheduled power load shedding is 8 h and gas load shedding is 3 days in a week. So the weekly schedule for economical use of the supply of electricity has been propounded in Table 2.
The weekly economical power consumption schedule.

CPP: captive power plants.
The average variable cost per unit computed for the power plant when fuelled by natural gas (for 4 days/week, 57.14%) and furnace oil (1 day/week, 14.28%) is more or less Rs.9.40. Rest of the duration (2 days/week, 28.57%), the mill draws power from national grid. In this deliberate setting, CPP operate on natural gas and furnace oil with a proportion of 80% and 20%, respectively. With reference to the investment evaluation, first the total cost of electricity produced by CPP and that from national grid is to be compared. Then the objective is to calculate the net present value (NPV) of the additional cash flows due to specific production obtained by consuming the electricity produced by capital investment of CPP. The overview and the nuances of financial segment of the model have been detailed henceforth and conjointly shown with the Lean model in Figure 8. The major equations used in the model are as follows (Integration → Method Euler)


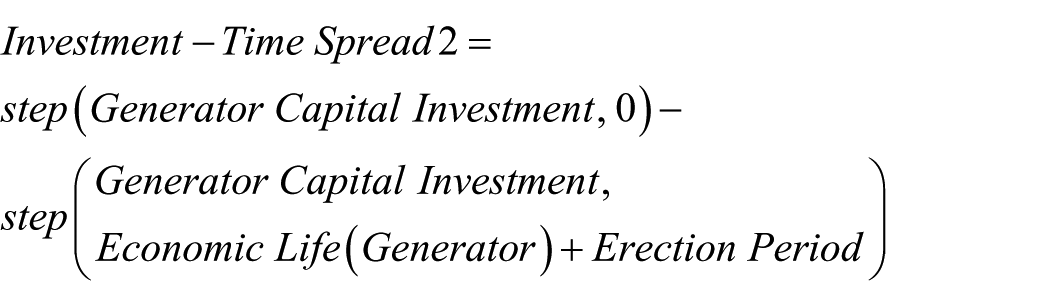


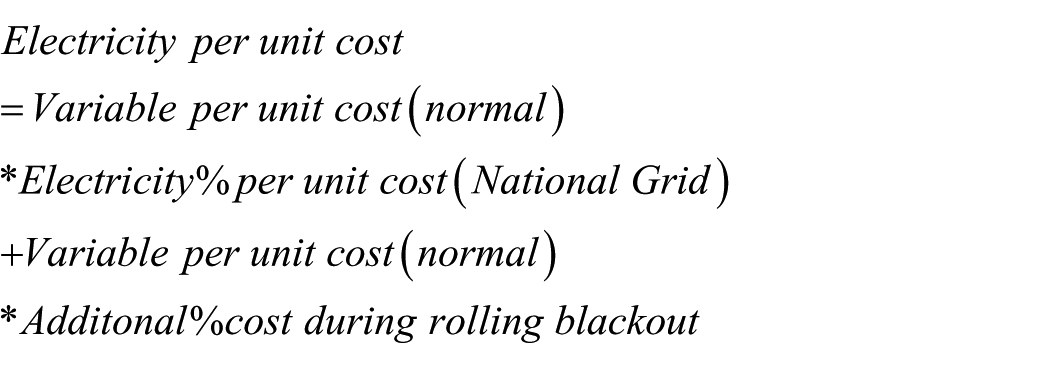

Investment evaluation for a captive power plant.
The model characterizes the reciprocal dynamics of power generation, production capacity and initial outlay. The power mode flexibility has been modelled explicitly with an option that uneconomic generation of electricity could be stopped. The model was run in relation with the future lean scenario to investigate the investment opportunity over 5 years plus erection time period starting from November 2012 to April 2018. There are some reasons for selecting 5-year horizon for scenario projections. In the first place, it has been contemplated that the national projects started to eliminate electricity shortfall would not be matured to meet the growing demand within this period. So if the payback period is within ‘5+ erection time’ years, the investment is attractive. The second reason is that the economic life of generators is 5 years when used as primary source (the technical life can be up to 10 years). Moreover, the repayment period for the loan is also 5 years after installation period. The TIME STEP (5.7 days) has been kept closer to a week because fuel prices in Pakistan are adjusted on a weekly basis.
The State Bank of Pakistan has gradually lowered the KIBOR (Karachi Interbank Offer Rate) interest rate from 12% to 10% during the last few months maintaining the total interest rate equal to 10%+ 3.5% spread. The management deems to capitalize on this easy monetary policy if CPP investment proves to be profitable. The proposed investment was decided to finance both by bank borrowing and equity with 80% and 20% share, respectively. The discount rate applied to calculate NPV for the future scenario is, therefore, weighted average cost of capital (WACC) with annual interest rate of 16% and the cost of equity as 13.5%. There is a grace period stipulated for erection time granted by the bank during which no interest payment will be due. Depreciation of building and generator starts after the erection is complete and has been calculated at 0.2% and 20% straight line, respectively. The model has two major assumptions: (a) for net cash flow, the revenue incurs immediately with the cash inflows and (b) any change in cost of raw material and other inputs are offset by the variation in price of fabric produced over the simulated window of time.
The projected sales after installation of CPP have been displayed in Figure 9. It shows a gap between investment initiation and capacity addition.

Additional sales by CPP.
Although the production capacity has been increased by 49.42% (4300 m/day) of the present level but the burden on CPP for production has been shifted to 71.43%, up to the economic threshold. With the utilization of full capacity, the fixed cost per metre of fabric would decrease due to economies of scale. The average savings in variable costs per metre of fabric obtained through judicious fuel mix and source of power is slightly above Rs.3 as exhibited in Figure 10. Eventually these savings would help enable the mill to reduce its total variable cost per metre of fabric produced.

Comparisons of costs and saving per metre.
The NPV noted from the Vensim table is Rs.2.17 million, discounted payback period is 5.87 years including erection period and discounted income = Rs.148 million, computed at 30% corporate tax. As indicated in Figure 11, the financial indicators demonstrate that the investment is acceptable.

Net present value of the investment and net income.
Although these calculations have been performed for the evaluation of savings achieved by exploring multiple options for electricity, however, the positive NPV will bring two overlapping benefits. First, it will lower the variable cost using a prudent mixed source of electric power, and second, it will raise the revenue by 49.42% due to added production capacity. Both these turnarounds will reduce the variable and fixed costs to construe that capital spending is a better strategic option than outsourcing the unmet sales orders.
Conclusion and managerial implications
Manufacturing firms are striving hard to produce superior quality and cost-effective products in short lead times to satisfy their end users. However, it is observed that achieving these objectives seems to be a forlorn desire without reorganizing the processes. Regarding restructuring the procedures and operations, Lean tools add more value to the production system when applied in relation with the high-tech System of Systems conceptions. The complex socio-technical, informational and organizational links together with material, energy and information flows can be traced by SD. SD can be considered to be SoSD as a special case because it considers the totality of relationships of the systems rather than focusing them in isolation and can combine sub-models of the feed backed processes into a unified framework. Based on these notions, the article discusses specific issues faced by a company operating in a Pakistani context.
This research case study evaluated the viability of a capital investment to erect multi-fuel CPP to meet electricity shortages. The quantitative analysis of a weaving mill’s existing and redesigned processes has been successfully conducted applying SoSD in Vensim. The financial indicators such as NPV, discounted payback period and discounted income obtained from SoSD model suggest that the investment is attractive in the given circumstances. These calculations have been performed to calculate the savings emerging out of the effectiveness of rational manipulation of power supply source and fuel mix. The other mutually inclusive outcome of positive NPV outweighing these savings is the increase in revenue by 49.42% due to full capacity utilization. Both these benefits would reduce the variable and fixed costs per metre of the fabric produced implying that capital expenditure is better than outsourcing the surplus orders. The upshot of the discussion is that SoSD proved to be an intuitive and comprehensive approach for making strategic decisions. The simulation model presented here would move managers beyond stove-piped decision making and reduce uncertainty in its environment by avoiding unexpected results and effects ahead of time. The model can serve as a planning tool to evaluate the financial impact on the overall profitability of the company under consideration. Although the scenarios simulated are specific to textile industry, it can be replicated to other industries involving discrete processes.