
Abstract
Twist in yarns can be used for handling or testing purposes, but it is not necessary when using continuous multifilament yarns as compared to the spinning required for a short fiber yarn. Small amounts of twist have shown to increase the strength of the yarn while decreasing the longitudinal stiffness. Previous models, including Gegauff’s cos2θ model and Rao and Farris’ model, are compared and discussed. A para-aramid (Kevlar 49) and a regenerated cellulose (BioMid) yarn are tested at various levels of twist to compare with these models. Twist is manually applied, and the samples are tested under continuous rate of extension to determine chord modulus, breaking tenacity, and elongation and break. The results are then fit to existing prediction models using a minimization of the standard error of the regression. Finally, a linear regression is also applied to the data to contrast the fit compared to traditional models. It was found that while the Gegauff model and the Rao and Farris model may capture the overall trend and decrease in longitudinal stiffness over a large range of twist, the small range over which twist can practically be used is not well represented by these models and is better represented by a simple linear relationship.
Introduction
The use of twisted yarns in textile applications is a necessary step for yarns made up of short fibers to ensure that individual filaments do not separate during handling. For multifilament textile yarns composed of continuous filaments, twist is not required for a cohesive yarn, but it can be added for improved handling. However, it has also been shown that the addition of twist at low twist angles has an impact on the longitudinal yarn modulus and the specific strength of high-modulus yarns. In this work, the effect of low yarn twist on the mechanical properties of Kevlar 49 and BioMid yarns is explored. It is determined that twist does significantly affect both the stiffness and strength properties of multifilament yarns, and that existing models do not adequately capture the behavior in the low twist region, and that the experimental results are better defined with a linear fit.
Background
A multifilament yarn is composed of many fibers, or filaments. For untwisted continuous multifilament textile yarns, filaments are oriented in a straight line with the longitudinal axis of the yarn, while twisted continuous filament yarns are oriented in a helical path. The addition of twist impacts multifilament yarns in a number of ways. Handling is improved, as the yarn maintains a more stable cross section and cohesiveness of individual filaments is increased. 1 Some testing standards (such as ASTM D7269 and ASTM D885) require textile yarns to be tested at a specified level of twist.2,3 This is to ensure that filaments within the yarn fail as uniformly as possible, rather than in a progressive fashion. It has also been shown by Rao and Farris 4 that the addition of twist even at relatively low twist angles has an impact on the longitudinal yarn modulus and the specific strength of high-modulus yarns. Specifically, increasing the twist angle resulted in a decrease in the longitudinal modulus of the yarn. Small increases in yarn twist, up to 5°, increased the yarn strength. However, beyond this point, additional twist has also been shown to reduce yarn strength.
Shah et al. 5 attribute these to two separate effects, the resistance to filament rupture and the resistance to filament slippage. As twist increases, the contraction force between filaments as well as the obliquity to the loading direction also increase. The contracting of filaments is believed to improve yarn tensile strength, while filament obliquity has a negative effect.
The effect of twist is also different depending on the type of yarn used. These effects have been well documented for some of the more common synthetic yarns (Kevlar 29, Kevlar 49, etc.)4,6 as well as for some natural staple yarns.7,8 BioMid is a textile yarn composed of regenerated cellulose with similar appearance to a synthetic multifilament yarn, and studies regarding the effect of twist on mechanical performance have not yet been performed on this material. Further exploration into the performance of BioMid could open up new opportunities to use sustainably sourced materials in structural composite applications.
Fiber twist models
The addition of twist into a yarn is expected to affect both stiffness and strength of the yarn under loading. In a twisted yarn, the orientation of the individual filaments increases in eccentricity to the longitudinal direction as the twist increases. This off-axis eccentricity results in a loss of longitudinal stiffness, the effect of which has been modeled previously. One of the earliest models, known as either the cos2θ model or as Gegauff’s classic model, 4 takes the change in fiber orientation into account, by accounting for change in fiber length respective to the change in length of the yarn. As shown in Figure 1, the helical path of an individual filament is shown relative to the yarn direction. Gegauff’s model relates yarn strain to filament strain based on the helix angle.

Schematic showing Gegauff’s classical yarn model for yarn mechanics.
4
On the left, the cylinder represents a twisted filament yarn in
By accounting for the geometric relation between the height of the yarn

where
Rao and Farris consider the rotation of the stiffness matrix created by the misalignment and orientation of the filament direction due to radial displacement and twist. Equation (2) results from considering the rotation of the stiffness matrix as well as the radial displacement of the filament within the yarn structure

where
Naik and Madhavan 10 also consider the effects of deviation from idealized helical geometry, including both migration and microbuckling effects. Migration is considered in the outermost radial positions of the filaments within the yarn. Since the filament path is much greater than that of the average yarn, it is proposed that some of these outer filaments will migrate inward toward the core of the yarn. Microbuckling is considered within the core region, where these filaments with the shortest path will buckle to compensate for the additional length of these filaments. Naik and Madhavan consider cases up to 1.5% migration and 0.6% microbuckling based on the predicted size of the respective migration and microbuckling zones. In practice, these would have to be determined through direct measurements. The effects of these parameters on the overall elastic properties are minimal and will not be considered here (Table 1).
Summary of twisted yarn models.
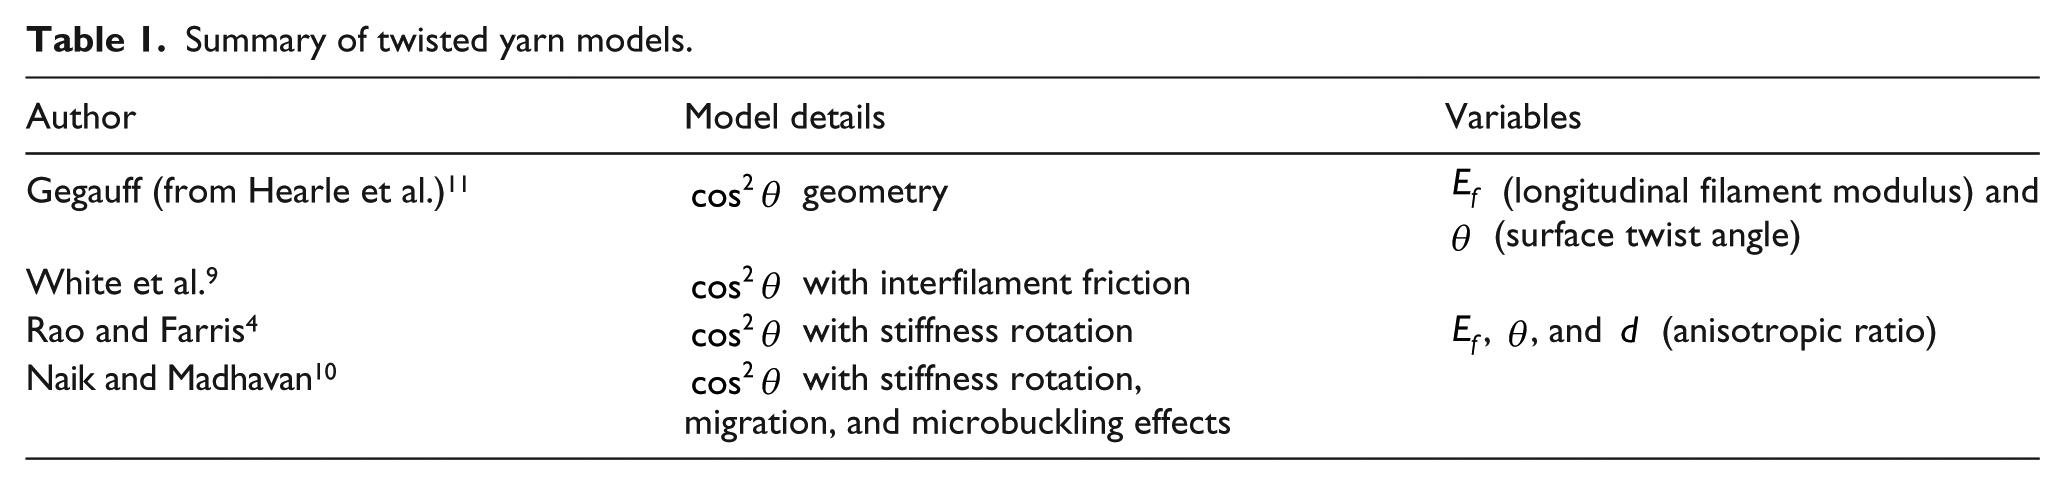
Baets et al. 12 also compare these models, as well as an additional elliptical cross section adjustment to the Naik model. For yarns with low twist (<10°), the difference between the Gegauff and White models and between the Rao and Naik models, respectively, is negligible.
Objectives
The purpose of this article is to investigate and compare the effects of yarn twist on the bulk properties of dry textile yarns, using both a traditional synthetic high-performance para-aramid fiber yarn (Kevlar 49) and a regenerated cellulose fiber yarns (BioMid). The results will then be compared to the Gegauff
Methods
Materials
Two materials were selected to assess differences in behavior and the performance of the proposed model, Kevlar 49 and BioMid. Kevlar 49 is the commercial name of a synthetic para-aramid yarn manufactured by DuPont. 13 It has been used in a variety of high-performance applications, as it features excellent strength-to-weight characteristics, including high chord modulus, high strength, and low elongation at break. 14
BioMid is a continuous 100% cellulose yarn that is composed of by-products from the lumber industry. BioMid is derived by separating the cellulose, dissolving into a pulp, and then spinning it in order to produce a continuous fiber, rather than being produced in a viscose process like other regenerated cellulose fibers. 15 As it is composed of lumber by-products, it is proposed as a sustainable and more environmentally friendly alternative for other synthetic multifilament yarns, such as E-glass or Kevlar.
The aramid yarns tested were Kevlar 49 Para-Aramid yarns (DuPont, Richmond VA, USA) with 380 denier, while the regenerated cellulose fibers were BioMid Cellulose Fibers (GS Consulting, Burnaby BC, Canada) with 1600 denier yarns. Manufacturer-provided values are summarized in Table 2.
Summary of manufacturer values for Kevlar 49 and BioMid yarns. 13

Aramid and regenerated cellulose yarns can be manufactured into textiles with zero twist, as each of their respective manufacturing processes allows for the production of continuous filaments. However, standards dictate that the testing of both of these yarns should be performed with a certain level of twist to avoid high variability between results.2,3
Yarns were tested at three different twist levels: zero twist, 80 turns per meter (tpm), and at a third point, depending on each fiber type. The standard used by each manufacturer was 80 tpm, from which a comparison could be made to provide values for breaking strength, strain, and elastic modulus. The third test point for each was determined by comparing the surface twist angle for each sample. Since the BioMid contained a significantly higher count of fibers, the effective twist angle at 80 tpm was much higher than the Kevlar 49; thus, the third point for the BioMid fibers was taken at 40 tpm and for Kevlar 49 at 160 tpm. This resulted in three different twist angles tested of roughly 0°, 2.5°, and 5°. Actual twist angles were determined by yarn geometry, which has been shown to be a valid method for estimating the surface angle. 16
Static testing
Two different standards are applicable to static testing, ASTM D885 (for cellulose fibers) and ASTM D7269 (for aramid fibers). Where possible, aspects of the testing that fit both standards were chosen, such as sample length and crosshead travel rates. All yarns were tested at a gage length of 500 mm with a crosshead travel rate of 100 mm/min. A minimum of 10 samples were collected for each yarn and twist combination. Custom yarn grips were used as shown in Figure 2, where the yarn is wrapped 180° around the pulley surface prior to clamping. This approach is suggested by ASTM7269, and it reduces the load observed at the grip interface.

Image of testing setup with (a) test grips, (b) loaded sample, and (c) pulleys.
The testing machine used was a constant rate of extension tensile frame (MTS Synergie 400; MTS, Eden Prairie, MN, USA), and the manufacturer-provided software was used for machine control and data acquisition (TestWorks 4, MTS). Load data were captured via the 500-N uniaxial load cell (MTS), while extension data were captured via the tensile frame positioning. Data were then processed in MATLAB (Matlab 2017a, MathWorks).
Samples were handled with gloves to avoid contamination and were individually loaded into the tensile frame with care taken to preserve filament count and desired twist. Twist was manually inserted by inserting turns over the 500-mm sample length and always in the Z-twist direction. Small amounts of rosin (Hidersine Violin Rosin) were used on the grips to improve grip strength without overly compressing the yarn ends. As per the referenced standards, samples that broke within 10 mm of the grips were discarded to ensure that failure was not initiated by stress concentrations at the grip faces.
Data processing and analysis
For each sample, chord modulus, breaking tenacity, and elongation at break were determined. Chord modulus for each sample was determined by using the following relationship

where
Each value was then averaged over the 10 samples, with the mean and standard deviation reported for each. The significance of each factor was determined by using a one-way analysis of variance (ANOVA) between the three twist levels as well as a follow-up Tukey honestly significant difference (HSD) in order to determine the significance at
It was noted that the BioMid yarns tended to have a bilinear elastic curve, as shown in Figure 3. To provide a metric for this, each curve was separated into two distinct linear regions. The transition point, the strain that best separated the two linear regions, was determined by finding the best linear fit for both regions. The intersection of the two best-fit lines was then reported as the transition point.

Plot showing transition point based on bilinear response (BioMid samples only). The transition point
Model comparison
The Rao and Farris model requires a curve fitting be performed in order to determine the anisotropic ratio
Curve fitting
The anisotropic ratio for Kevlar 49 is reported as
A custom curve fitting algorithm was used to determine the anisotropic ratio
Results
Static testing
The chord modulus, breaking tenacity, elongation at break, and transition strain were each determined for each individual specimen. The results were then averaged for each specimen type. For each sample set, a one-way ANOVA was done between each level of twist within each fiber type (Kevlar or BioMid) to ensure the differences between groupings seen were significant, tested at a level of

Representative load–extension curves for (a) Kevlar 49 and (b) BioMid yarn specimens.
The Kevlar 49 yarns exhibited a linear response up to failure, as can be seen in Figure 4(a). Breaking tenacity and elongation at break increased with additional twist, as summarized in Table 3.
Summary of properties from tested Kevlar 49 yarns.

Statistical significance between groupings (α < 0.05) is denoted as follows: aBetween 0 and 80 tpm; bBetween 80 and 160 tpm; and cBetween 0 and 160 tpm.
The BioMid yarns did not exhibit a linear response as the Kevlar yarns did, as can be seen in Figure 4(b). For these specimens, the effect of twist is not significant between the medium and high levels of twist on the breaking tenacity of the yarn, nor was it significant in the elongation at break or transition point between the low and medium twist levels, as shown in Table 4. The overall effect of twist is significant.
Summary of properties from tested BioMid yarns.
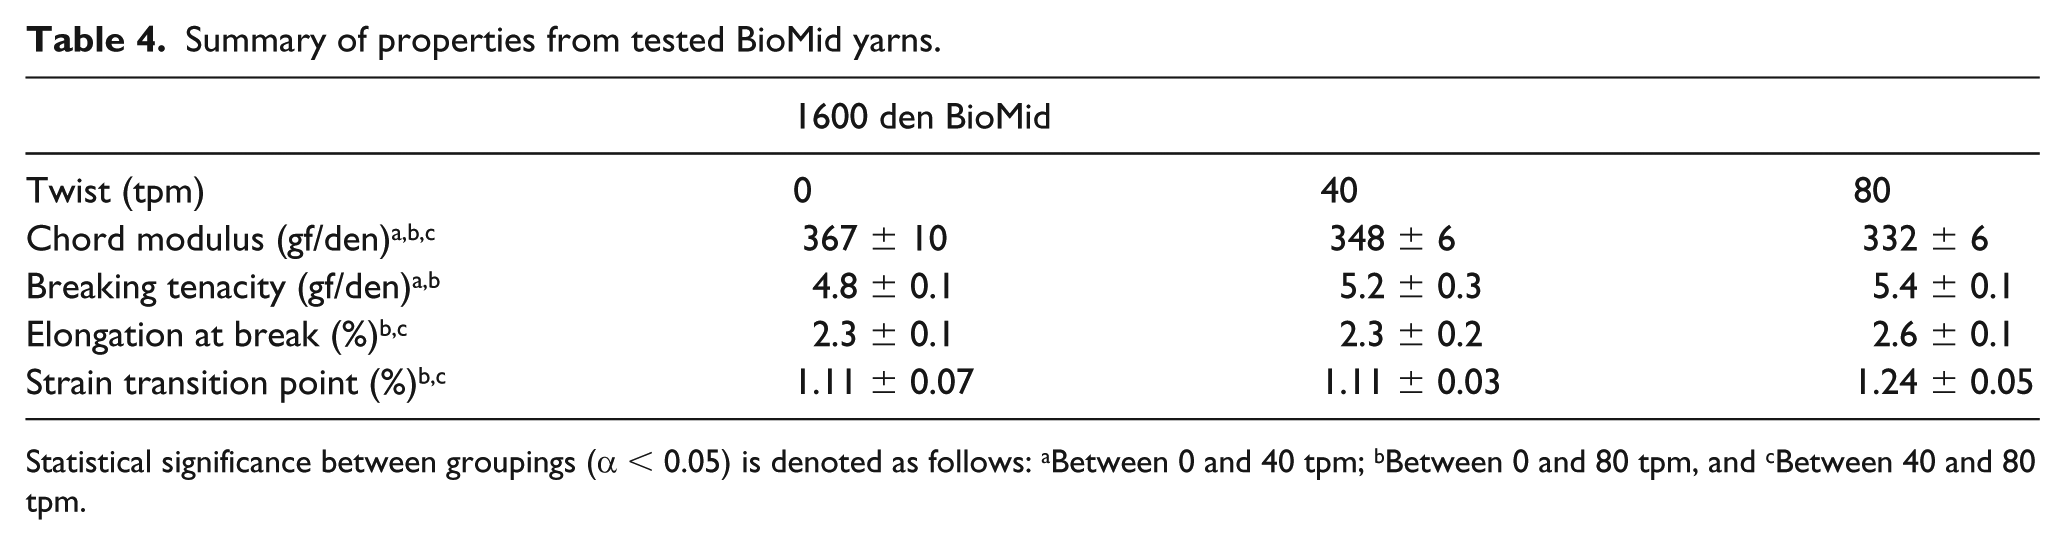
Statistical significance between groupings (α < 0.05) is denoted as follows: aBetween 0 and 40 tpm; bBetween 0 and 80 tpm, and cBetween 40 and 80 tpm.
The significance of twist was determined between the three different groupings. Note that between the untwisted (0 tpm) and twisted (80 and 160 tpm) samples, there is a significant difference in all categories, but not between the 80- and 160-tpm groupings.
Testing of curve fit algorithm
The curve fitting was tested with two different inputs to test the sensitivity of the algorithm to the data provided. First, the entire range of available data was used, typically seven unique data points, to obtain the curve fit over the whole range of data, denoted here by d′. Next, the same curve fitting algorithm was performed for only the first three data points, which were the three data points within the 5° region of interest for this study. This fit parameter was denoted by
Comparison of anisotropic ratio.

Note that the curve fitting algorithm developed agrees relatively well with those as reported by Rao and Farris and can be used with confidence in determining the anisotropic ratio from new data. The difference between the anisotropic ratios calculated using the entire data set versus those only within the range of interest is negligible, and thus only three data points can be used to determine the anisotropic ratio. Figure 5 shows the sensitivity of the model to the deviation in the anisotropic ratio. It is important to notice that all values are within reasonable agreement of the behavior of the yarn, and increasing values of the anisotropic ratio result in greater twist impact on chord modulus.

Plot of curve fitting for Kevlar 149 compared against reported values by Rao and Farris. 4
Both Gegauff’s
Twist models
The predicted response for each set of samples tested is calculated based on both the

Note that these regressions were performed without normalization to the zero twist results. Here, the p value is used to indicate the significance of each coefficient. For the Kevlar 29 380 denier samples,
Regression results for Kevlar 49 samples.

For the BioMid 1600 samples,
Regression results for BioMid 1600 samples.
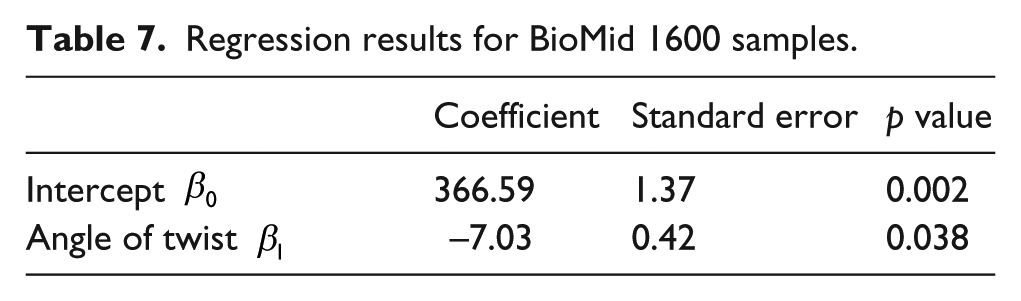
Both sets of samples had an
Modeled versus experimental results
The experimental results for each of the three tested twist levels are plotted against each of the three models

Plot of Kevlar 49 experimental chord moduli versus twist models, normalized with respect to the untwisted modulus.
Similarly, an anisotropic ratio of
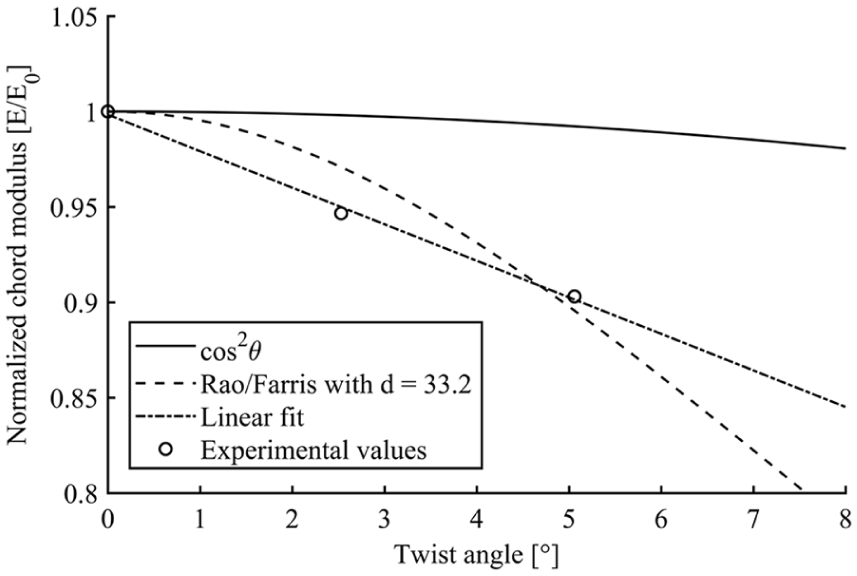
Plot of BioMid 1600 experimental chord moduli versus twist models, normalized with respect to the untwisted modulus.
The decrease in stiffness due to twist at this range for the BioMid samples is significant. Again, the
Discussion
The goals of this article were to first compare the mechanical performance of BioMid yarns to Kevlar 49 yarns and to determine the effect of twist on the stiffness and strength of each sample and compare their behavior to existing twisted yarn stiffness prediction models.
Impact of twist
The addition of yarn twist affects dry yarns in a number of ways. As seen in other studies,4,18,19 the inclusion of low amounts of surface twist (below 6° as tested here) may reduce the longitudinal yarn modulus, but can also increase yarn strength and elongation at failure. This was true for both the Kevlar and BioMid yarns. For the regenerated cellulose BioMid yarns, the transition point of the bilinear curve is also shifted higher with a greater angle of twist.
Modeling
The
Comparison of yarn material
The regenerated cellulose BioMid yarns and the para-aramid Kevlar 49 yarns are quite different in terms of their mechanical performance. First, the normalized response stiffness and strength of BioMid decreases much faster with response to twist than that of Kevlar 49. However, the failure strain of BioMid is higher than that of Kevlar. In addition, while Kevlar 49 has a very linear elastic response right up to failure, the BioMid yarns exhibit a bilinear response where the stiffness decreases upward of 1% strain. According to Graupner et al., 20 cellulosic fibers can exhibit varying levels of ductility based on the resource of origin (such as wood or plant fiber) and consequently, the manufactured yarn properties reflect that of the original chemical composition and cell wall structure.
For potential use of BioMid as a composite material, the “knee” point is one that requires particular attention. At the outset, it may seem as a negative component to its performance, as compared to the completely linear response to failure of Kevlar 49. However, there are some benefits to such behavior. Although not as strong as Kevlar 49, the extension to failure is greater. This gives BioMid a semi-ductile response, albeit without a necking region. This increased ductility could be utilized in applications where visual indications are relied on for inspection purposes, such as in composite rebar. Once again, the linear regression is appropriate here for predicting the stiffness response within the low twist region and performs much better than the Rao and Farris model, especially given that the value determined for the so-called anisotropic ratio cannot be rationalized in this instance nor is it backed by any available literature, as the original study was limited to certain continuous synthetic yarns.
Conclusion
Dry textile yarns made from a para-aramid (Kevlar 49) and from regenerated cellulose (BioMid) were tested in tension under varying levels of yarn twist. Chord modulus, breaking tenacity, and elongation at failure were determined for each sample. Low levels of twist have a significant impact on mechanical performance of textile yarns. Existing models, including the
Footnotes
Declaration of conflicting interests
The author(s) declared no potential conflicts of interest with respect to the research, authorship, and/or publication of this article.
Funding
The author(s) received no financial support for the research, authorship, and/or publication of this article.