
Abstract
This article reports a study on the effect of different natural fibres, their blend ratios and varying air gaps between a needle-punched non-woven fabric and polystyrene backing on the sound absorption coefficients of the needle-punched non-woven fabrics. These parameters as well as their interactive effects were studied by variance analysis. The air gap varied from 0 to 25 mm in 5 mm increments; three natural fibre types (agave, flax and waste wool) were used; each one blended with polyester fibres in three blending ratios. The univariate test of significance showed that all three parameters and two of the three two-way interactions effects on sound absorption coefficients were significant. Only two-way interaction effect between blend ratio and air gap on sound absorption coefficient was not significant. It was found that the sound absorption coefficients increased with an increase in air gap size up to 15 mm, after which they decreased slightly as the air gap was increased further to 25 mm. In addition, the non-woven fabrics produced from the blend of waste wool and polyester fibres achieved the highest sound absorption coefficients than those of the other two natural fibres, and generally, the sound absorption coefficients increased with the increase in polyester fibre content in each blend studied.
Introduction
Excessive noise pollution is a problem in modern society. The negative effects on human health and social environments due to noise pollution have been extensively studied and are well reported. 1 The main effects of noise pollution include noise-induced hearing impairment, interference with speech communication, disturbance during rest and sleep, adverse effects on psycho-social behaviour and mental-health performance as well as effects on residential behaviour and annoyance. 1 Consequently, many methods have been devised to mitigate these problems. Various methods for reducing noise in the source–transmission–receiver system setup are available, but treating the transmission element is usually the most viable approach. However, it is not always difficult or unviable to treat the other two elements, that is, source and receiver.
Various methods of reducing noise exist; among them is the use of porous sound absorptive materials like non-woven fabrics which are widely employed for this purpose. Non-woven fabrics, in general, are ideal acoustic insulators due to their high volume-to-mass ratio.2–4 In addition, other than the non-woven fabric parameters, other variables influence their efficacy in sound absorption application, for example, layering sequence of the fabrics and air gap(s), the size of the air gap between layers of fabrics or as backing behind one layer (no multiple layers of fabrics).5–7
One of the advantages of the needle-punched non-woven technology is that a wide range of fibres with varying finesses and lengths can be utilized to produce a fabric. Renewable fibres and natural fibres (bio-degradable) can be employed to produce non-woven fabrics for noise-absorbing materials. In view of the recent upsurge in research on the use of recyclable and bio-degradable materials in manufactured products, natural fibres have become one of the main choices for the automotive and the built environment industries among others.8,9 This has triggered a need for bio-degradable non-wovens for nearly 40 applications for automotive interior components, which are currently produced from traditional materials such as glass and synthetic fibres and foams. 10
Fibre characteristics play a huge role in the eventual efficacy of a non-woven fabric as a sound absorber/insulator, as they influence air flow resistivity, porosity and tortuosity.11–14 Several researches have been published to investigate the influence of fibre characteristics on sound absorption together with the effect of thickness, fabric density and tortuosity.5–14 However, the effect of varying air gap between a non-woven fabric and a backing medium on sound absorption has not been investigated and reported extensively in the literature, particularly the effect of air gap on sound absorption capabilities of non-woven fabrics produced from natural fibres.4,5,15
Mirjalili and Mohammad-Shahi 5 studied the effect of air gap between layers of multi-layered structures on sound absorption capabilities of the non-woven fabrics. They found that sound diffraction occurs when a sound wave passes through a multi-layered structure, that is, medium alternates between fibre bundles and air (gap). When the material changes, the velocity of the sound wave changes, which, in turn, affects the noise absorption coefficient (NAC) of the multi-layered structures in comparison to that of homogeneous multi-layered structures. In fact, a part of sound energy within the different materials is reflected. On this basis, the distance between layers or the gaps between them, in the multi-layered structures, can improve their sound absorption capacity.
Seddeq et al. 6 studied the sound absorption properties of non-woven fabrics produced from recycled fibres and compression moulded bio-composites made from rice straw and wood fibres. They also investigated the effect of air gaps varying from 1 to 4 cm together with the perforated plate placed in front of the non-woven sample (plate-sample-air gap). They found that the sound absorption coefficients of the non-woven fabrics improved by keeping 1-, 2-, 3- and 4-cm air gaps behind the sample. They achieved low sound absorption coefficients at low and middle sound frequencies and slightly higher at high frequencies. However, in the case of bio-composites produced by reinforcing rice straws, they achieved lower sound absorption coefficients for all frequency ranges in comparison to that for non-woven fabrics. This was attributed to the fact that the composites were treated with urea-formaldehyde resin during moulding which led to increase in the airflow resistance and a decrease in the porosity which caused a drop in friction and sound energy losses.
Jayaraman 7 found that sound absorption coefficient increased with an increase in air gap between the sound frequencies of 500 and 4500 Hz. However, no significant difference in the sound absorption coefficient was noticed between the air gaps of 5 and 10 mm and the maximum peak was noticed at lower sound frequency for the larger air gap of 10 mm as compared to that of 5 mm.
Fatima and Mohanty, 16 studied NAC of multi-layered needle-punched non-woven fabrics produced from polyester (PET) fibres in different configurations. They studied the effect of increasing the number of non-woven layers on sound absorption as well as the effect of incorporating air gaps in between the non-woven layers. They found that sound absorption coefficient increased with an increase in the number of non-woven layers, up to three layers; however, when the number of layers in the structure was increased to four, sound absorption coefficient decreased significantly. When comparing the multi-layer structures with a 5-mm air gap between them, increasing the layers had a positive effect on the NAC. In addition, the three-layer structure with a 5-mm air gap between the layers performed better than the two-layer structure with the same air gap between them. When the air gap between the layers in the two-layer structure was increased to 15 mm, the NAC of the structure also improved. However, the NAC of the two-layer structure with a 15-mm air gap between the layers achieved better performance than that for the three-layer structure with the same air gap between the layers.
From the published literature, it is observed that, particularly for non-woven fabrics, an in-depth study on the effect of the air gap (backing) size on sound absorption properties has not been conducted. As such, no systematic investigation on the principal effect of the air gap on sound absorption has been reported.
Furthermore, a very little attempt to study the simultaneous effects of the air gap with fabric and fibre characteristics of the non-wovens has been made.
The aim of this work was to study the effects of the varying air gap between the non-woven fabric and a backing sheet made of extruded polystyrene (XPS), fibre fineness (fibre type) and fibre blending ratio on sound absorption coefficients of the needle-punched non-woven fabrics. Furthermore, the optimum size of the air gap was determined to achieve maximum sound absorption. A three-way analysis of variance (ANOVA) was carried out which included two-way interactions to test the parametric effect on sound absorption.
Experimental
A commercial material, made from XPS with a thickness of 40 mm; widely used in building industry for insulting roof ceiling, was used as a backing sheet. It was sourced from a local manufacturer and had a low sound absorption coefficient (α = 0.22). It is normally used in combination with glass-fibre mats or shoddy-fibre mats in order to compensate for its poor sound and thermal absorption properties.
Three types of natural fibres, namely, agave, flax and waste wool were utilized in this study and each was blended with PET fibres in three blending ratios. Flax and agave fibres were cottonised by a two-pass process in the pre-opener (unbundling) and cottoniser on a Temafa line. Waste wool was a non-apparel-grade wool fibre. The fibre dimensions together with their corresponding coefficient of variation (CV %) are shown in Table 1.
Fibre dimensions with % CV in brackets.

PET: polyester.
All fabric samples were produced by a needle-punching process which involved web formation on a carding machine followed by layering on a cross lapper, then consolidation by needle punching. Prior to carding, waste wool, flax and agave fibres were blended with PET fibres at three blending ratios, namely, 30%:70%, 50%:50% and 70%:30% natural and PET fibres by weight (Table 2). The reason for blending with PET fibres was to enhance the structural integrity of the fabrics.
Sample parameters and air gaps.

PET: polyester.
The air gap was varied from 0 to 25 mm, in increments of 5 mm, as shown in Figure 1. A digital vernier calliper was used to measure the air gap. The XPS sheet was placed in the sample holder of the impendance tube, then the required air gap was adjusted in such a way that the non-woven specimen would always fit in the front end of the sample holder, and the position of the XPS sheet was adjusted by a plunger at the rear end of the sample holder to create the required air gap between the sheet and the fabric specimen.

Test setup with a variable air gap between non-woven specimen and polystyrene sheet.
The nominal area weight and thickness of the non-wovens were 1000 g/m2 and 7 mm, respectively. The machine settings had to be adjusted for each natural fibre type and blending ratio due to differences in fibre characteristics and blend ratios, this meant that there would be a major difference in fabric density and thus their respective area weights if machine settings were kept uniform. In addition, the fabrics were needle punched at different depths of needle penetration to maintain a uniform fabric thickness of 7 mm for all samples.
All fabric samples were conditioned for at least 24 h prior to testing in a standard testing atmosphere maintained at 65% ± 5% relative humidity and 20°C ± 2°C temperature.
Normal incident sound absorption coefficient (α) was measured according to the ASTM E 1050-2010 standard test method for impedance and absorption of acoustical materials using a tube, two microphones and a digital frequency analyser. 17 The LMS acoustic testing instrument operated in a frequency range of 50–5700 Hz was employed for the measurement of acoustic properties. 18 Five readings were recorded for each fabric sample, these readings were measured on five randomly cut specimens.
The area weights of the samples were measured according to ASTM D 3776 on an electronic balance. 19 Five random measurements were carried out for each sample. The specimens used to measure area weight were also used to test fabric thickness according to the EDANA WSP 120.6 (05) method. 20 A digital thickness gauge consisting of a metal disc weighing 170 g and 50 mm in diameter was utilized to measure thickness of the fabrics under a constant pressure of 1 KPa.
Results and discussion
The average areal density values (g/m2) as well their respective CV (%) are shown in Table 3.
Sound absorption coefficients of non-woven fabrics backed by an XPS sheet at varying air gaps and for different natural fibre types.
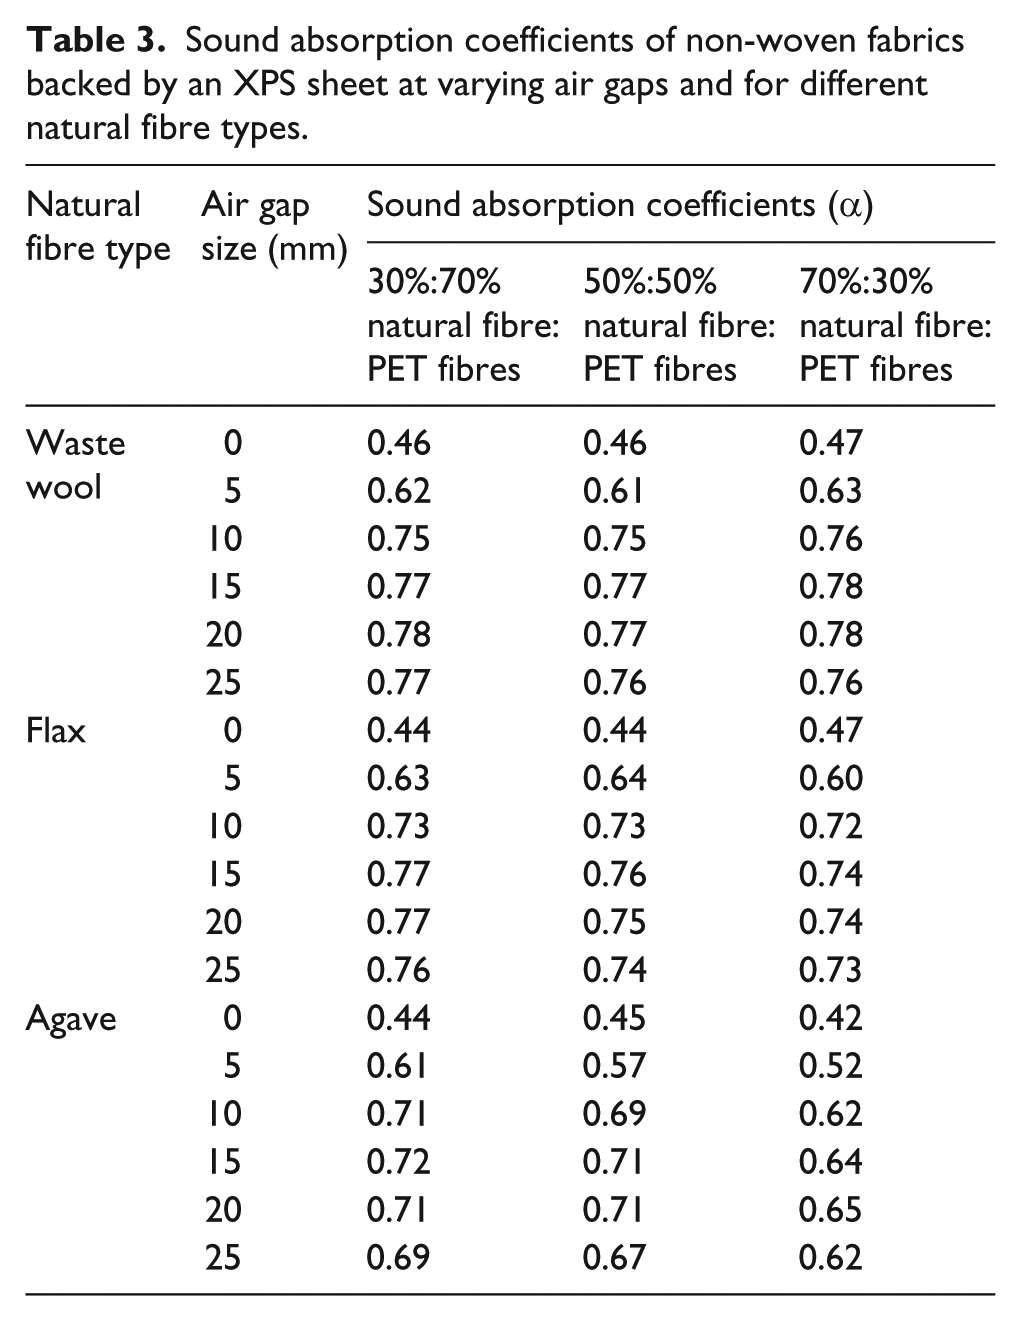
The average sound absorption coefficient (50–5700 Hz) measured for each tested system (non-woven specimen-air gap-polystyrene backing) along with the fibre type, blending ratio and air gaps are shown in Table 4 and Figure 2.
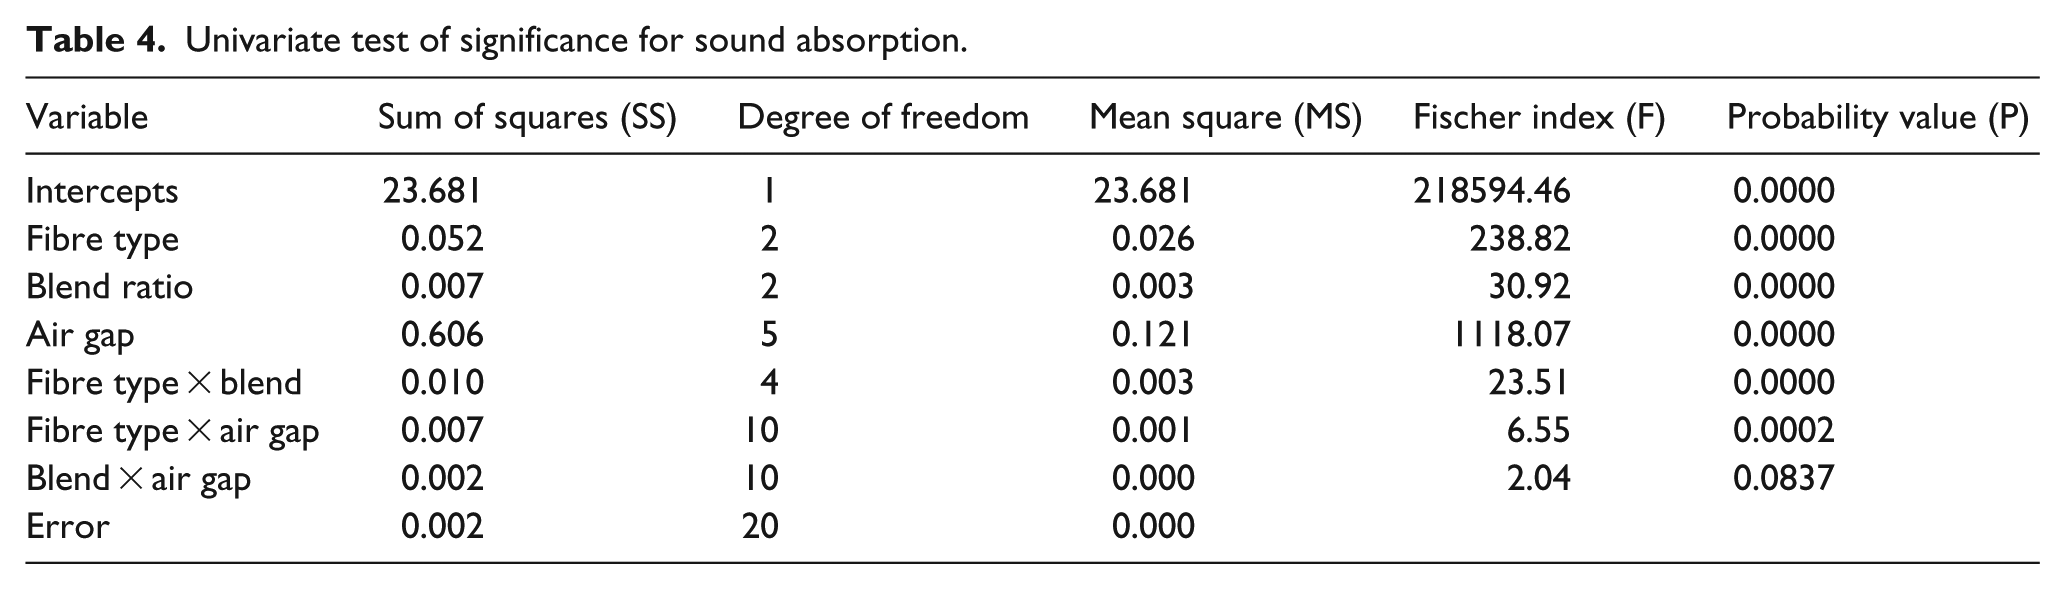
Univariate test of significance for sound absorption.

Sound absorption coefficient curves of the fabrics produced.
From Table 4 and Figure 2, it can be observed that the fabrics produced from blends of waste wool and PET fibres, in general, showed the best sound absorption coefficients, while the fabrics produced from blends of agave and PET fibres showed the worst sound absorption coefficients. This was expected because wool fibre is known for its good sound absorption properties due to its fibre surface morphology characterized by scales.9,21 These scales play a major role in sound absorption, as they increase fibre surface area, and so increased frictional contact with the sound waves, thus causing an increase in the sound absorption coefficient. Agave on the other hand is a coarse fibre (thick and poor crimp), which meant that there was lower fibre surface area per unit volume as well as high air permeability in the fabrics and less frictional contact with the sound waves, which compromise the sound absorption ability of the fabrics.11,13,22 Flax fibres are finer and have better crimp than agave fibres, which is why the samples produced from flax and PET also performed better than those made from blends of agave and PET.
When comparing the three blending ratios, it could be observed that the fabrics produced from blends of 30%:70% natural and PET fibres achieved higher sound absorption coefficients than those produced from blends of 50%:50% natural and PET fibres, while the sound absorption coefficients of the fabrics produced from blends of 70%:30% natural and PET fibres were generally the lowest with an exception for the fabrics produced from a blend of waste wool and PET fibres in which the sound absorption coefficients increased with an increase in wool fibre content. This could be attributed to the fact that the fabrics produced from higher PET fibre content than natural fibres have higher surface area per unit volume due to fineness of the PET fibres.14,23 The fabrics produced from blends of wool and PET fibres were different because, other than fibre fineness, the surface of wool fibres with their characteristic scales was an important consideration. Therefore, a very little change in the sound absorption coefficient was observed regardless of fibre blending ratios; in fact, the sound absorption coefficients increased, albeit slightly, with the increase in wool fibre content in these fabrics.
When the air gap was increased from 0 to 25 mm, it was noticed that the sound absorption coefficient also increased but reached its maximum at 15 mm air gap, then it marginally reduced again as the air gap was widened from 15 to 25 mm. The increase in sound absorption coefficient from 0 to 15 mm was due to the fact that the air gap behind the sample can absorb the sound energy of longer wavelengths at middle and low frequencies. Sound diffraction also contributed to sound absorption, which happens when a sound wave passes through the non-woven layer, enters the new medium (air) and eventually strikes the third medium (XPS). When the material density changes, the velocity of the wave also changes, this causes the sound absorption coefficient of the multi-layer structures to be maximized.4,6,15
Therefore, by increasing the air gap, the sound energy at long wavelengths (low frequency) can be absorbed. A similar effect is obtained by increasing the thickness of the material which can improve the sound absorption coefficients at low, middle and high frequencies due to the increase in losses of sound energy. 5 As observed in other studies,5–7 this confirms that when using thicker non-wovens, higher sound absorption coefficients at low frequencies can be achieved just by incorporating an air gap, which means savings in amounts of fibres used.
On the other hand, the increase in air gap behind the non-woven sample tends to move the resonance frequencies, which corresponds to maximum sound absorption (peak of the graph), towards lower frequencies (to the left of the axis) and results in the decrease in sound absorption at higher frequencies.4–6 Therefore, when air gaps are increased from 15 to 25 mm, these peaks have shifted ‘too far’ towards the lower frequency ranges; hence, the decrease in sound absorption coefficient. In addition, the highest value of sound absorption coefficient occurs when the distance (air gap in this case) between the medium and the wall is in odd multiples of a quarter-wavelength for the particular sound frequency, and conversely, the lowest sound absorption occurs when the distance between the medium and the wall is in even multiples of a quarter-wavelength for the particular sound frequency. This is due to the fact that when the air gap is in odd multiples of a quarter-wavelength; a phase difference of 180° occurs between the incident and the reflected waves and destructive interference of the sound wave takes place, thus the resultant sound wave is dissipated 24 as shown in Figure 3.

Schematics showing destructive and constructive interference of the incident and reflected sound waves.
Conversely, when the air gap is in even multiple of a quarter-wavelength of the incident sound wave, it becomes totally ineffective as the incident and reflected waves are in phase, in other words, as shown in Figure 3, a constructive sound wave interference takes place. 24 Therefore, sound absorption coefficient decreased slightly when the air gap was increased from 15 to 25 mm, which might be due to the change in air gap from being odd multiples of quarter-wavelengths at about 15 mm air gap (maximum sound absorption) to being even multiples of quarter-wavelengths as the air gap was increased to 25 mm.
Data analysis
A three-way ANOVA was carried out to further analyse the data presented in Table 3. The statistical significance of probability values (P-values) were tested at 95% confidence interval as shown in Table 4. If the P-value is less than 0.05, then the parameter is deemed to have significant effect on sound absorption coefficient and vice versa. From Table 4, it was observed that all the parameters as well as two (out of three) two-way interactions showed significant effects on measured sound absorption coefficients. The only two-way interaction effect that failed to achieve significant effect on sound absorption coefficient at 95% confidence interval was between blend ratio and air gap; however, the P-value is low enough to achieve significance at 90% confidence interval.
The Tukey’s HSD tests and their corresponding least square plots were prepared for the three tested parameters to further analyse internal variations within each parameter, to elaborate the effects of the variables on sound absorption coefficient and to compare them with each other.
A Tukey test for fibre type is shown in Table 5 together with the corresponding least square mean plot in Figure 4. The P-values in Table 5 show that all the values of mean sound absorption coefficients are significantly different from each other since their values are below 0.05.
Tukey’s HSD test for fibre type.


Least square mean values of sound absorption versus fibre type for the three blending ratios.
Figure 4 shows a comparison of mean sound absorption coefficients of the three natural fibre blends, it showed that the fabrics produced from a blend of wool and PET fibres achieved the best sound absorption coefficient followed by the fabrics produced from a blend of flax and PET fibres. The fabrics produced from a blend of agave and PET fibres achieved considerably lower sound absorption coefficient in comparison to that for the fabrics produced from blends of other two natural fibres (i.e. flax and waste wool). Furthermore, as shown in Table 5; with all the P-values showing significant difference, none of the confidence intervals (vertical bars) were overlapped (in levels of position).
A Tukey HSD test for blend ratio is shown in Table 6 together with the corresponding least square mean plot in Figure 5. Looking at the P-values, it can be seen that the mean values of the sound absorption coefficients for 30%:70% and 50%:50% blending ratios are not significantly different, as the P-value of 0.0648 is slightly above 0.05. However, the mean sound absorption coefficient values of 30%:70% and 70%:30% as well as those for 50%:50% and 70%:30% blend ratios show significant differences as their P-values are well below 0.05.
Tukey’s HSD test for blend ratio.


Least square mean values of sound absorption versus blending ratio for all the fabrics.
Figure 5 shows a comparison of the three blending ratios in terms of sound absorption coefficients for all the fabrics tested, it was clear that the fabrics produced from a blend of 30%:70% natural and PET fibres achieved the best sound absorption coefficients. The fabrics produced from 70% natural fibres in a blend showed the least value of mean sound absorption coefficients because of higher number of coarser (compared to PET fibres) natural fibres, wool is an exception here as already been pointed out and explained in detail in section ‘Results and discussion’.
The reasons for the difference in the effect of the blending ratios on sound absorption coefficients have also already been explained in ‘Results and discussion’. In addition, following from the P-value shown in Table 6, the mean values of the sound absorption coefficients for 30%:70% and 50%:50% blending ratios are not significantly different from each other, it can be observed on the least square plot, in Figure 5, that the respective confidence intervals (vertical bars) overlap, while the confidence interval (vertical bar) for 70%:30% blend does not overlap with any of the other two confidence intervals.
The Tukey HSD test to analyse the effect of air gap on sound absorption coefficient in Table 7 shows that the values of sound absorption coefficients are mostly significantly different from each other as most of the P-values are below 0.05. Only two pairs of mean sound absorption coefficients showed no significant difference, that is, the mean sound absorption coefficient of 10-mm air gap was not significantly different from that of 25-mm air gap; and the mean sound absorption coefficient of 15-mm air gap was not significantly different from that of 20-mm air gap. This was due to sound absorption coefficient reaching a maximum at about 15-mm air gap and then slightly declining as the air gap is increased further to 25 mm.
Tukey’s HSD test for air gap size.

Figure 6 further illustrates the comparison of various air gaps for all the fabrics studied. As already discussed in section ‘Results and discussion’, it can be seen that the sound absorption coefficient increases with an increase in air gap from 0 to 15 mm, after which it decreases marginally with further increase in air gap up to 25 mm. In addition, following from the P-values in the Tukey’s test shown in Table 7, the confidence interval (vertical bar) at 10-mm air gap overlaps with that at 25-mm air gap; and the confidence interval (vertical bar) of the 15-mm air gap overlaps with that of the 20-mm air gap.

Least square mean values of sound absorption versus air gap size (mm) for all the fabrics.
Conclusion
The univariate test for significance showed that all the parameters as well as two of three two-way interactions showed significant effects on measured sound absorption coefficients. The only two-way interaction effect that failed to achieve significant effect on sound absorption coefficient at 95% confidence interval was between blend ratio and air gap.
The fabrics produced from a blend of wool and PET fibres, in general, showed better sound absorption coefficients than the other fabrics. This was expected because wool fibres are known to have good sound absorption properties due to scales on the fibre surface.
In general, the fabrics produced from a blend of 30%:70% natural: PET fibres showed higher sound absorption coefficients than those produced from a blend of 50%:50% natural: PET fibres, while the sound absorption coefficients of the fabrics produced from a blend of 70%: 30% natural: PET fibres were generally the lowest with an exception for fabrics produced from a blend of wool and PET fibres.
When the air gap was increased from 0 to 25 mm the sound absorption coefficients also increased but reached its maximum at 15-mm air gap after which it slightly decreased with the further increase in air gap from 15 to 25 mm.
Footnotes
Authors’ Note
Mlando Basel Mvubu is now affiliated with South African Bureau of Standards, Groenkloof, Pretoria 0027, South Africa.
Declaration of conflicting interests
The author(s) declared no potential conflicts of interest with respect to the research, authorship and/or publication of this article.
Funding
The author(s) declared the following potential conflicts of interest with respect to the research, authorship, and/or publication of this article: Mlando Mvubu acknowledges financial support from CSIR for PhD studies.