
Abstract
Synthetic dyes are widely used in textile, paper, plastic, and other industries, which are toxic and harmful to environment and human. Adsorption is an efficient method to control wastewater. Cellulose is an abundant, renewable, and eco-friendly polymer produced by plants and trees. An adsorbent for removal of dyes was successfully prepared by grafting amino-terminated hyperbranched polymer (NH2-HBP) and beta-cyclodextrin (β-CD) onto cotton fibers in this study. The adsorbent were characterized using Fourier-transform infrared spectroscopy, scanning electron microscopy, and X-ray photoelectron spectroscopy analysis. The influences of adsorption parameters in a batch mode including initial solution pH, contact time, and dye initial concentration were evaluated in the experiments. The experiment results showed that the adsorption equilibrium was reached within 6 h for Congo red and within 4 h for methylene blue. Both the adsorption isotherms and kinetic studies showed that the behaviors of Congo red and methylene blue removal by the adsorbent based on cotton fibers conformed with Freundlich model and fitted pseudo-second-order model, respectively.
Introduction
Synthetic dyes are widely used in textile, paper, plastic, rubber, cosmetics, and food industries, which are stable and difficult to degrade in the nature. A large of amount dyes were discharged into the water systems with dyeing wastewater due to improper processing and dying methods. 1 In the textile industry, it was estimated that 10%–15% of dyes has not been utilized during the dyeing process and released with the effluents.2–4 Many kinds of synthetic dyes are toxic, which pose a risk to water system, aquatic organisms, and human.5,6 These harmful dyes can break the ecological balance and cause some risks to food safety and environment. 7 There are several methods to remove dyes from wastewater, such as adsorption, membrane separation, flocculation, and oxidation. Among these methods, adsorption is a versatile and widely control method used for the removal of different pollutants for its easy handling and efficiency.8–12 Activated carbon, 13 graphene, 14 bentonite, 15 clay, 16 composite fiber, 17 and nanofiber membranes 18 have been utilized as adsorbents in some studies. However, many of these materials are non-renewable or nonbiodegradable or difficult to recover and may cause secondary pollution.
Cellulose is a natural polymer produced by plants and trees that is biodegradable and eco-friendly resource in nature. Cellulose molecules have many active hydroxyl groups, so it can easily be chemically modified according to the introduction of various functional groups on hydroxyl.
11
Cotton fiber is a natural fiber made from cellulose and it is renewable, degradable, cheap, and does not cause secondary pollution. In addition, cotton fiber has hollow, flat-banded structure, and large specific surface area, which is beneficial to adsorption. Hyperbranched polymers, such as hyperbranched poly(ethylene imine), hyperbranched polyamide amine, and hyperbranched polyester, have shown efficiently to entrap heavy metal ions and organic molecules in their interior.19–23 Amino-terminated hyperbranched polymer (NH2-HBP) have abundant functional groups to be used in the dyeing as an auxiliary.
24
Beta-cyclodextrin (β-CD) is a torus-shaped cyclic oligosaccharide made up of seven α-1,4-linked-
Experimental
Materials
Cotton fibers were purchased in the local market. Nitric acid (HNO3), sodium hydroxide (NaOH), sodium periodate (NaIO4), triethylene tetramine, methyl acrylate, dimethyl sulfoxide (DMSO), β-CD, epichlorohydrin (EPI), ethanol, phenolphthalein, CR, and MB were purchased from Sinopharm Chemical Reagent Co., Ltd (Shanghai, China). NH2-HBP was synthesized in laboratory according to our previous study. 24 These reagents were used without further purification.
Pretreatment of cotton fibers
Cotton fibers (10 g) were boiled in 300 mL of NaOH aqueous solution (2 wt%) for 60 min. Then the fibers were filtered and transferred into 300 mL NaOH aqueous solution (18 wt%) for 240 min at room temperature to break down the strong hydrogen bonds between cellulose molecular chains for the subsequent reactions. The fibers were then washed and dried to obtain activated cotton fibers (named as ACF). ACF were cut into segments about 5 mm.
Preparation of adsorbent
The grafting reaction between β-CD and ACF was adopted using EPI as coupling agent through a one-step procedure. 30 First, 5 g ACF were immersed into 150 mL NaIO4 solution(10 g/L) for 2 h under continuous stirring at 50°C. Then the fibers were filtered, washed, and dried. ACF were oxidized selectively to obtain dialdehyde-cotton fibers (DA-cotton) in this process. Next, 10 g β-CD was dissolved in 200 mL NaOH solution (30 wt%), and DA-cotton was then dispersed into this alkaline β-CD solution. Thirty-five milliliters of EPI and 0.2 g of cetyltrimethylammonium bromide were added into above mixture system and kept uniform mixing for 30 min, and the reaction was allowed to proceed at 40°C for 6 h. The product (CD-cotton) was collected and washed to remove ungrafted β-CD and residual NaOH. At last, the CD-cotton was added to NH2-HBP solution (20 g/L) and stirred at 60°C for 2 h, and then the fibers were collected, washed, and dried at 50°C. The product was named as NC-cotton. The preparation of the adsorbent is summarized in Figure 1.

Preparation route of NC-cotton fibers.
Characterization of NC-cotton
The Fourier-transform infrared (FTIR) spectroscopy measurements were used to identify NC-cotton fiber with a Nicolet 5700. X-ray photoelectron spectroscopy (XPS) measurements were conducted with an Axis Ultra HAS system. The morphologies and surface structures of ACF, CD-cotton, and NC-cotton were characterized with Hitachi S-4800 scanning electron microscope (SEM). The grafting rate of β-CD on cotton fibers was determined according to spectrophotometric method. 31 The absorbance of CR and MB was estimated by ultraviolet (UV)/visible spectroscopy (Hitachi, U3010) at 497 and 665 nm, respectively. The standard curves were drawn about the corresponding absorbance and the concentration of dye solution. The concentration of CR and MB was calculated according to the regression equation, respectively.
Adsorption experiments
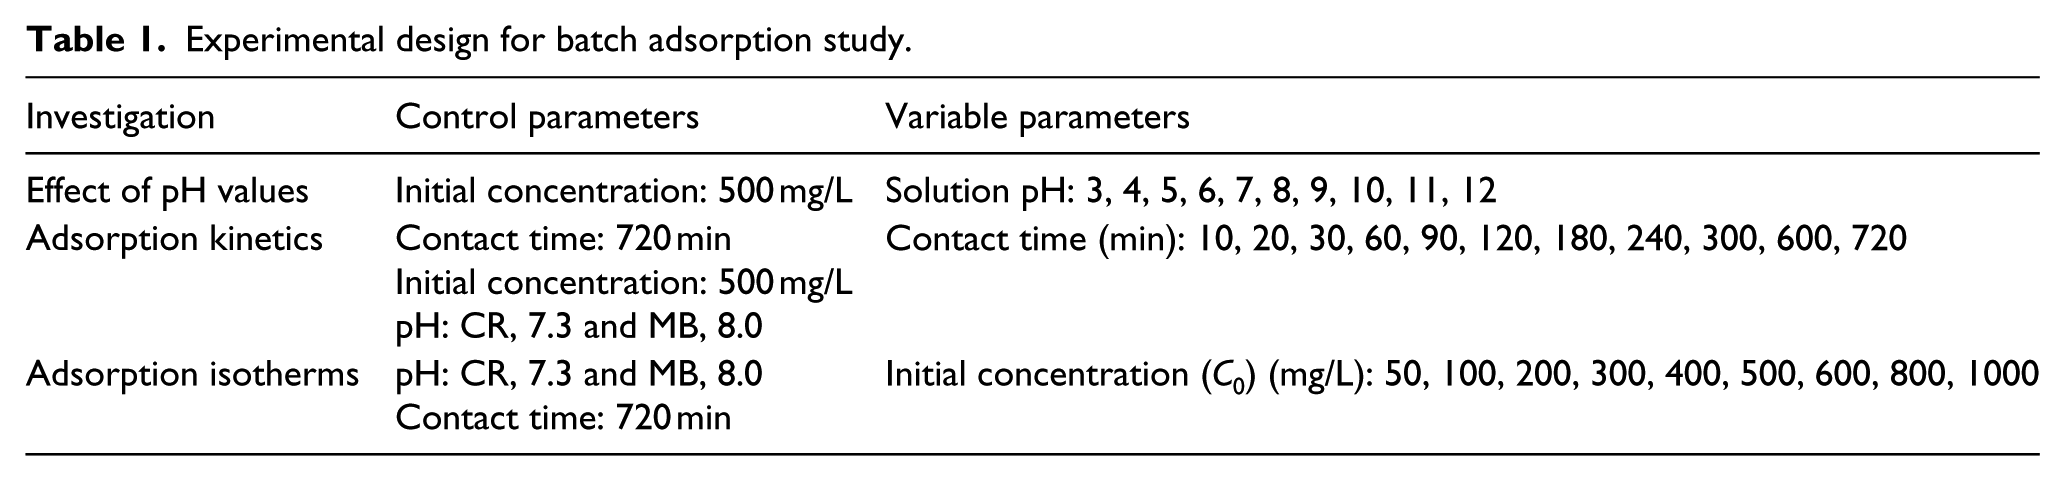
In the static adsorption experiments, adsorbents at a dosage of 2.0 g/L were added to dye solutions (each for 100 mL) at desired concentrations. Initial pH values of the solution were adjusted ranging from 3 to 12 using HNO3 and NaOH solutions. Adsorption was held during agitation of mixture solutions at desired concentrations (50–1000 mg/L) for a set time period at 30°C. Adsorption was held for 5–720 min to study adsorption kinetics. The supernatant dye was taken, centrifuged, and the absorbance was measured with UV–visible spectrophotometer, and then the concentration of dye solution was calculated from the standard curve.
The experiment parameters are shown in Table 1. The equilibrium adsorption capacities (qe) and removal efficiency (R) are calculated according to equations (1) and (2) as follows


where C0 and Ce are the initial and equilibrium concentration of adsorbate (mg/L), respectively. V is the volume (L) of adsorbate solution, and m is the mass of adsorbent (g) used. Three sets of level experiments were conducted and the average values were calculated for accurate investigation.
Experimental design for batch adsorption study.
Results and discussion
Characterization of NC-cotton
FTIR analysis, XPS characterization, and SEM study of NC-cotton were conducted to describe the characteristics of NC-cotton. The grafting rate of β-CD on cotton fibers was determined to confirm whether β-CD was cross-linked to cotton fibers.
FTIR analysis of NC-cotton
The infrared spectra of ACF (a), CD-cotton (b), and NC-cotton prepared (c) are shown in Figure 2. In the spectrum of CD-cotton (b), a new peak appeared at 1729 cm−1, which showed the carbonyl (C=O) stretching vibration of the aldehyde group and indicated cotton fiber had been oxidized by NaIO4. The characteristic peak of β-CD and cellulose roughly coincides due to β-CD and cellulose being composed of cyclic glucose, 32 so the grafting rate of β-CD on cotton fibers was determined according to spectrophotometric method 30 to verify β-CD being grafted onto cotton fibers in the article. In the spectrum of (c), the peak at 1729 cm−1 disappeared, and a new peak at 1558 cm−1 appeared, which was attributed to N–H bending vibration absorption peak of imine group in NC-cotton. The weakening band at 1427 cm−1 revealed the reduction in intermolecular or intramolecular hydrogen bonding between the hydroxyl groups of cellulose from cotton fibers to NC-cotton fibers. This indicated that the crystallinity of the cotton fibers reduced after chemical modification. The characteristic absorption bands of cellulose at about 3420, 2900, 1640, 1060, and 896 cm−1 have no significant change, which suggests that the main composition and structure of the cotton fibers did not change after chemical modification. 33
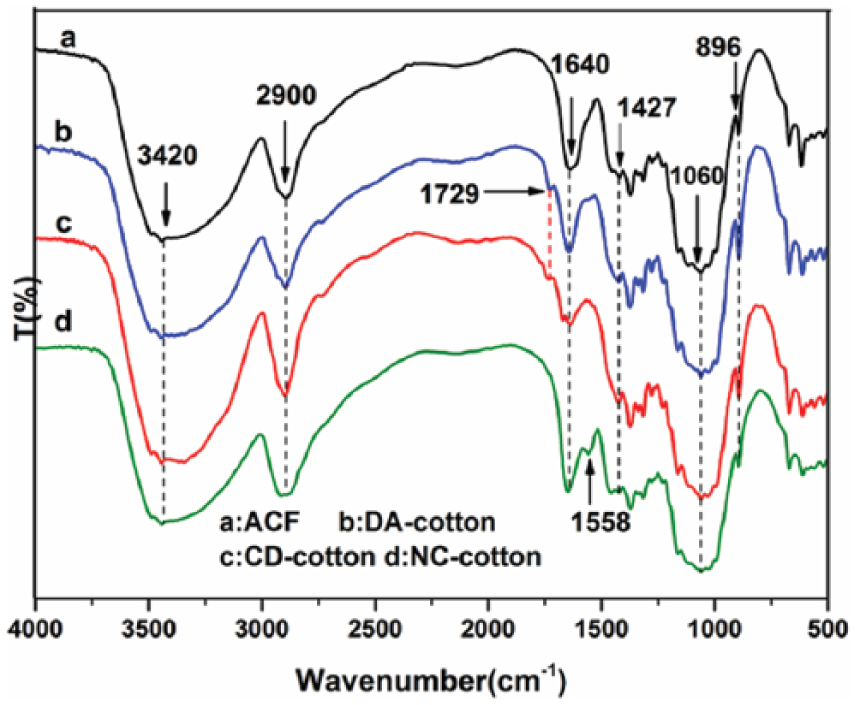
FTIR spectra of ACF, CD-cotton, and NC-cotton.
XPS characterization of NC-cotton
The chemical state of the elements in NC-cotton was further investigated by XPS (Figure 3). The wide scan XPS spectrum (Figure 3(a)) of ACF, CD-cotton, and NC-cotton displayed photoelectron lines at binding energies of about 284, 399, and 530 eV, which can be attributed to C1s, N1s, and O1s, respectively. The high resolution C1s peaks of ACF, CD-cotton, and NC-cotton are shown in Figure 3(b) to (d). The C1s peak of ACF can be divided into two components (Figure 3(b)): the carbon in C–C (284.5 eV) and the carbon in C–O (286.2 eV). The C1s peak of CD-cotton can be divided into three components (Figure 3(c)): the C–C species (284.6 eV), C–O species (286.2 eV), and C=O species (288.2 eV). The C1s spectra of the NC-cotton contains three peaks at 284.6, 285.5, and 286.4 eV, corresponding to the C–C, C–N, C–O bonds, respectively (Figure 3(d)). Obviously, the nitrogen element existed in the NC-cotton due to the chemical interaction.

XPS spectra of ACF, CD-cotton, and NC-cotton: (a) wide scan, (b) C1s spectra of ACF, (c) C1s spectra of CD-cotton, and (d) C1s spectra of NC-cotton.
SEM study of NC-cotton
The surface morphology of cotton fibers after modification with β-CD and NH2-HBP, respectively, is revealed by SEM. As shown in Figure 4, the surface of ACF (a) was smooth and has no obvious feature. There are many grooves and cracks on the surface of DA-cotton (b) and CD-cotton (c), which could be attributed to the oxidation and hydrolysis of the cellulose macromolecule chains, leading to part of the cellulose molecular chain breaking, and the further decomposition of the crystal zone. The CD-cotton had a somewhat smooth surface compared to DA-cotton, while there was no clear evidence that grafting reaction (β-CD and cellulose) had occurred by SEM analysis. Some grooves on the surface of NC-cotton (d) were filled up with NH2-HBP and appeared like cross-linked layer, indicating NH2-HBP coated to the surface of cotton fibers.

SEM images: (a) ACF, (b) DA-cotton, (c) CD-cotton, and (d) NC-cotton.
The grafting rate of β-CD on cotton fibers
The grafting rate of β-CD on cotton fibers was determined according to spectrophotometric method. 30 Phenolphthalein standard solution (250 mg/L) (volume ratio of ethanol to water was 1:1), anhydrous sodium carbonate standard solution (30 mg/L), and a series of β-CD standard solutions of different concentration (10, 15, 20, 25, 30, 35, 40, 45, and 50 mg/L) were prepared. The maximum absorption wavelength of the phenolphthalein solution was determined to be 553 nm. Phenolphthalein (2 mL) and anhydrous sodium carbonate standard solution (2 mL) were added into the above β-CD standard solutions (50 mL) and mixed evenly, respectively, and the absorbance was measured at 553 nm. And the absorbance drop value was obtained using the absorbance value of the blank solution without β-CD subtracting the absorbance value of mixture solutions with β-CD and phenolphthalein. Then the standard curve could be drawn (the concentration of β-CD as X-axis and the absorbance drop value as Y-axis). A certain amount of cotton fiber grafted β-CD was added to the solution containing phenolphthalein and sodium carbonate, and the absorbance of the solution at 553 nm was measured after 30 min. The grafting rate of β-CD on cotton fibers was calculated according to formula (3)

where R (mg/g) is the grafting rate of β-CD on cotton fibers, C is the concentration of β-CD, V is the volume of solution, and m is the mass of fibers. The experimental results showed that the grafting rate of β-CD on cotton fibers was about 80.8 mg/g in CD-cotton.
Effect of pH on adsorption
The effect of initial solution pH on the adsorption capacity was studied at adsorption equilibrium conditions. The pH value of the solution plays a significant role in the adsorption process, which can influence the surface charge of the adsorbent, the degree of ionization, even the molecule structure of the adsorbate in the solution.34,35 The effects of pH on adsorption are displayed in Figure 5. Figure 5(a) shows the variation of maximum absorption wavelength and absorbance at the same concentration (10 mg/L) and different pH values. It can be seen that the maximum absorption wavelength and absorbance changed constantly when pH value was smaller than 6.5, and the maximum absorption wavelength and absorbance did not change when pH value was greater than 6.5. It suggested that the pH value could change the molecule structure of CR in aqueous solution. In addition, CR has a pKa value at 4.5–5.5, which can exist in both cationic form at acidic pH and anionic form at basic pH. 36 In addition, the adsorbent surface charge is affected by pH values in the processing of adsorption. 37 The surface charge of raw cotton and NC-cotton was studied by zeta potential measurement in pH range 3–12, as shown in Figure 5(b), and the isoelectric point of NC-cotton is 6.8. For NC-cotton, it is positive at low pH due to the protonation of amino and imino groups form NH2-HBP (−NH2 + H+ → NH3+). Particularly, owing to the introduction of NH2-HBP onto cotton, zeta potential value of NC-cotton is always higher than that of raw cotton over the whole pH range. This phenomenon reveals the excellent electrostatic adsorption capacity of NH2-HBP as an adsorbent component in NC-cotton. With the increase in the pH value, the zeta potentials decrease and become negative, resulting from the deprotonation of corresponding groups under alkalic condition. As shown in Figure 5(c), The adsorption capacity for CR is relatively large in acid medium, and the most CR adsorption value was obtained at pH 6. At lower pH, CR and NC-cotton both exhibit a positively charged surface due to the protonation of nitrogen atoms and sulfonate groups for CR and amino groups for NC-cotton,36,38 hindering the adsorption by electrostatic repulsion. As pH increased to 6, the surface of NC-cotton is positively charged, and an electrostatic attraction generated with negatively charged CR, which led to a maximum adsorption capacity of 243 mg/g at round pH 6. As pH increases from 6 to 12, the negative charge on the surface of NC-cotton prevents the adsorption of negatively charged CR. Remarkably, the adsorption for CR decreases dramatically at pH >10, which is ascribed to strong electrostatic repulsion and the competitive adsorption of hydroxide ion. It can be seen from Figure 5(c) that the adsorption capacity for MB improved with the initial pH growth. MB is a typical cationic dye, and NC-cotton became deprotonated as pH increased, which led to the electrostatic attraction was enhanced between MB and the adsorbent with increasing pH value. In addition, hydrophobicity of MB was enhanced and the effect on electron-rich cavity of β-CD was weakened with the increase in pH value, and promoting MB molecule more easily enter the cavity of β-CD forming stable inclusion. CR is a typical anionic dye, so NC-cotton containing amino groups showed larger adsorption capacity for it. Notably, electrostatic attraction is not the only mechanism of adsorption. Hydrogen bonding force and inclusion complex formed by host-guest interaction also promote the adsorption for dyes by NC-cotton. 39 The dyes adsorption by β-CD in NC-cotton might be characterized by hydrogen bonding and inclusion.

(a) UV–vis spectra of CR varying with pH, (b) effect of pH values on the adsorption capacity of NC-cotton, and (c) zeta potential curve of raw cotton, CD-cotton, and NC-cotton.
Effect of adsorbent dosage
The effect of adsorbent dosage on adsorption for CR and MB was evaluated by the weight range from 0.05 to 0.4 g and 100 mL solution of 500 mg/L. As shown in Figure 6, highest efficiency is about 94% for CR and 42% for MB at 0.4 g, and highest adsorption is 300.8 mg/g for CR and 98.7 mg/g for MB. Higher removal of dyes with increasing adsorbent dosage is attributed to the increase in total adsorbent surface area and adsorption sites. 37 It showed no apparent change in the removal efficiency for CR and MB as adsorbent amount increased to more than 0.2 and 0.3, respectively. This phenomenon might be ascribed to the aggregation of adsorbent, decreasing the surface area and less adsorption sites available. 39 In addition, the amounts of adsorbent might affect the physical properties of the solid–liquid suspensions and inhibit dye molecules to diffuse onto the adsorbent surface. 40 Therefore, 2.0 g/L adsorbent dosage is considered as suitable for CR and MB removal in this study.

Effect of adsorbent dosage on the removal efficiency and adsorption capacity.
Adsorption isotherms
The adsorption isotherm is used to describe how the adsorbent interacts with the adsorbate, which is critical for optimizing the use of the adsorbent. In order to optimize the design of an adsorption system to remove pollutants from solutions, it is important to establish the most appropriate correlation for the equilibrium curve. In this study, the Freundlich and Langmuir adsorption isotherms were constructed using the adsorption equilibrium data of CR and MB by NC-cotton. The Langmuir isotherm model presumes that adsorbate can cover on the surface of adsorbent with monolayer and often valid for homogeneous surfaces of adsorbent. The linearized Langmuir equation (4) 41 is expressed as follows

where qe is the equilibrium adsorption capacity (mg/g), Ce is the equilibrium concentration (mg/L) in solution, and qm is the maximum amount of adsorption (mg/g). Langmuir constants (KL) is the adsorption equilibrium constant related to the energy of adsorption.
The Freundlich isotherm model is suitable for adsorbent of highly heterogeneous surfaces. The Freundlich equation (5)42,43 is expressed by the following equation

where qe is the equilibrium adsorption amount (mg/g), KF is the Freundlich constant related to the bonding energy, and n is Freundlich constant. 1/n determines the energy and intensity of the adsorption reaction, and the value of n from 2 to 10 indicates beneficial adsorption. 43 The influence of initial concentrations on the adsorption capacity of NC-cotton, the linear fitting of Langmuir isotherm, and Freundlich isotherm for CR and MB are shown in Figure 7, respectively. The adsorption constants for Freundlich and Langmuir adsorption isotherm models and the correlation coefficients (R2) with the experimental data are listed in Table 2.

(a) Influence of initial concentrations on the adsorption capacity of NC-cotton, (b) Freundlich adsorption isotherm of NC-cotton, and (c) Langmuir adsorption isotherm of NC-cotton.
Langmuir and Freundlich parameters for adsorption isotherms of NC-cotton.

CR: Congo red; MB: methylene blue.
From the results of Figure 7 and Table 2, the adsorption of CR and MB on NC-cotton conformed better to the Freundlich isotherm model (R2 = 0.9984, 0.9952) than the Langmuir isotherm model (R2 = 0.9381, 0.8255). Apparently, the plots in Figure 7 and Table 2 demonstrate that the Freundlich isotherm model provided a reasonable description for the experimental data. It can be seen from Figure 7 and Table 2 that the adsorption capacity for CR by NC-cotton was more larger than MB. NC-cotton can show polycation characteristics because it contains many amino and imino groups, 24 so it could aggregate more CR molecules at certain pH value by electrostatic attraction. It can be suggested that the adsorbent was more effective in adsorbing anionic dyes than cationic dyes.
Adsorption kinetics
The study of adsorption dynamics is important in water treatment. It describes the solute adsorption rate, which commands the residence time of adsorbate adsorption at the solid–solution interface.44,45 The adsorption kinetics was evaluated using both the pseudo-first-order (6) and the pseudo-second-order (7) equations 44 to represent the controlling adsorption mechanism of CR and MB onto the NC-cotton in this study


where qt and qe are the amount adsorbed at time t and at equilibrium (mg/g), k1 (min−1) and k2 (g/mg min) represent the rate constants of the pseudo-second-order kinetic equations, respectively. The adsorption process for CR and MB was completed within 12 h. Adsorption capacity for CR and MB, the pseudo-first order, and pseudo-second order adsorption kinetics for CR and MB are shown in Figure 8. It can be seen that adsorption equilibrium was reached within 4 h for MB, and within 6 h for CR. It took longer time to achieve adsorption equilibrium for CR than MB, which could be due to a more larger adsorption for CR by NC-cotton, and needing longer time to establish equilibrium. The corresponding parameters calculated and experimental adsorption capacities were shown in Table 3. It can be seen that pseudo-second order model shown better fit to the experimental data, and R2 close to 1.0 compared to pseudo-first order model, and the theoretical adsorption capacities (qe2) calculated from pseudo-second-order kinetic equation were closer to qe for CR and MB, which demonstrated pseudo-second-order kinetics could reasonably describe the adsorption process. 37

(a) Adsorption behavior for CR and MB, (b) pseudo-first-order kinetic plots of NC-cotton, and (c) pseudo-second-order kinetic plots of NC-cotton.
Kinetic parameters and experimental adsorption capacities.

CR: Congo red; MB: methylene blue.
Conclusion
Cotton fibers were chemically modified with NH2-HBP and β-CD, and its characteristics and application for removal of CR and MB from aqueous solution were investigated in this work. It could reach adsorption equilibrium within 4 h for MB and 6 h for CR. The Langmuir adsorption capacities were350.8 mg/g for CR and 102.7 mg/g for MB, respectively. The adsorption processes for dyes were more agreed with pseudo-second-order kinetic equation and Freundlich isothermal model. The adsorption mechanism for CR and MB might involve several kinds of interactions: electrostatic attraction hydrogen-bonding and host–guest inclusion. Compared with many adsorbents derived from natural materials in the literature, NC-cotton showed good performance for removal of dyes (Table 4). All the results indicated that NC-cotton was efficient for removal of dyes, and especially, for the anionic dyes.
The Langmuir maximum capacity of various adsorbents for dyes.

CR: Congo red; MB: methylene blue.
Footnotes
Declaration of conflicting interests
The author(s) declared no potential conflicts of interest with respect to the research, authorship, and/or publication of this article.
Funding
The author(s) disclosed receipt of the following financial support for the research, authorship, and/or publication of this article: This research was funded in part through a grant by the National High Technology Research and Development Program of China (No.2012AA030313), Key Laboratory for Processing of Sugar Resources of Guangxi Higher Education Institutes(2015TZYKF03), and Basic capacity improvement project of young teachers in the Guangxi Zhuang Autonomous Region (2016).