
Abstract
A recent challenge is how to mix qualitative interpretation with computational techniques to analyze big qualitative data. To this end, we propose “multi-resolution design” for mixed method analysis of the same data: qualitative analysis zooms-in to provide in-depth contextual insight and quantitative analysis zooms-out to provide measures, associations, and statistical models. The raw qualitative data is transformed between excerpts, counts, and measures; with each having unique gains and losses. Multi-resolution designs entail transforming the data back-and-forth between these data types, recursively quantitizing and qualitizing the data. Two empirical studies illustrate how multi-resolution design can support abductive inference and increase validity. This contributes to mixed methods literature a conceptualization of how mixed analysis of the same big qualitative dataset can create tightly integrated synergies.
Technological advances are expanding the potential of mixed methods research (Chang et al., 2021; Sripathi et al., 2024). Digitization is creating an exponential growth in qualitative data, such as social media posts, videos, documents, and transcripts. Simultaneously, algorithms are increasingly able to analyze qualitative data at scale, including categorizing entities, assessing semantic similarity, and visualizing data. These advances create opportunities and challenges.
The opportunity is to obtain frictionless method integration during analysis. Anchoring both human-qualitative and computational-quantitative analyses in the same data can create tightly integrated findings. This could circumvent the traditional tradeoff between depth (prioritized in qualitative analysis) and breadth (prioritized in quantitative analysis), yielding an analysis that is simultaneously grounded in particulars and robustly general (Shahin, 2016).
The challenge is to conceptualize how a single big qualitative dataset can be analyzed qualitatively and quantitatively simultaneously. Traditionally, mixed methods research focused on mixing separate silos of qualitative and quantitative data, either in parallel or in sequence. But, big unstructured qualitative datasets (e.g., heterogeneous collections of text, images, videos), can be recursively restructured for both qualitative and quantitative analyses.
We propose and develop “multi-resolution design” to conceptualize using qualitative analysis to “zoom in” on contextualized particulars and quantitative analysis to “zoom out” revealing statistical patterns (Gillespie et al., 2024). Multi-resolution designs are exploratory, recursive, and transformational. As with transformation designs, qualities are converted into quantities, but, this process is bidirectional and occurs throughout the analysis. As with recursive designs, the analysis moves back-and-forth between qualitative and quantitative analyses, but, crucially the qualitative and quantitative methods are analyzing the same data.
Our aim is to conceptualize how qualitative interpretation and quantitative-computational analyses can be combined to analyze the same qualitative dataset. First, we review the growing number of studies that combine methods to analyze the same data, arguing that these emerging studies need more conceptualization. Second, we use the mixed methods literature to conceptualize multi-resolution designs as recursive transformation (qualitizing and quantitizing) during the analysis phase. Third, we analyze the gains and losses of structuring raw data for qualitative and quantitative analyses, and argue that recursively restructuring the data can accrue gains, offset losses, and harness synergies. Finally, we use two research studies, each with an interactive visualization that enables zooming in and out, to illustrate how a multi-resolution design can support abductive inference (i.e., theory creation) and increase the validity of research.
Mixed Analyses of Big Qualitative Data
Analyzing the same data quantitatively and qualitatively, termed mixed analysis, is increasing (Onwuegbuzie & Johnson, 2021). While there is a long history of mixed analysis with interview (Fakis et al., 2014) and focus group (Vogl, 2019) transcripts, it has recently burgeoned in big data studies of social media (Andreotta et al., 2019; Rodriguez & Storer, 2020). This increase is being driven by technological advances in storing, quantifying, and visualizing big qualitative datasets (O’Halloran et al., 2021).
Mixing qualitative and quantitative methods is particularly suited to big qualitative data. Indeed, qualitative interpretation is already routinely used within computational techniques (Chen et al., 2018) to identify features to measure and model, create human-labeled datasets for training algorithms, interpret clustered output from unsupervised techniques (e.g., LDA/Bert clustering), and create textual measures (Boyd & Schwartz, 2021).
Qualitative and computational analyses have complementary strengths. Comparisons consistently find that computational analysis is more efficient and reliable, while manual analysis is more subtle and contextual (Chang et al., 2021; Ho et al., 2021; Kermani et al., 2024). Automated techniques rely on lexical features while manual analysis can interpret the context (Rodriguez & Storer, 2020)—although this is changing with the advent of large language models (Ziems et al., 2024). Simply put, manual qualitative analysis is a valuable limited resource that should be targeted at phenomena that are subtle, contextual, or not easily defined.
There have been several proposals to formalize mixing qualitative interpretation with computational analysis. Shahin (2016) advocates two steps: (1) using natural language processing algorithms to provide a statistical overview; and (2) using in-depth manual analysis to examine interesting sub-samples. Refinements of this basic quantitative-to-qualitative sequence include adding computational steps for obtaining and cleaning data (Andreotta et al., 2019) and adding a final step for integrating the analyses (Chang et al., 2021).
These proposals provide useful step-by-step procedures for obtaining, cleaning, summarizing, sampling, and interpreting big qualitative datasets. However, they still conceptualize the qualitative and quantitative analyses separately, overlooking the potential for deeper integration of analysis and findings, such as by using qualitative-quantitative visualizations (Guetterman et al., 2015; O’Halloran et al., 2021). Also, more theorization is required (Onwuegbuzie & Johnson, 2021): How can the same raw data be structured to enable both qualitative and quantitative analyses? What are the tradeoffs of each type of data structure? And, what are the potential synergies?
Recursive-Transformative Mixed Analyses
Mixed methods theory conceptualizes how qualitative and quantitative approaches are integrated to yield findings that are more than the sum of the parts (Fetters & Freshwater, 2015). Fetters and Molina-Azorin (2017b) identify 15 dimensions of possible integration, including, theoretical, researcher, literature, sampling, design, research aims, data collection, analysis, and interpretation. Integration usually occurs during the final interpretation phase, when analyses, based on siloed qualitative and quantitative datasets, are synthesized. In contrast, multi-resolution designs pertain to integration during the analysis phase.
Integration during analysis has been rare (Bryman, 2006; Greene et al., 1989), but there is growing interest (Onwuegbuzie & Johnson, 2021). There are three ways that integration can occur during analysis (Love & Corr, 2022; Vogl, 2019). First, one form of data can be used to inform another. This can be either exploratory (e.g., using interviews to develop survey items) or explanatory (e.g., surprising experimental results being followed up with interviews or observations). Second, one form of data can be used to organize another. This could include grouping qualitative data in terms of quantitative variables (e.g., demographics, assessment scores, outcomes) or vice versa (e.g., grouping scores in terms of emergent qualitative types). Third, one form of data can be transformed into another, such as, converting text or images into numbers by counting or scoring. Multi-resolution designs are of this third type, namely, integration through data transformation.
There are two types of data transformation, or conversion: quantitizing and qualitizing (Teddlie & Tashakkori, 2009). Quantitizing entails converting qualities into quantities (Sandelowski et al., 2009). For example, Onwuegbuzie and Leech (2005) analyzed qualitative data thematically and then converted it into binary variables that were subsequently analyzed quantitatively. Qualitizing is less frequent and less clearly conceptualized (Nzabonimpa, 2018). It entails converting quantities into qualities, such as: creating narrative summaries of quantitative findings, defining qualitative types based on scores, and also examining the qualitative particulars that underpin quantities (Creamer, 2017; Vogl, 2019). While quantitizing and qualitizing are usually conceptualized as unidirectional, multi-resolution designs use both bidirectionally as data is transformed back-and-forth between qualitative and quantitative forms.
This bidirectional quantitizing and qualitizing can be conceptualized as a recursive mixed methods research design. Recursive research designs are rare (Teddlie & Tashakkori, 2009) and have focused on moving between separate qualitative and quantitative datasets (e.g., Christ, 2007; Kerrigan, 2014; Nzabonimpa, 2018). For example, Nastasi et al. (2007) report on a mental health improvement project in Sri Lanka where the intervention was iteratively modified over several years based on recursively analyzing qualitative (participant observation, interviews, focus groups) and quantitative (psychological measures, outcomes) datasets. Multi-resolution research, however, entails tighter recursion because it is based on the same dataset; meanings are transformed into numbers and the numbers are reverted to meanings.
A multi-resolution design, as a recursive transforming design, leverages aspects of both exploratory and sequential designs (Creswell & Creswell, 2018). Exploratory sequence designs begin with a qualitative analysis that feeds forward into a quantitative analysis that is grounded in the qualitative analysis. Explanatory sequence designs begin with a quantitative analysis that feeds forward into a qualitative analysis that aims to generate plausible explanations for the quantitative findings. Recursively moving back-and-forth between the qualitative and quantitative analyses creates a synergistic loop of grounding the quantitative analysis in qualitative particulars and generating plausible explanations for the quantitative findings.
In summary, multi-resolution research entails recursively transforming qualities into quantities and reverting quantities back into qualities. The qualities add validity and insight to the quantities, and the quantities add context and rigor to the qualities. Moreover, discrepancies between the qualitative and quantitative methods become more productive because they can confidently be attributed to the analyses rather than being an artefact of different datasets (e.g., time, context, or method of data collection).
Quantitizing and Qualitizing Tradeoffs
Qualitative and quantitative data are often presented as fundamentally different (e.g., Creswell & Creswell, 2018; Morgan, 2007), and even belonging to incommensurable paradigms (Guba & Lincoln, 1994). Qualitative data, it is argued, pertains to qualia, experiences, and meanings while quantitative data pertains to quanta, frequencies, and statistical associations (Shweder, 1996). While these are important differences, the distinction is often over-stated and has been criticized as misleading and unhelpful (Creamer, 2017). Moreover, in research practice the distinction often becomes fuzzy (Bazeley, 2017; Knappertsbusch, 2020).
Quantification can occur in qualitative research. For example, frequencies are routinely relevant to the claims being made. Phrases such as: “the majority of cases,” “most respondents,” “some participants,” “frequently following the same pattern,” and “more often than not” occur in qualitative research (Hammersley, 1996; Morgan, 2018). Such phrasing reveals that quantitative statements provide a valued background for interpreting qualitative data and making qualitative contributions.
Qualitative judgment is widespread in quantitative research. Most quantitative research entails the quantification of qualitative phenomena; turning observations, behaviors, and experiences into numbers (Berka, 1983; Trochim & Donnelly, 2021). Survey respondents quantify experiences using verbal anchors such as “sometimes” and “rarely” (French et al., 2007; Wagoner & Valsiner, 2005). The qualitative element also lurks in questions of validity, when, for example, a measure is evaluated through qualitative assessment (e.g., expert raters, concept sorting, face-validity checks, exit interviews; Gobo et al., 2022).
Given these overlaps between qualitative and quantitative methods, there have been arguments to abandon the dichotomy (Knappertsbusch, 2020). However, abandoning the distinction would be rash (Morgan, 2018). Instead, we propose that qualitative and quantitative data are not different ontological types, but instead merely different transformations of human events into data.
All data originates in events, namely, unstructured human activity. Data is created by structuring records of these events. Although all data is conceivably revertible to the originating events, this is challenging with traditional quantitative methods (e.g., surveys, experiments) where the output is usually data with a predefined quantitative structure. Thus, when choosing a traditional method of data collection, one is often also choosing a type of data, and thus also making a commitment to a certain type of analysis. However, big qualitative data does not have this predefined structure. Instead, it offers a choice: how should the raw data be structured?
Data Types Created From Human Activity.
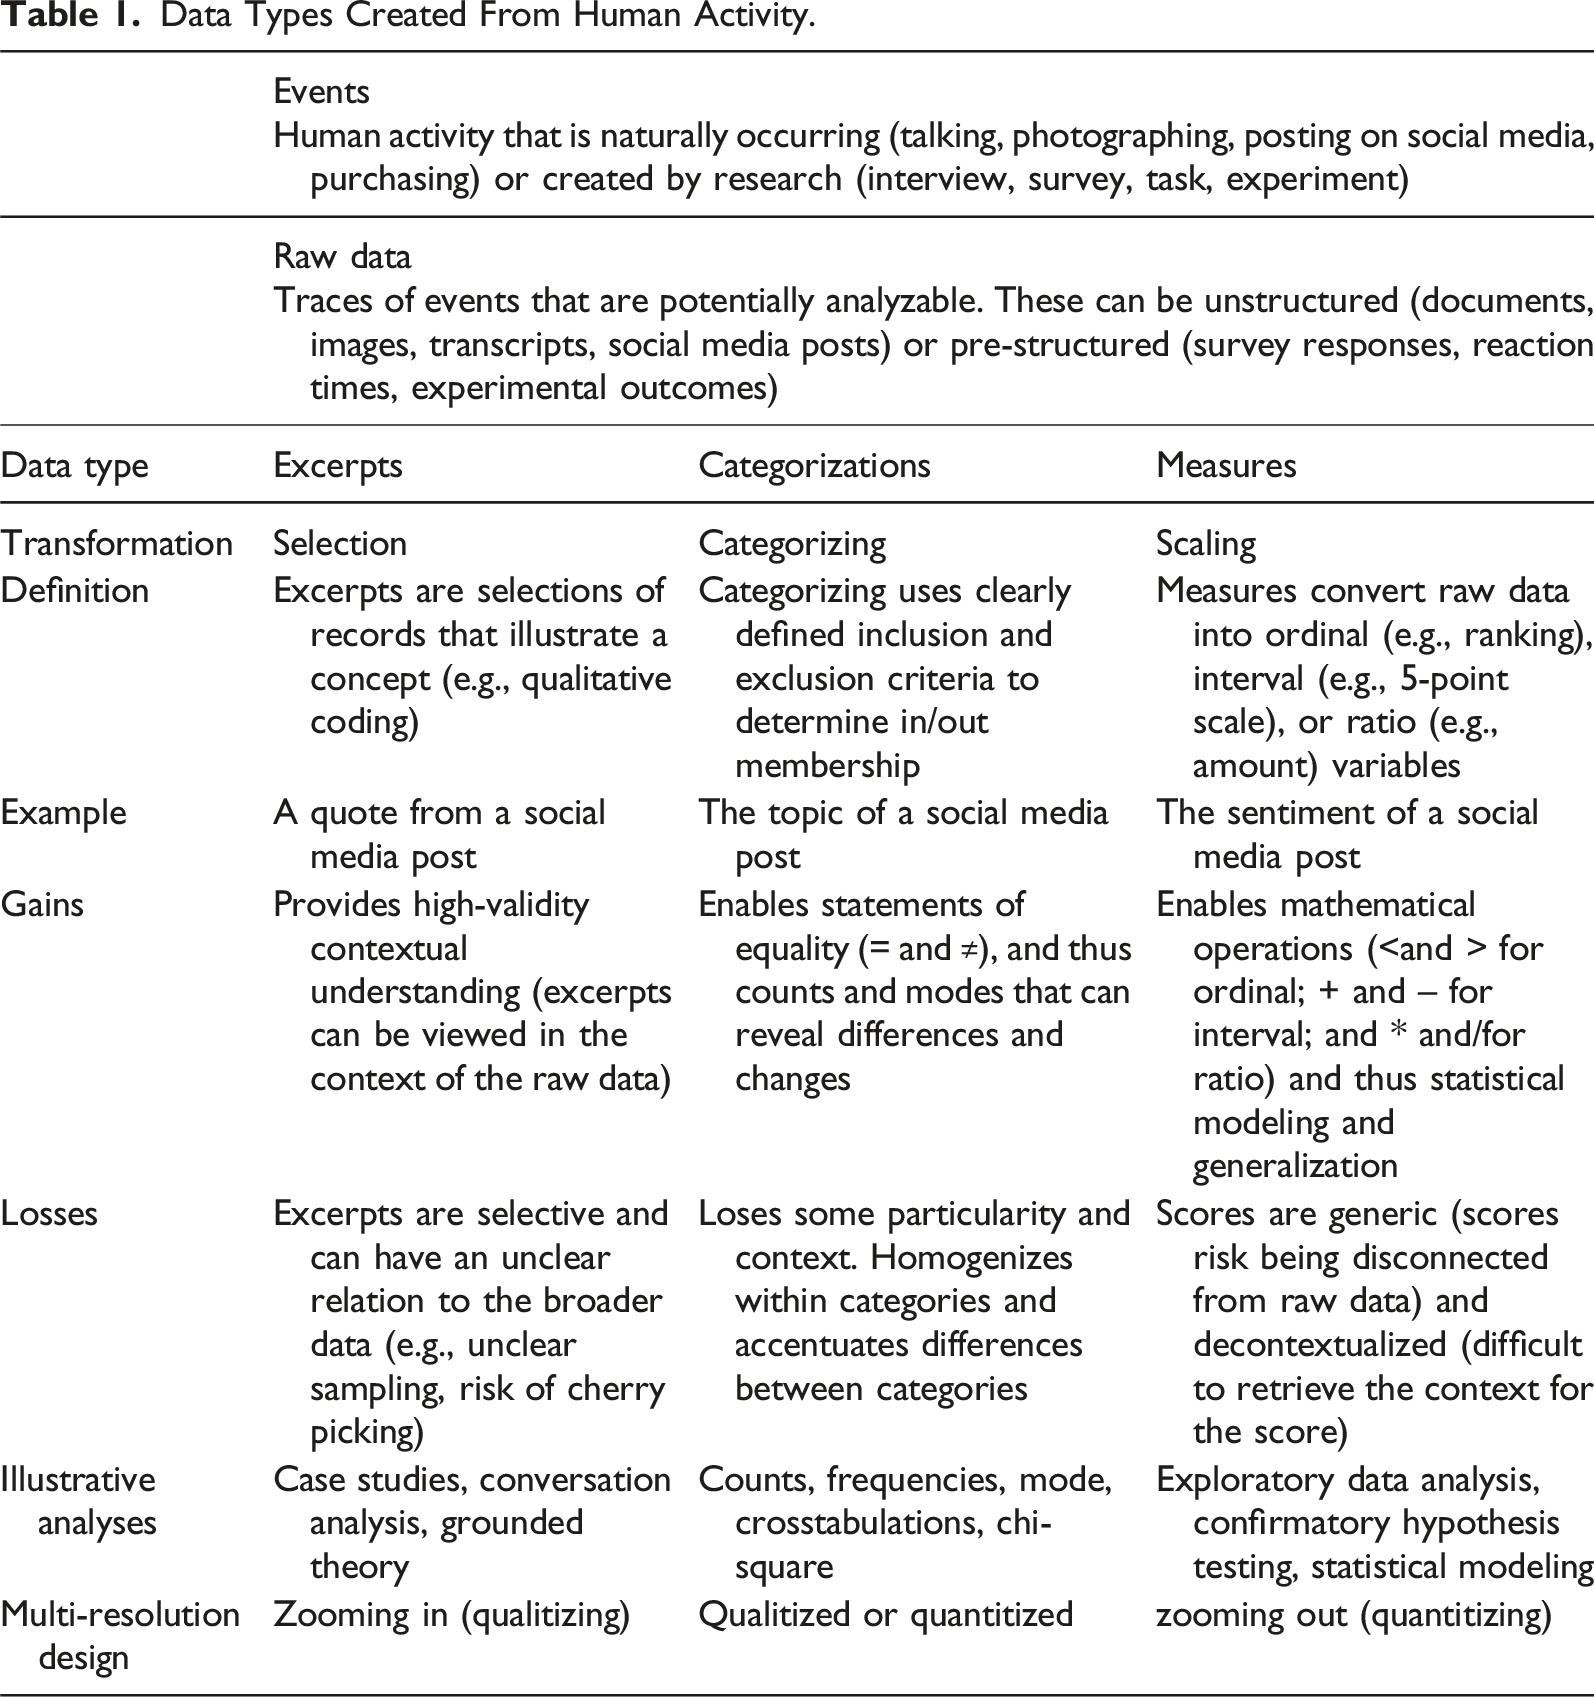
Events refer to what actually happened (people talking, shopping, playing, working, posting, writing, etc.). Each event is an abundance of infinite potential and could be the basis for numerous analyses (Feyerabend, 2001). These “pre-data” events are maximally rich, contextual, and particular. The first in research is creating records of these events. For example, conversations are audio recorded and then transcribed and social media activity leaves a digital footprint of text, images, and metadata.
Raw data are the collected traces or records of events. Traditionally they have been pre-structured during data collection as either qualitative (e.g., interviews) or quantitative (e.g., survey ratings). Naturally occurring data, on the other hand, is unstructured. It is valuable because it is part of society reproducing itself (e.g., not artificial), but, because it was not engineered for research, it can be messy (unclear sampling, missing or bot-generated data). Accordingly, naturally occurring raw data requires wrangling and cleaning to become suitable for research. Moreover, because it is not pre-structured, naturally occurring data often offers a choice of data structures. For example, should social media posts be interpreted as excerpts? Or categorized as positive or negative? Or scaled using an algorithm for measuring sentiment?
Excerpts refer to a selection of raw data that forms the basis for an in-depth interpretative analysis. Typically, the researcher identifies bits of text or image that illustrate a theme in the data or a concept in the literature. Examples of theory-driven interpretation of excerpts include identifying third-turn repairs (Schegloff, 1992) and analyzing multivoicedness (Aveling et al., 2015). Analyzing excerpts is particularly useful for ambiguous, contextual, or multidimensional concepts—termed ballung concepts (the German word for cluster or congestion; Cartwright & Bradburn, 2011). These concepts are characterized by family resemblance, with multifaceted meanings that vary depending on the context and audience. For example, concepts such as “culture,” “power,” or “practices” help to sensitize researchers to aspects of the data. One limitation of excerpts is that it can be difficult to justify the selection or explain how it relates to the population.
Categorizations are more formally operationalized than excerpts. They have clear definitions with inclusion and exclusion criteria. Categorization is essentially a judgment of equivalence (= and ≠) because everything within a category is equal and everything outside the category is different. Examples include categorizing comments as toxic, themes in news articles, or people in pictures. These categorizations cannot be ranked or ordered on a scale. However, instances of a category can be counted. Categorizations tend to obscure within-category differences (e.g., one can count people and treat them as equivalent, but no two people are the same).
Measures entail systematically scaling empirical qualities to a concept being measured (Zeller et al., 1980). Phenomena with zero values (e.g., reaction time, number of sweets eaten) are measured using ratio scales. Phenomena without zero values but with equal intervals (e.g., date, location) are measured using an interval scale. Phenomena without a zero value and with unequal intervals (e.g., preferences, ordered categories) are measured using rank orders. Transforming raw data into measures gains powerful mathematical operations, but there is always a loss of specificity (subtle differences between units and intervals are suppressed). But, there are phenomena that are not suited to measurement (Berka, 1983; Zeller et al., 1980), such as, phenomenological experience (e.g., qualia), categorical phenomena (group membership), and ballung concepts (e.g., heuristics, culture), and forcing measurement of such phenomena leads in invalid measurement.
A multi-resolution design entails recursively transforming and restructuring raw data so as to enable both quantitative and qualitative analyses. Qualitizing provides particularity and context, but, the relation between the excerpts and the larger dataset is often unclear. Quantitizing gains statistical operations and can reveal subtle patterns only evident in aggregated data, but, it can obscure subtleties. By recursively transforming raw data into excerpts, categories, and measures it is possible to accrue gains and offset losses.
Illustrating the Added Value of Multi-Resolution Designs
Forcing a choice between transforming raw data into excerpts, categories, or measures limits the potential of the raw data to add value through multiple transformations. Recursive data re-structuring (i.e., moving back-and-forth between excerpts, categories, and measures) leverages the full breadth and depth of the data. Some of the resultant synergies are already clearly conceptualized in the mixed methods literature (Bryman, 2006; Greene et al., 1989).
Zooming-in, moving from measures towards the excerpts of the raw data, enables rich description (what is the phenomenon being measured?), conceptual framing (can the phenomena be conceptualized using various concepts?), and generating explanations (why was X not associated with Y?). Such zooming-in can offset the weaknesses of quantitative analysis (i.e., adding particularity and context), illustrate results, challenge results, explore the processes underlying statistical trends, and generate explanations for unexpected quantitative results.
Zooming-out, by structuring the raw data in terms of categories and measures, enables counting and measurement (how frequent is the observed phenomenon?), testing relationships (is Y associated with X?), and exploring associations (what might be associated with the phenomena?). Such zooming-out can offset the weaknesses of qualitative analysis (e.g., situating excerpts within the larger dataset), add completeness to the analysis (e.g., frequencies, differences, changes), and increase robustness and generalizability.
In addition to these established synergies, we argue that back-and-forth zooming-in and zooming-out can (1) facilitate abductive inference, and (2) increase the validity of findings. The following sections illustrate these contributions using two empirical studies.
Facilitating Abduction
The creative potential of mixed methods research has long been emphasized (Greene et al., 1989). The recurring idea is that combining qualitative and quantitative methods can yield novel findings that are irreducible to either method (Fetters & Freshwater, 2015). But how does this occur? And how can it be supported?
Compared to the numerous volumes on how to test theories, there is little conceptualization of how to create theories worth testing. Methodology texts emphasize either induction (bottom-up, often qualitative) or deduction (top-down, often quantitative), to the neglect of abduction (creating theories). Abduction entails going beyond data and existing theories to generate explanations for empirical and theoretical anomalies (Peirce, 1955; Tavory & Timmermans, 2014). Although abduction is central to most scientific breakthroughs, it has been difficult to formalize.
For abductive theory building, McGuire (1997) advises obtaining an in-depth grounded understanding of the phenomena and attending to discrepancies, logical tensions, and empirical surprises. Multi-resolution research supports both processes. Zooming into the particulars, what went on (i.e., what was actually said, what was done in the experiment, and the contextual details of an outlying datapoint) enables saturating oneself in the subtle and messy details of the phenomenon. Also, moving back-and-forth between the qualitative particulars and general findings supports discovering tensions, and simultaneously provides the means for probing and investigating them (i.e., by zooming-in or out on the phenomena).
We will illustrate how a multi-resolution design can facilitate abduction using data and findings from a study examining sense-making in online diaries (Zittoun et al., 2023). The aim of this project was to understand how people navigate personal and societal crises and specifically the material, social, and symbolic resources that aid their sense-making and adaptation in situation of vulnerability.
Data
The data were publicly available diaries. For over 20 years, people have been regularly posting public diary entries about their lives to websites (e.g., Open Diary, My Diary). These websites now contain many thousands of diaries some spanning 20 years, making them a valuable data source for studying sensemaking longitudinally. For the present illustration, we focus upon one diary from an unmarried man, without children, who began keeping a diary at age 48 and has over one thousand entries over 22 years (737,461 words across 1206 diary entries). This diary was selected from a sample of 324 diaries based on the following quantitative criteria: the diary spanned over 20 years, had relatively complete coverage, had a substantial drop in sentiment indicating a rupture or crisis, and the diarist consented to our publishing openly on his diary.
Analysis
The text from the diary was obtained and processed in Python. SpaCy (Honnibal et al., 2022) was used to extract entities (people, places, events, books, films), resolve coreferences (e.g., identify that “Mary,” “she,” and “sister” are the same), and create visual overviews of the diary to aid in-depth reading. Sentiment was analyzed using VADER (Hutto & Gilbert, 2014). Plots were created using Plotly (Plotly Technologies Inc, 2022), to track the changing profile of entities, themes, and sentiment over time. Many plots were created and interactively refined in conjunction with a close qualitative reading of the diary.
Figure 1 is a static screenshot of an interactive visualization that plots the diarists’ sentiment in four domains of the diarists’ life. These domains were identified based on a qualitative reading of the diary and then identified computationally using keywords (in terms of data type, these are categorizations). In the plot, each dot represents a diary entry, with the size of the dot indicating the number of sentences that pertain to the domain. The plot has two measures: the Y axis is the yearly rolling average sentiment score for the theme (−1 is most negative and 1 is most positive; Hutto & Gilbert, 2014); and the X axis is the date of the diary entry (from 1999 to 2021). A screenshot of the interactive visualization showing measures (sentiment score, date), categorizations (domains of life), and excerpts (sentences categorized by domain and scored for sentiment).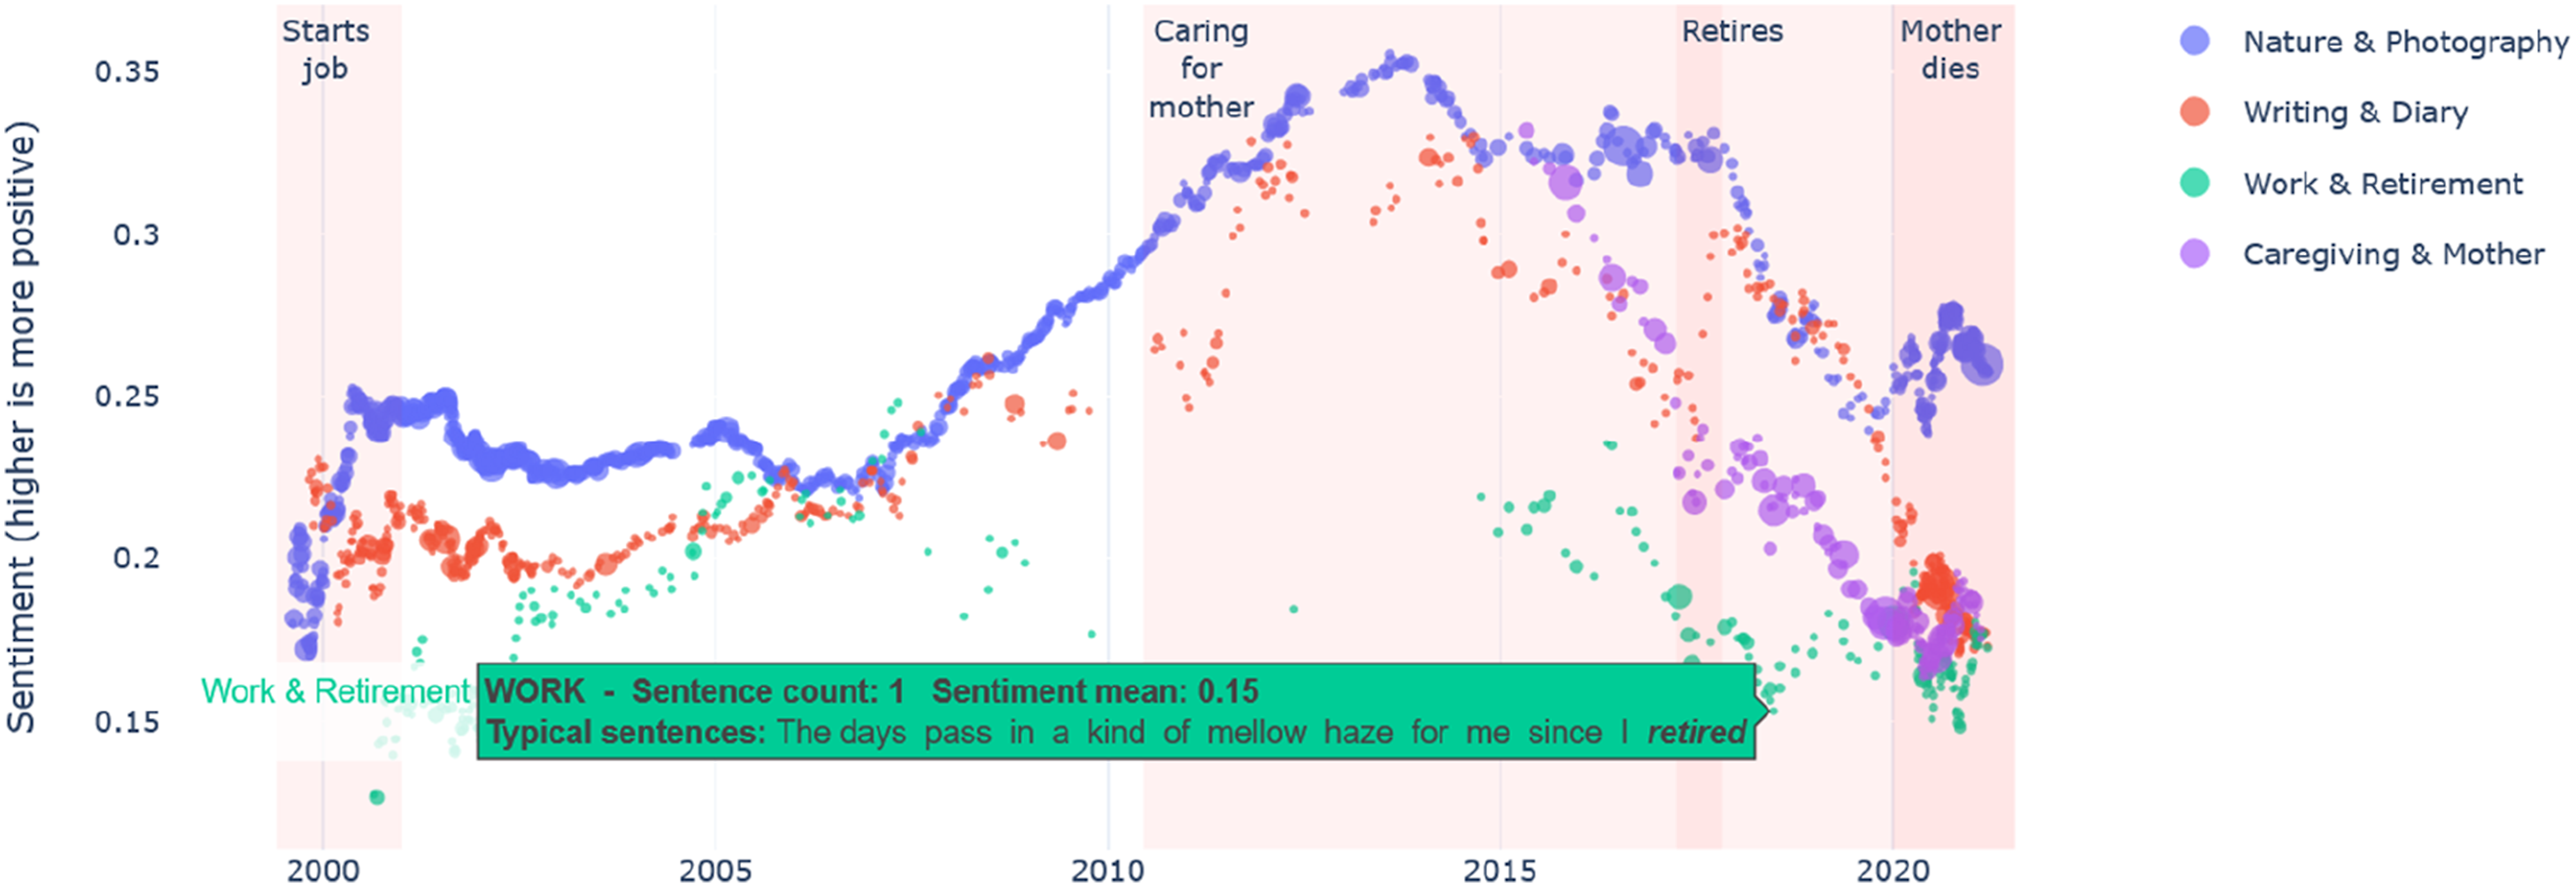
The interactive visualization (https://473x.github.io/mrd/diary.html) has added functionality: hovering over each dot produces a pop-up revealing the sentences represented by the dot (i.e., the excerpts; with bold text revealing the keywords used to categorize the sentence into the given domain), clicking on the center of each dot hyperlinks to the original online diary post (i.e., the raw data; currently disabled to preserve anonymity), the domains can be turned on/off using the legend on the left, and one can zoom in on parts of the figure by drawing a box on the figure. Accordingly, this figure can be used to recursively zoom out (to reveal macro patterns) and zoom in (to reveal the scored excerpts, or sentences, and even the raw data, or original posts). Thus, the interactive visualization preserves the links between the raw data, excerpts, categories, and scores.
Findings
The diarist had suffered from depression (indicated by low sentiment from 2000 to 2010), then he became quite fulfilled in his work (higher sentiment from 2010 to 2017), but then experienced a drop in his wellbeing (lower sentiment after 2017). Figure 1 shows how the sentiment for all four domains drops in 2017, with the lowest sentiment relating to his work. Qualitative analysis revealed that he retired in 2017 to care for his mother who died in 2020.
Zooming in on the posts and sentences talking about work revealed a puzzle; the experience of retirement was unstable. Three years before retirement, it is romanticized: “I want so badly the leisure time and peace that comes with being able to sit on the porch all morning” and “work seems to be less necessary for me now to be the person I have become and am meant to be.” But, in the moment of retirement, with the loss of social contact, is experienced as disruptive and traumatic: “The past two weeks have been an incredible transition period, really difficult psychologically as I’ve struggled with second thoughts” and “I’m feeling a bit lonely – and fighting off occasional, rather intense but brief bouts of depression where I ask myself if I’ve made a horrible mistake in retiring.” But, the imagination of retirement adjusts to become the necessary condition for post-retirement life: “It’s been 2 1/2 years since I retired, and that momentous milestone was one of the best things that ever happened to me” and “I’ve never looked back with the slightest regret about whether it was the right decision to retire.” This re-interpretation of retirement in positive terms is in stark contrast to the zoomed-out view in Figure 1, showing that the overall sentiment of the diary never recovers to the pre-retirement level, due to regular reports about feeling lonely and depressed.
The abductive insight is that singular events (i.e., retirement) can have multiple imaginations (Zittoun & Gillespie, 2015). Retirement shifts from being a reverie, to a crisis, to a resource for sense-making. This adds nuance to the established idea that retirement occurs in stages, from planning, through implementation, to adjustment (Wang & Shi, 2016). Moreover, it reveals potential tensions between the life narrative that adjusts to the transition and the routines of daily life that don’t adjust (i.e., entrenched social isolation).
Discussion
A purely quantitative analysis might have averaged the sentiment about retirement, missing the nuance between phases of retirement, or might have failed to see that although the sentiment does not adjust to retirement, the life narrative does adjust. Equally, a purely qualitative analysis might have failed to see that despite the adjustment of the life narrative, the overall pattern of life and associated sentiment fails to adjust. Moreover, it is the movement between both analyses that reveals tensions: the contrast between the zoomed out analysis (the decline in the sentiment measure across domains) with zoomed in analysis of excerpts (e.g., “one of the best things that ever happened”). Such transformations between measures and excerpts yield productive tensions that spur theory generation.
Enhancing Validity
Multi-resolution designs can increase the validity of findings by adding constraints to interpretation. Both qualitative and quantitative analyses aim to constrain interpretation with empirical data, yet both have also been criticized for having too many degrees of freedom, thus weakening the legitimacy of findings.
Qualitative research has been criticized for “cherry picking,” that is, selectively presenting quotations to suit a given interpretation (Morse, 2010), having poor reliability (Lee et al., 2020) and small samples with unclear generalizability (Seawright, 2016). Multi-resolution designs addresses this by revealing how a given excerpt relates to the larger dataset (e.g., frequency, sampling).
Quantitative research has been criticized for lacking validity (i.e., measures disconnected from the phenomena; Eronen & Bringmann, 2021), over-interpreting spurious correlations (Calude & Longo, 2017), and potentially encoding biases (O’Neil, 2016). A multi-resolution design helps address these concerns by reverting measurements to the underlying qualitative data, thus enabling a continuous checking for validity, causal patterns, and biases.
Multi-resolution research has extra rigor because it is doubly constrained; it must meet the quality criteria for both quantitative and qualitative research. Quantitative research aims for reliability, validity, and generalizability. Qualitative research aims to be credible, contextual, and richly described. Interpretations within a multi-resolution design must satisfy quality criteria both at a statistical level and also at the level of individual excerpts and cases (Seawright, 2016). This double constraint uses the full breadth and depth of raw qualitative data to limit the degrees of freedom. This can enhance overall validity beyond what can be achieved with a thin slice of the data (i.e., only excerpts, categories, or measures).
We illustrate this double-constraint in an experiment reported by Noort and colleagues (2021) about people voicing safety concerns. The literature on people speaking up has been dominated by survey and vignette methods (Noort et al., 2019a). Accordingly, the research team developed an experimental scenario to examine what people actually said when observing the experimenter being unsafe (Noort et al., 2019b).
Data
Participants (n = 404) took part in a brainstorming task on creative use of a plank (maximum weight 30 kg). Once they had completed this scene-setting task, participants evaluated ideas ostensibly suggested by the previous participant, while the research assistant demonstrated the ideas. All participants evaluated the same ideas including the risky suggestion to use the plank as a footbridge between two chairs. When the research assistant (weighing about 60 kg) started to assemble the wobbly footbridge and walk across it, would participants speak up? Would they say the footbridge was unsafe?
Analysis
In addition to several survey measures and traditional statistics, the study analyzed participants’ talk. This talk was measured and analyzed qualitatively in Python using Scattertext (Kessler, 2017; Noort et al., 2021). Figure 2 is a static screenshot of an interactive visualization of participants talk during the experiment. The figure combines excerpts (word-use in context), categorizations (voice/silence, concerned/unconcerned), and measures (probability of each word being in each category). The figure displays the words most spoken by participants who were unconcerned and silent (lower-left), who were unconcerned and yet still voiced (top-left), who were concerned and voiced (top-right), and who were concerned but remained silent (lower-right). In the interactive visualization (https://473x.github.io/mrd/experiment.html) clicking on a word (or searching for it) displays the word-use in context (split by the voice/no voice categorization). A screenshot of the interactive visualization that enables moving between macro patterns across experimental conditions and micro word-use in-context for each outcome (illustrated with the utterance “uhum”).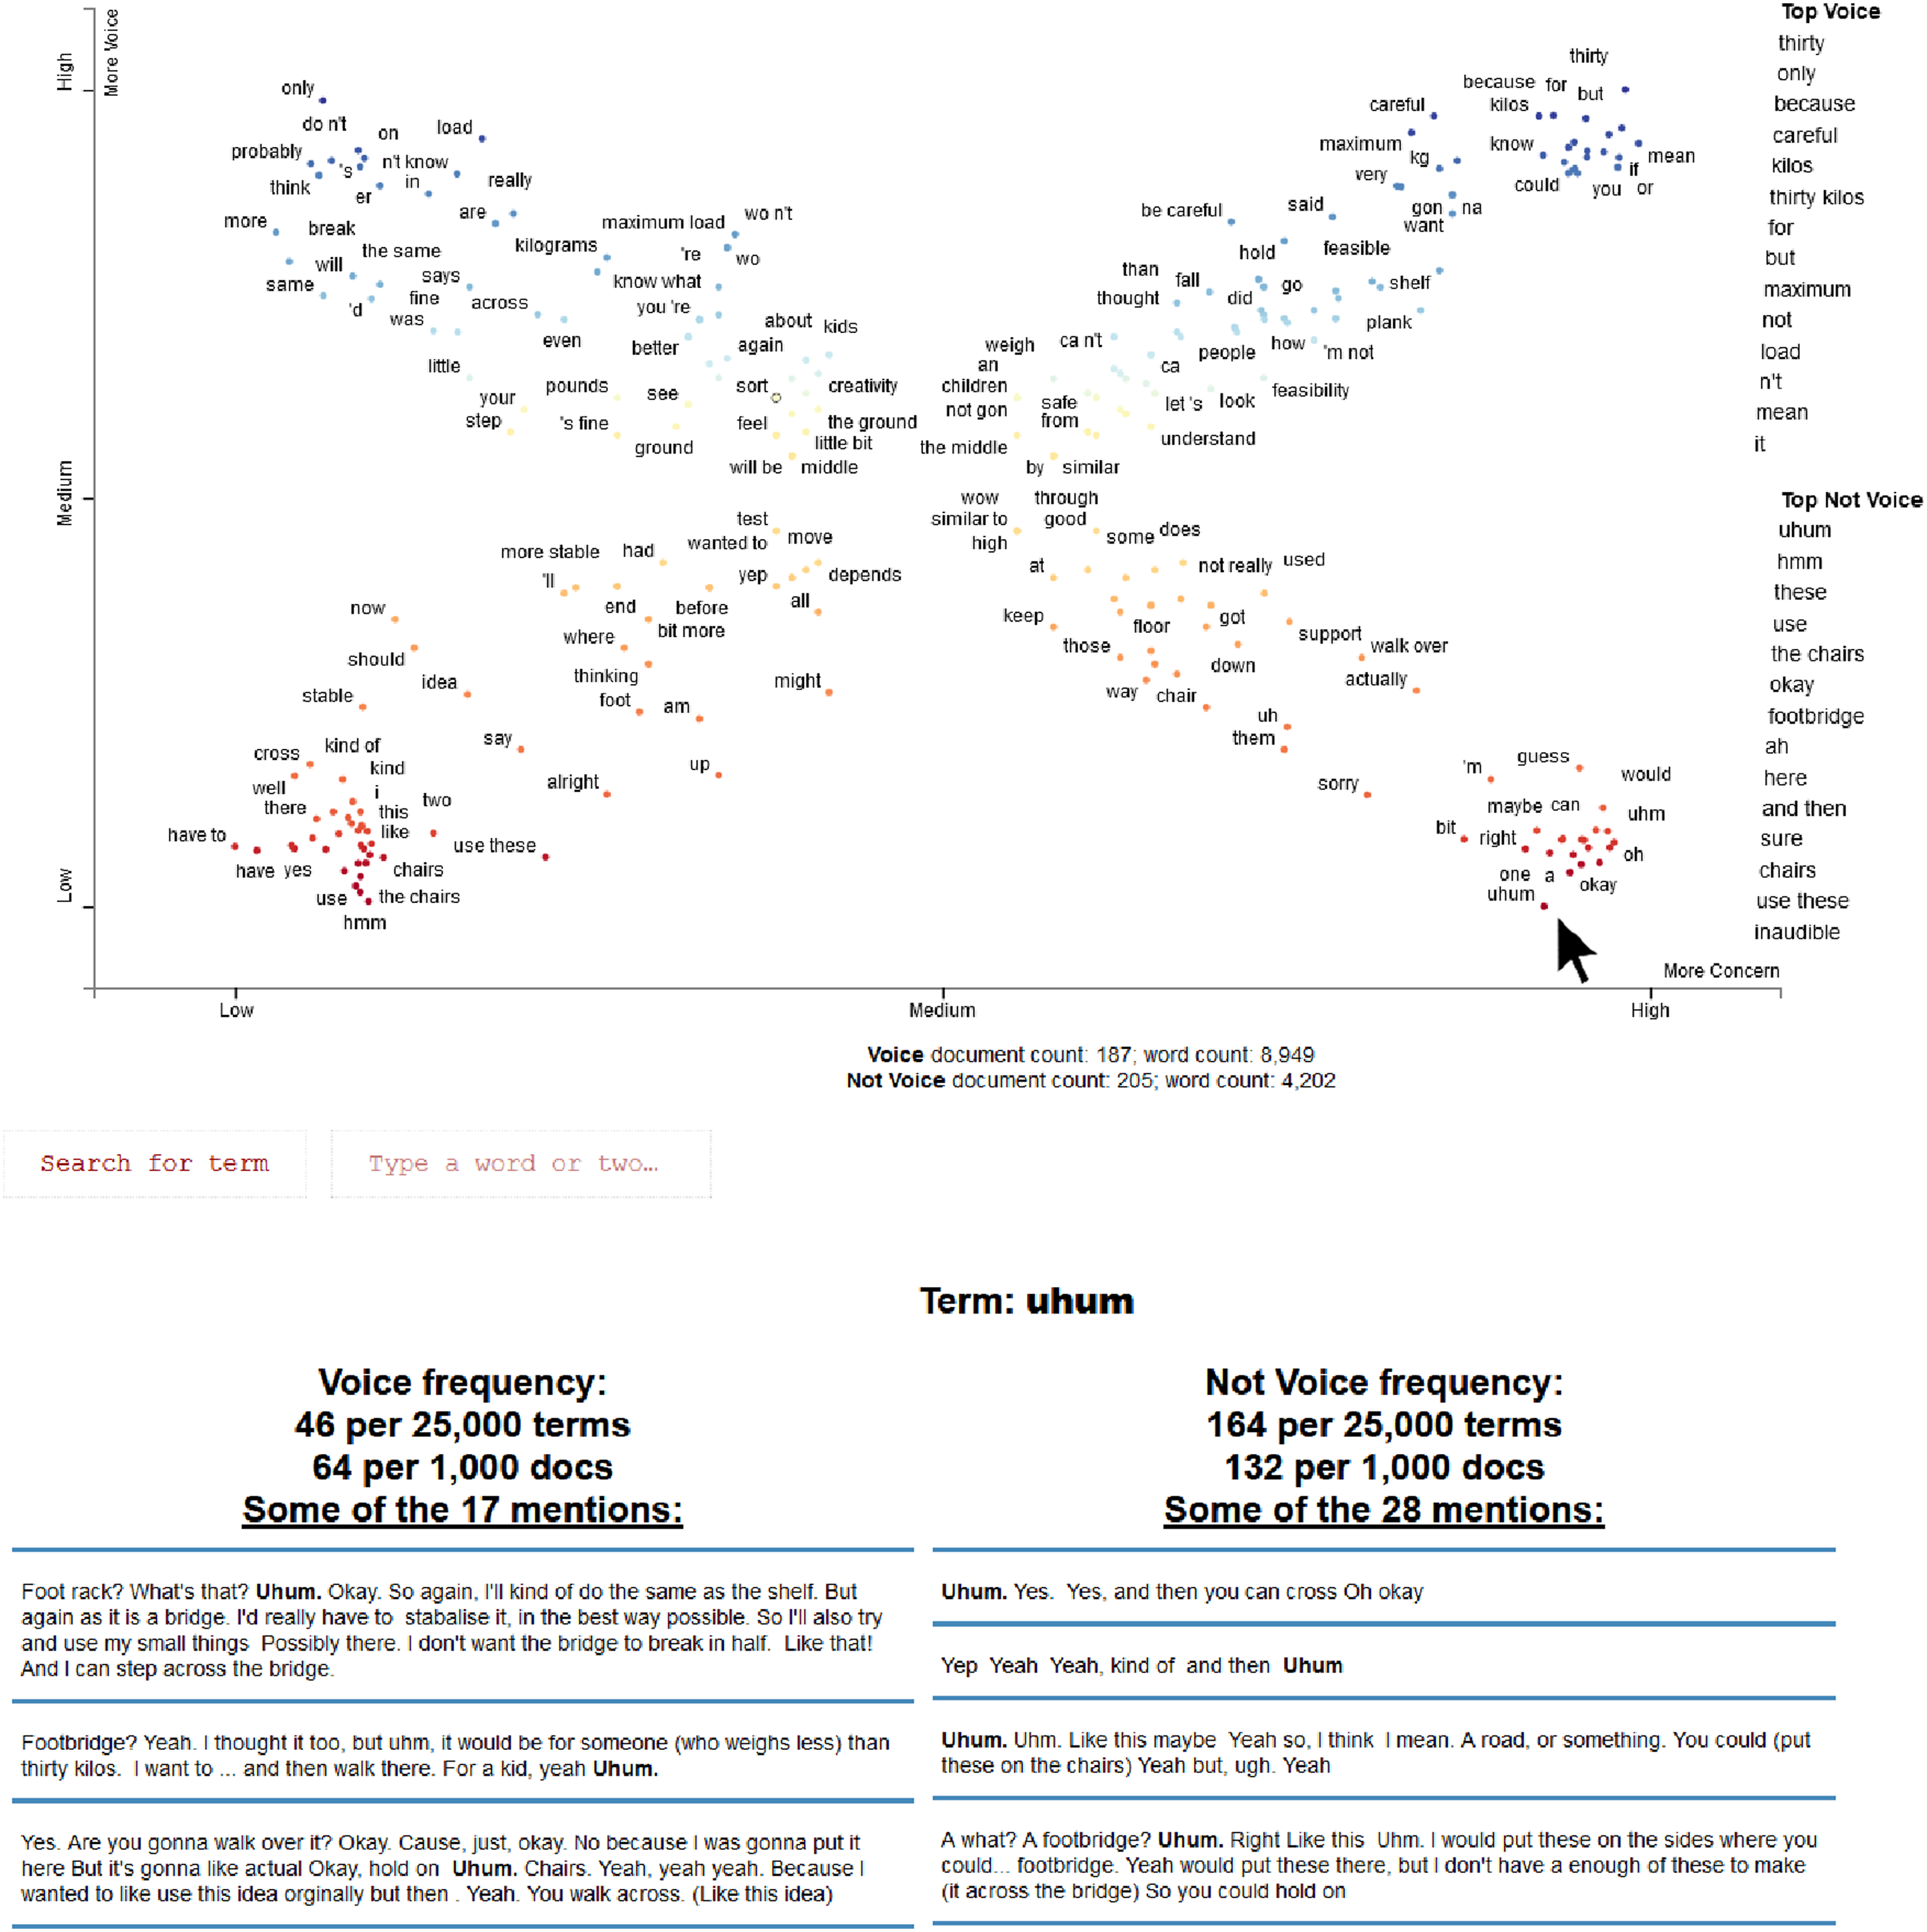
Findings
Over half of the participants who reported being concerned in the post-experimental survey did not speak up about their concerns. However, these participants were not silent; they spoke with hesitation (“oh,” “ah,” “uhum”; lower-right quadrant). In contrast, participants who were concerned and voiced (top-right quadrant) mentioned safety critical information (“thirty kg,” “kilos,” “maximum”) and were assertive (“be careful,” “but”). However, this plausible pattern was also deceptively simple. Recursively moving back-and-forth revealed that concerned-voicing participants often hesitated just prior to speaking up. Atypical speak-up utterance was: “Ah yes, I can… uhm before […] ... Or. Oh, ee, yes… And then how would you... (oof) Uhm. Like that's already a, but maybe, how can you, it's only, it can only take thirty kilos, so.” This yields the abductive insight that instead of hesitation being the inverse of speaking up it might actually be the early stage of speaking up, indicating cognitive load or communicating discomfort. This finding about “muted voice” gains legitimacy because it is doubly-constrained; evident quantitatively (with between participant measures) and qualitatively (with extracts positioned within the measures).
Discussion
The findings have added validity because the interpretation is constrained by both the qualitative and quantitative analyses, and the interactive visualization enables readers to recursively browse excerpts of participants’ talk organized in terms of the categories and measures used in the experiment. The open science movement has focused on sharing numeric data (Shrout & Rodgers, 2018), but, it is increasingly possible to share the raw data which underpin the numbers (e.g., observations and transcripts from an experiment; Glăveanu & Gillespie, 2021). Being open about the underlying raw data can enhance validity by re-connecting qualitative particulars with quantitative patterns, and enabling each to reinforce and challenge the other.
Data Requirements
The guiding principle of a multi-resolution design is that all quantitizing and qualitizing is reversible; the raw data should always be retrievable and analyzable. This principle, however, imposes two data requirements.
Types of data and Suitability for Multi-resolution Designs.
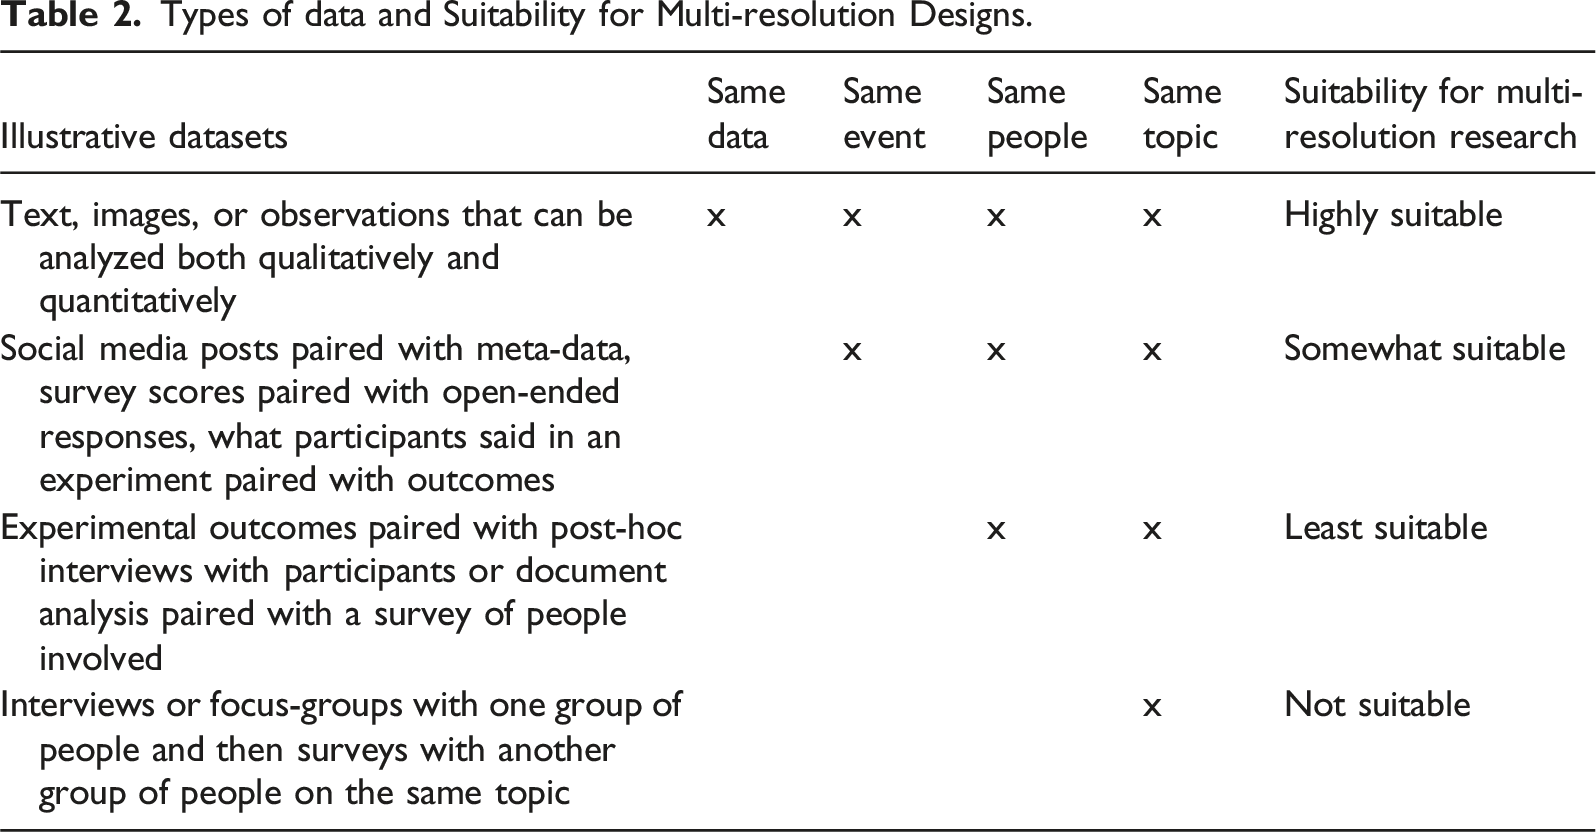
Second, to enable the double-constraint of multi-resolution research, the data should meet the quality criteria for both qualitative and quantitative research (Buckley, 2018). For the qualitative analysis, the data should comprise contextualized raw data (e.g., quotes, videos) that are credible, dependable, and afford thick description. For the quantitative analysis, the data should be sufficiently sampled and standardized to enable robust measurement. The sample size should be sufficiently powered from the focal analysis. Big qualitative data often easily meets the sample size requirements (sometimes the sample is the population), but, it can have problems with missing data and data quality. Examples of big qualitative data include: videos (e.g., YouTube, CCTV footage, on-the-scene reporting), social media posts (e.g., Reddit, X), online reviews (e.g., Fishbowl, Glassdoor, Trustpilot), and documents (e.g., diaries, formal complaints, parliamentary debates, political speeches, earnings call transcripts, company reports). Alternatively, one can create suitable data using traditional methods. Qualitative data collection methods (e.g., interviews, focus groups, observations, video recordings) produce data that can be quantified (Fakis et al., 2014; Vogl, 2019)—provided it is of sufficient volume. Equally, one can add qualitative data to quantitative processes for data collection (e.g., talk-aloud during survey completion, open-ended survey questions, video recording experiments, post-experiment interviews) to create tightly paired data (Moore & Gillespie, 2014; Niculae et al., 2015).
Discussion
Traditionally qualitative data was analyzed qualitatively, and quantitative data was analyzed quantitatively. But, this overly neat compartmentalization is breaking down. Big qualitative datasets, when combined with new computational techniques, offer a choice of qualitative, quantitative or mixed analysis. We argue that it is only by recursively transforming the raw data into multiple formats that the full depth and breadth of the data can be leveraged.
Expectations for research transparency are increasing. The cost of recording, transcribing, and storing large volumes of qualitative data are reducing. Advances in computing enable analyzing, visualizing, and disseminating qualitative and quantitative data side-by-side. The open science movement has created platforms to share both numeric and qualitative data. Thus, the choice between depth (qualitive) or breadth (quantitative) is anachronistic; we should expect research to be transparent in both depth and breadth.
Seizing this opportunity, there is a growing literature on how to analyze qualitative data using both human interpretation and computational processes (Andreotta et al., 2019; Buckley, 2018; Chang et al., 2021; Shahin, 2016). However, this literature has focused on procedural quantitative-to-qualitative sequences, with limited theorizing of the potential for synergies or recursive designs. Our contribution has been to utilize mixed methods designs to theorize multi-resolution design as recursive transformation; zooming in with qualitative analysis and zooming out with quantitative analysis. This makes contributions to the literatures on mixed, qualitative, and quantitative research.
Contributions to Mixed Methods Research
The challenge of big qualitative data requires a mixed methods approach. Computational analyses of qualitative data cannot supplant manual validation, interpretation, and abductive leaps of theory-building (Bazeley, 2017; Bennett, 2015). Algorithms can reliably identify objects, actors, actions, and quotations, score sentiment and more subtle phenomena, and inductively cluster themes. However, human interpretation is required to frame questions, identify features, ensure validity, interpret findings, and understand limitations. In short, the time is ripe to combine computation and interpretation within a mixed methods framework (Bazeley, 2017; Ho et al., 2021).
Multi-resolution designs replace the idea of qualitative and quantitative methods being conducted side by side (e.g., the metaphor of triangulation; Fetters & Molina-Azorin, 2017a) with a new metaphor of zooming-in and zooming-out on the same qualitative data. This conceptual shift is possible because raw data is conceptualized as transformable into excerpts, categories, and measures. Each data type has gains and losses, but, by moving between them, it is possible to accrue gains, ameliorate losses, and harness synergies.
Typically mixed methods research is conducted on separate datasets, with only loose integration at the interpretation phase (Åkerblad et al., 2021). Integrating findings across datasets is challenging (Fetters & Molina-Azorin, 2017b). Potentially important tensions can be byproducts of the different methods of data collection (i.e., different procedures, participants, social contexts, temporal timepoints). Multi-resolution research removes these uncertainties: any emerging tensions are in the data. Tensions between qualitative and quantitative analyses become more productive and any interpretation is doubly constrained, having to account for both the zoomed-in and zoomed-out analyses.
The two studies presented show how novel visualization technologies can be used to enhance mixed analyses of the same datasets. Joint displays are a powerful means to create tight integration, with qualitative and quantitative data presented side-by-side (Guetterman et al., 2015; McCrudden et al., 2021). A multi-resolution design does not require joint displays, but, such displays vividly operationalize the metaphor of zooming-in and out of the data. Our two interactive visualizations enable readers to zoom-in and out of our data; making both the quantitative and qualitative data simultaneously browsable, and providing added rigor and transparency to the analyses.
Across these contributions, multi-resolution designs can deepen the integration between qualitative and quantitative approaches thus enabling mixed-methods synergies (Fetters & Freshwater, 2015). In the illustrations above, neither the abductive insight (about retirement having different meanings before, during, and after) nor the validity challenge (about the voice-silence binary being over-simplistic) would have been possible with only quantitative or qualitative analysis.
One limitation is that, although multi-resolution designs allow for the tightest possible integration between qualitative and quantitative analyses, the fact that only one dataset is used, precludes synergies arising from multiple datasets. For, example different datasets might reveal very different aspects of the target phenomenon, thus creating bigger and more challenging tensions. Accordingly, it is still necessary to conceptualize potential integrations on many dimensions (Fetters & Molina-Azorin, 2017b).
Augmenting Quantitative Research
Multi-resolution research can contribute to the validity of quantitative research, which, at present, is struggling with the replication crisis (Shrout & Rodgers, 2018). This is the problem of experimental research, especially in psychology, failing to replicate (Open Science Collaboration, 2015). Broadly it is agreed that experimental research has had too many degrees of freedom (Wicherts et al., 2016). To date the focus has been on reducing the degrees of freedom by preregistering research and making data open access (Shrout & Rodgers, 2018). We suggest that these degrees of freedom can be further constrained by incorporating the qualitative data that underpins quantitative data.
All quantitative research entails quantifying qualities, and the associated risk that quantities do not reflect the underlying qualities. Accordingly, best practice is for researchers to return to the qualitative data to check the validity of their measures (Berka, 1983; Zeller et al., 1980). Multi-resolution research takes this idea further, arguing that it is increasingly possible for quantitized data to be revertible to its qualitative form throughout the analysis. Technological advances in algorithms and visualizations means that statistical analyses, even with large volumes of data, can be frictionlessly reverted to qualitative data. Recursively returning to the underlying qualitative data during the analysis, and making this underlying data available for secondary research, would increase the validity and transparency of experimental research.
As the costs of recording, storing, and analyzing data reduce, it could become routine to have richer raw data that is closer to the events being studied. Surveys could include open ended questions, talk-along interviews (Moore & Gillespie, 2014), and talk-aloud protocols (French et al., 2007; Wagoner & Valsiner, 2005). Experiments could include recordings or transcripts of what actually happened in the experiment (e.g., participants interacting; Psaltis & Duveen, 2007). Broadening the raw data would enabling in-depth analysis of surprising findings and support secondary analyses (Glăveanu & Gillespie, 2021).
One limitation is that a multi-resolution design should not be used simultaneously with confirmatory hypothesis testing. Multi-resolution research is exploratory, focused upon generating theory, finding explanations, and ensuring validity. Exploratory research is a necessary, but often neglected part of social science, that is fundamentally different from confirmatory research (Stebbins, 2001; Tukey, 1980). Confirmatory research entails stating a hypothesis before the data analysis; while exploratory research entails creating hypotheses through the analysis. Multi-resolution research should be conducted before confirmatory hypothesis testing on a training dataset (entirely separate from the test dataset to avoid overfitting) or after confirmatory hypothesis testing on the test data as a post-hoc validity check or post-hoc generation of possible explanations for the findings.
Augmenting Qualitative Research
A multi-resolution design can make qualitative research more rigorous, efficient, and transparent. Qualitative research has been criticized for being based on small samples (Chang et al., 2021), “cherry picked” excerpts (Morse, 2010), and lack of clarity about how selected excerpts relate to the population. Addressing these concerns by obtaining larger samples has been challenging because manual analysis is labor intensive.
Computational analysis can contribute to these challenges by augmenting qualitative analysis (Leeson et al., 2019). First, automated techniques are efficient and viable for simple thematic analysis (Chang et al., 2021; Ho et al., 2021; Kermani et al., 2024). Second, text data can be searched for linguistic features, specific themes or subtle patterns. These search algorithms can use distributed language models that score semantic and even conceptual similarity (Neuman, 2016). These two advances, in topic modeling and semantic search, create the potential for AI augmented qualitative research.
Augmenting qualitative research, by automating basic analyses, would enable more ambitious research and provide a rationale for choosing excerpts to analyze in detail. Such automation would “free-up” human interpretation so that it can be directed to where it adds most value, namely, in making subtle and contextual judgments. The algorithms would be akin to diligent research assistants, working tirelessly in the background, processing huge volumes of data, to provide accessible intermediary overviews that guide more in-depth qualitative analysis (Janasik et al., 2009; Wiedemann, 2013). These computational assistants could implement hunches, search for patterns, and create visualizations that enable and empower human interpretation. This guided human interpretation would, in turn, generate further insights and suggestions that would give direction to the computational assistants.
Reconnecting the Micro and the Macro
The social world is not stratified into different ontological levels (e.g., with sounds, utterances, and language being incommensurable). Rather, the social world is holistic, and any apparent levels are a byproduct of our conceptualization, data, and analysis. By analyzing the same data both qualitatively and quantitatively, and by zooming-in and zooming-out, we can study the social world as both a macro and micro phenomenon simultaneously (e.g., to analyze words within discourses and discourses as comprised of words).
Multi-resolution designs conceptualize the micro and macro as not merely “connected” but as the same phenomenon viewed at different resolutions. This deeper insight is obscured if raw data is thinly sliced into only excerpts, categories, or measures; potentially creating problems for conceptualizing how micro and macro phenomenon are related (Cornish, 2004). Using qualitative methods and small samples to study phenomena up-close and using quantitative methods with entirely different but larger samples to study the same phenomenon as a statistical abstraction has sliced phenomena in unnatural ways, creating a disconnect between concrete particulars and statistical patterns. In contrast, multi-resolution designs aim to preserve the ontological links between the micro and the macro through analyzing datasets that afford both zooming-in and zooming-out, thus revealing the micro in the macro and the macro in the micro.
Footnotes
Acknowledgments
We would like to thank Alex Goddard for helpful comments.
Author Contributions
AG, CdSL and VG developed the initial idea of multi-resolution design. AG wrote the first draft of the manuscript and CdSL, VG, TZ, and MB contributed additions and comments.
Declaration of conflicting interests
The author(s) declared no potential conflicts of interest with respect to the research, authorship, and/or publication of this article.
Funding
Swiss National Centre of Competence in Research LIVES.