
Abstract
Crossover analyses are ways of mixing data across study strands from differing traditions, for example, transforming and analyzing qualitative strand data quantitatively together with the quantitative strand data. In response to a recent call for innovation with crossover analyses in mixed methods, this article contributes to the field of mixed methods research by presenting a method of crossover analysis in convergent mixed methods designs. Using survey data, contingency tables were used to merge dichotomized quantitative and qualitative strand results for mixed analysis and joint interpretation using Chi-square and odd ratio analyses. Ratings and open-ended comments about different aspects of the same phenomenon were integrated and explicitly linked with the rationale as means to achieve complementarity in the meta-inference.
Keywords
Introduction
Statement of the Problem
In mixed methods research, crossover analyses are ways of mixing data across study strands from differing traditions, for example, transforming and analyzing qualitative strand data quantitatively together with the quantitative strand data or vice versa (Hitchcock & Onwuegbuzie, 2020; Onwuegbuzie & Combs, 2010; Onwuegbuzie & Hitchcock, 2015; Onwuegbuzie et al., 2011). As the popularity of mixed methods research grows, it is important for these types of supporting methods of mixed analysis to keep pace. Hitchcock and Onwuegbuzie (2020) made such a call for innovation with crossover analyses in mixed methods.
This manuscript aims to respond to the call to innovate more crossover analysis approaches (Hitchcock & Onwuegbuzie, 2020) by providing an example application of contingency tables to crossover analysis. Using a reanalysis of a randomized controlled trial evaluation (Waxman et al., 2018; Wright et al., 2021), hereon referred to as the source study, contingency tables were used during data integration as means of explicitly linking the mixed analysis with the rationale for mixing methods to achieve complementarity in the meta-inference. Our application of the contingency table-based method of crossover analysis, in addition to alternative applications, is presented within the Crossover Analysis Framework (CAF) presented by Hitchcock and Onwuegbuzie (2020).
A review of mixed methods research in K-12 education returns few methodologically focused studies in evaluation research focused on integrating quantitative and qualitative stakeholder data for the purpose of assessing implementation fidelity and outcomes. Similarly, in the specific STEM context of the source study (Wright et al., 2021), the researchers did not examine integrated connections between how STEM teachers perceived their day-to-day instructional practices and their perceptions of what best practice is nor their perceptions of barriers that limit their ability to teach effectively. Though higher education STEM instructors’ beliefs about the importance of evidence-based instructional objectives and practices, such as using engineering design methods or real-world contexts, as well as barriers to instruction have been shown to significantly predict the extent to which these practices are enacted (Bathgate et al., 2019), the extant literature illustrates little about the connections between K-12 STEM teachers’ perceptions of effective practices influence their instruction.
Recent K-12 STEM education studies have contributed knowledge to this need area through examinations of both teachers’ perceptions of their practice and barriers that impede their work (Hammack & Ivey, 2019; Margot & Kettler, 2019; Wright et al., 2021). However, none of these studies integrated quantitative and qualitative data to examine patterns about the likelihood that perceptions of barriers or effective teaching practices could vary between teachers with differing perceptions of their own practice. A crossover analysis approach to integrating quantitative ratings and qualitative text methodologically fills this gap. The present study also seeks to contribute to the diversity of mixed methods analyses available to inform the design of studies where integrated findings are anticipated.
The Context
Field Specific Context
Common practice in evaluation research includes surveying stakeholders about the feasibility and fidelity of implementing program strategies and activities. Surveys can typically involve large scale sampling, quantitative Likert-like ratings of program elements, and follow-up qualitative open-ended responses about implementation barriers and/or successes. In these instances, ratings and comments about program implementation are linked perceptual data representing different aspects about the same phenomenon. Learning from these data points can be enhanced by explicit integration. In addition, survey question design can be informed by evaluator a priori understanding of the explicit perceptual connection between numerical ratings of, and open-ended comments about, different aspects of program implementation. The a priori connection is made explicit through upfront understanding for how quantitative and qualitative data will integrate during the mixed analysis.
The mixed methods analysis used quantitative and qualitative data from a teacher survey administered as part of a program evaluation (Waxman et al., 2018; Wright et al., 2021). The survey collected quantitative Likert-type ratings for STEM instructional preparedness, emphasis on STEM-based instructional objectives, and use of specific STEM-based instructional practices. Additional open-ended qualitative questions explored stakeholders’ perceptions of potential barriers to effective STEM instruction and perceptions of the most effective approaches for delivering STEM instruction. Through reanalysis of these data with a mixed methods approach, we were able to form novel meta-inferences connecting observed patterns in textual data with observed patterns in the rating data that were not initially possible with the original separate quantitative and qualitative analyses. The result was a more complete understanding of stakeholder perceptions relating to program implementation.
Methodological Context
Complementarity as a Rationale for Mixing Methods in Convergent Designs
The concept of complementarity as a rationale or justification for mixing methods has been discussed recently by mixed methodologists as a need to build a more complete and more holistic picture than can be constructed with any single method by combining quantitative and qualitative methods that provide complementary information on different aspects of the same phenomenon (Creamer, 2018; Plano Clark & Ivankova, 2016). The concept for complementarity has grounding in Greene and colleague’s (1989) definition of the complementarity rationale as a need to “measure overlapping but also different facets of a phenomenon, yielding an enriched, elaborated understanding of that phenomenon” (p. 258). Here, we take a similar stance that the use of contingency tables for crossover analysis can be leveraged to directly fill a need to integrate two unique puzzle pieces of a larger picture, one piece provided from the quantitative inference, the other from the qualitative inference; such that the result is not only an expanded understanding but a gestalt insight where the meta-inference is greater than the sum of the strand inferences, for example, 1 + 1= 3 (Fetters & Freshwater, 2015; Hirose & Creswell, 2023) or 1 U 1 => 3 (Bazeley, 2024).
Creswell and Plano Clark (2026) described several scenarios where the research problems are particularly well-suited for mixed methods research; one of which was the need to obtain more complete results than can be produced from one type of evidence. The current analysis took the position that the ratings and open-ended responses alone only provided a partial view into stakeholder perceptions of program implementation. Thus, there remained a need for mixing methods to develop a more complete understanding of stakeholder perspectives of the program. A complementarity rationale justified use of mixed methods for reanalysis of the source study. Integration of quantitative Likert-type ratings and qualitative open-ended responses produced likelihoods that directly connected themed qualitative responses with relative position in the distribution of quantitative ratings. The integrated findings expanded coverage and provided a more holistic picture about teacher perceptions of program implementation than possible with the ratings and comments analyzed separately.
Concurrent quantitative and qualitative data collection that compares or merges results is aligned with the family of convergent, or parallel, mixed methods designs, often implemented based on either triangulation (i.e., corroborate whether findings converge or diverge) or complementarity (i.e., expand with different aspects of the same phenomenon) rationales (Creswell, 2021; Creswell & Plano Clark, 2026; Plano Clark & Ivankova, 2016; Tashakkori et al., 2021). Where triangulation commonly seeks to evaluate agreement between quantitative and qualitative results (see Flick, 2017 for additional triangulation goals, e.g., triangulation 3.0), complementarity seeks to generate conclusions that are more meaningful and complete about the phenomenon of interest. We conceptualized the nuanced differences between these two rationales in terms of the degree of similarity between the ideas measured with the quantitative and qualitative strands. Triangulation is generally supported by integrating quantitative and qualitative measures of the same phenomenon, thus, the intent to corroborate findings. Complementarity is generally supported by integrating quantitative and qualitative measures of overlapping but different facets of the same phenomenon, thus, the intent to generate more complete findings (Greene et al., 1989). We viewed teacher ratings of their STEM-based instructional practices and their open-ended responses regarding experiences with STEM instruction as overlapping but different aspects of the same instructional phenomenon related to program implementation. Therefore, we sought to integrate the quantitative ratings and qualitative experiences under a complementarity rationale.
The Crossover Analysis Framework
The Crossover Analysis Framework (CAF) offers a way to conceptualize crossover analyses through three high-level categories: (a) where the process fits in a hierarchy of approach, method, or technique; (b) the level of analytic complexity of the process; and (c) the overall paradigmatic emphasis (Hitchcock & Onwuegbuzie, 2020). Approaches are considered whole systems of data analysis, methods as a set of steps or procedures representing part of an approach, and techniques as a single step or procedure within a method. We feel the use of contingency tables represents a method of crossover analysis or set of procedures within an overall approach. Outlined in more detail in the Methods and Procedures section below, the method involves first transforming quantitative findings and qualitative findings into dichotomous variables (i.e., transforming the quantitative findings into categories and quantitizing the qualitative findings into frequencies of theme presence), next integrating the dichotomous quantitative and qualitative information within a 2 × 2 contingency table, then testing the two transformed strand findings for independence with Pearson Chi-Square tests, and lastly evaluating the strength of relationship between strand findings with odds ratios. While falling short of a whole system of data analysis, the set of techniques arguably represent a significant part of the overall mixed approach, thus positioned as a method of crossover analysis.
Guided by the examples provided by Hitchcock and Onwuegbuzie (2020), that is, noncomplex, intermediate complexity, and complex, we contend that the use of contingency tables as a method of crossover analysis likely fits in the intermediate level of complexity. Even though the individual quantitative and qualitative strand methods and techniques likely fit somewhere in the noncomplex to intermediate level of complexity, the method of crossover analysis has a high degree of integration between the quantitative and qualitative strand findings (conducted from within different traditions, postpositivist versus interpretivist in process, respectfully), as well as with the complementarity rationale, mixed research questions, convergent mixed design, joint display, and resulting meta-inferences. The lower level of complexity for the individual strands may serve to increase the accessibility of the method to the broader research community.
Important to highlight for the contingency table-based method of crossover analysis is the combining of strands from different traditions. Where non-crossover analysis has been defined as data collection and analysis from within a single paradigmatic tradition (Onwuegbuzie & Combs, 2010; Onwuegbuzie et al., 2007), crossover analysis has been defined and contrasted as a between paradigm analysis involving application of an analysis originating from one paradigmatic tradition to data associated with a different paradigmatic tradition (Onwuegbuzie & Combs, 2010; Onwuegbuzie et al., 2007). Key to achieving the crossover analysis was use of deductive coding during qualitative data transformation into dichotomous frequency categories, thus allowing the identified emergent qualitative themes to be reduced to a count of 0s and 1s before merging with quantitative findings in the contingency table and analyzed with traditional postpositivist techniques (Onwuegbuzie, 2024). The quantitative and qualitative strands were clearly distinguishable in terms of paradigm, processes, and products; furthermore, each strand addressed fundamentally different research questions (Hitchcock & Onwuegbuzie, 2020). Readers considering applying the proposed contingency table-based method are urged to carefully consider whether the contingency table ultimately serves valuable non-crossover mixed methods analysis versus crossover mixed methods analysis (Hitchcock & Onwuegbuzie, 2020; Onwuegbuzie & Combs, 2010; Onwuegbuzie et al., 2007).
Paradigmatic emphasis involves the priority given to various analytic decisions from one of the strand worldviews. The emphasis can be classified as quantitative-dominant, qualitative-dominant, or equal-status (Hitchcock & Onwuegbuzie, 2020; Johnson et al., 2007; Onwuegbuzie & Combs, 2010; Onwuegbuzie et al., 2007). When our team originally conceptualized the integrated analysis, we felt it fit as an equal-status crossover method due to honoring of concurrent postpositivist and interpretivist strands, integration through a lens of dialectical pluralism, and giving equal priority to both qualitative and quantitative findings in the interpretation of the crossover analysis. Although equal-status crossover analyses “optimally would involve combining the more complex types of qualitative analyses with one or more sets of the more complex inferential analyses” (Onwuegbuzie & Hitchcock, 2015, p. 285), the lower complexity strands adhered to the separate methodological processes of postpositivism and interpretivism, so we initially viewed the integrated findings as a conversation between the paradigmatic assumptions in alignment with the guiding dialectical pluralist perspective.
Upon further reflection after the fact, we recognized the quantitative dominance inherent in the postpositivist-oriented integrated analysis (Johnson et al., 2007) due to both the focus on Chi-square and odds ratio analyses and the prevalence of a priori analytical decisions. In a crossover analysis, analytical decisions can be made a priori, a posteriori, and/or iteratively. “Analytic decisions that are made a priori are more likely to occur in quantitative-dominant mixed analyses” (Onwuegbuzie & Combs, 2010, p. 28). Although many decisions were made iteratively and a posteriori when developing the method, as a type of “reconstructed logic” (Kaplan, 1998, p. 8), the method takes on more a priori analytical decisions than occurred originally in real time. Two such key a priori decisions are reflected in the specific choice of mixed research questions and intentional data reduction of both quantitative and qualitative findings for purpose of combining into 2 × 2 contingency tables. Because the contingency table-based method of crossover analysis relied on frequency-based methods of inferential analysis inherent in the use of Chi-square analysis and odds ratio analysis for meta-inferences (and underlying postpositivist assumptions), we ultimately positioned the method as a quantitatively dominant crossover analysis.
Questions and Objectives
Research Questions
The purpose of this mixed methods reanalysis was to extend understanding of teacher ratings about STEM instruction with teacher perceptions about barriers to, and effective approaches for, STEM instruction using a convergent mixed methods design. Although the source study explored individual quantitative questions with closed-ended survey items (e.g., how prepared did teachers feel to deliver STEM instruction, how much emphasis did teachers put on STEM learning objectives, how often did teachers use STEM instructional practices) and qualitative research questions with open-ended survey items (e.g., what did teachers perceive as barriers to high-quality STEM instruction, what did teachers feel was the most effective ways to teach STEM), here, we focus on the mixed research questions central to the complementarity rationale for mixing methods. Three variations of the mixed methods research question can be derived from the convergent mixed methods design with specific implementation of contingency table-based crossover analysis: an overall design-based mixed question and two sub-questions related to the Chi-square and odds ratio. Q1. MIXED (design-based): When analyzed together, to what extent did patterns in elementary STEM teacher textual data about barriers to STEM instruction expand understanding of patterns in their rating data about STEM instructional preparedness, instructional objectives, and instructional practices? Q1a. MIXED (Chi-square-based): Were teacher perceptions about barriers to STEM instruction independent of their ratings about STEM instructional preparedness, instructional objectives, and instructional practices? Q1b. MIXED (odds ratio-based): Were stakeholders more or less likely to mention a barrier in the qualitative responses when they provided a high or low ratings about STEM instructional preparedness, instructional objectives, and instructional practices? Q2. MIXED (design-based): When analyzed together, to what extent did patterns in elementary STEM teacher textual data about effective approaches for STEM instruction expand understanding of patterns in their rating data about STEM instructional preparedness, instructional objectives, and instructional practices? Q2a. MIXED (Chi-square-based): Were teacher perceptions about effective approaches for STEM instruction independent of their ratings about STEM instructional preparedness, instructional objectives, and instructional practices? Q2b. MIXED (odds ratio-based): Were stakeholders more or less likely to mention a method of instruction in the qualitative responses when they provided a high or low ratings about STEM instructional preparedness, instructional objectives, and instructional practices?
Methodological Objective
The pragmatic field-based aim was to develop a mixed methods design example to help program evaluators make prospective decisions about survey item design given explicit foreshadowing of mixed analyses. The methodological aim was to present a method of mixed methods crossover analysis in a convergent mixed methods design using dichotomized quantitative and qualitative responses, contingency table analyses, and odds ratios that address the likelihood of providing a themed response given a subscale rating in the upper or lower 50% of item rating responses. The method presentation makes contributions to the available toolbox of mixed methods crossover analyses for forming meta-inferences as well as to the design of surveys with planned mixed methods integration.
Methods and Procedures
Perspective(s) or Theoretical Framework
Critical realism is a philosophical perspective, or stance, in mixed methods used as an overarching paradigm to inform strand integration. The critical realist perspective combines an ontological position on an external reality with an epistemological position on subjectivity, that together “offers a recognition of relationships between factors that promotes the investigation of context-based causality” (Shannon-Baker, 2016, p. 329). We acknowledge the mixed methods practice of allowing for multiple paradigms and transitions between them given best fit with different phases of the mixed methods study. Although data were collected in the same phase of the study; because the quantitative data were analyzed from a postpositivist perspective, qualitative data analyzed from an interpretivist perspective, and the transformed strand findings integrated for meta-inference aimed at complementarity using a quantitatively-dominant crossover analysis from postpositivist perspective; the critical realist stance was chosen as overarching mixed methods paradigm (Creamer, 2018; Creswell & Plano Clark, 2026; Morgan, 2022; Onwuegbuzie, 2024; Shannon-Baker, 2016).
Mixed Methods Research Design
Integration was achieved in the convergent mixed methods design through the mixed research questions, shared sample, within strategy data collection, data merging, crossover analysis, meta-inference connecting quantitative and qualitative findings, and reporting where both joint displays and an integrated writing style were used. The design included two parallel strands, one quantitative gathering Likert-type ratings and one qualitative gathering opened-ended responses. The strands did not collect data on parallel concepts, although each strand measured different facets of program implementation. Data analyses for the mixed methods reanalysis included a six-stage sequence: (a) independent quantitative strand analysis, (b) quantitative strand data transformation, (c) independent qualitative strand analysis, (d) qualitative strand data transformation, (e) data integration in a series of 2 × 2 contingency tables, and (f) crossover analysis (Figure 1). Visual diagram of convergent QUAN + QUAL MMR design with data merging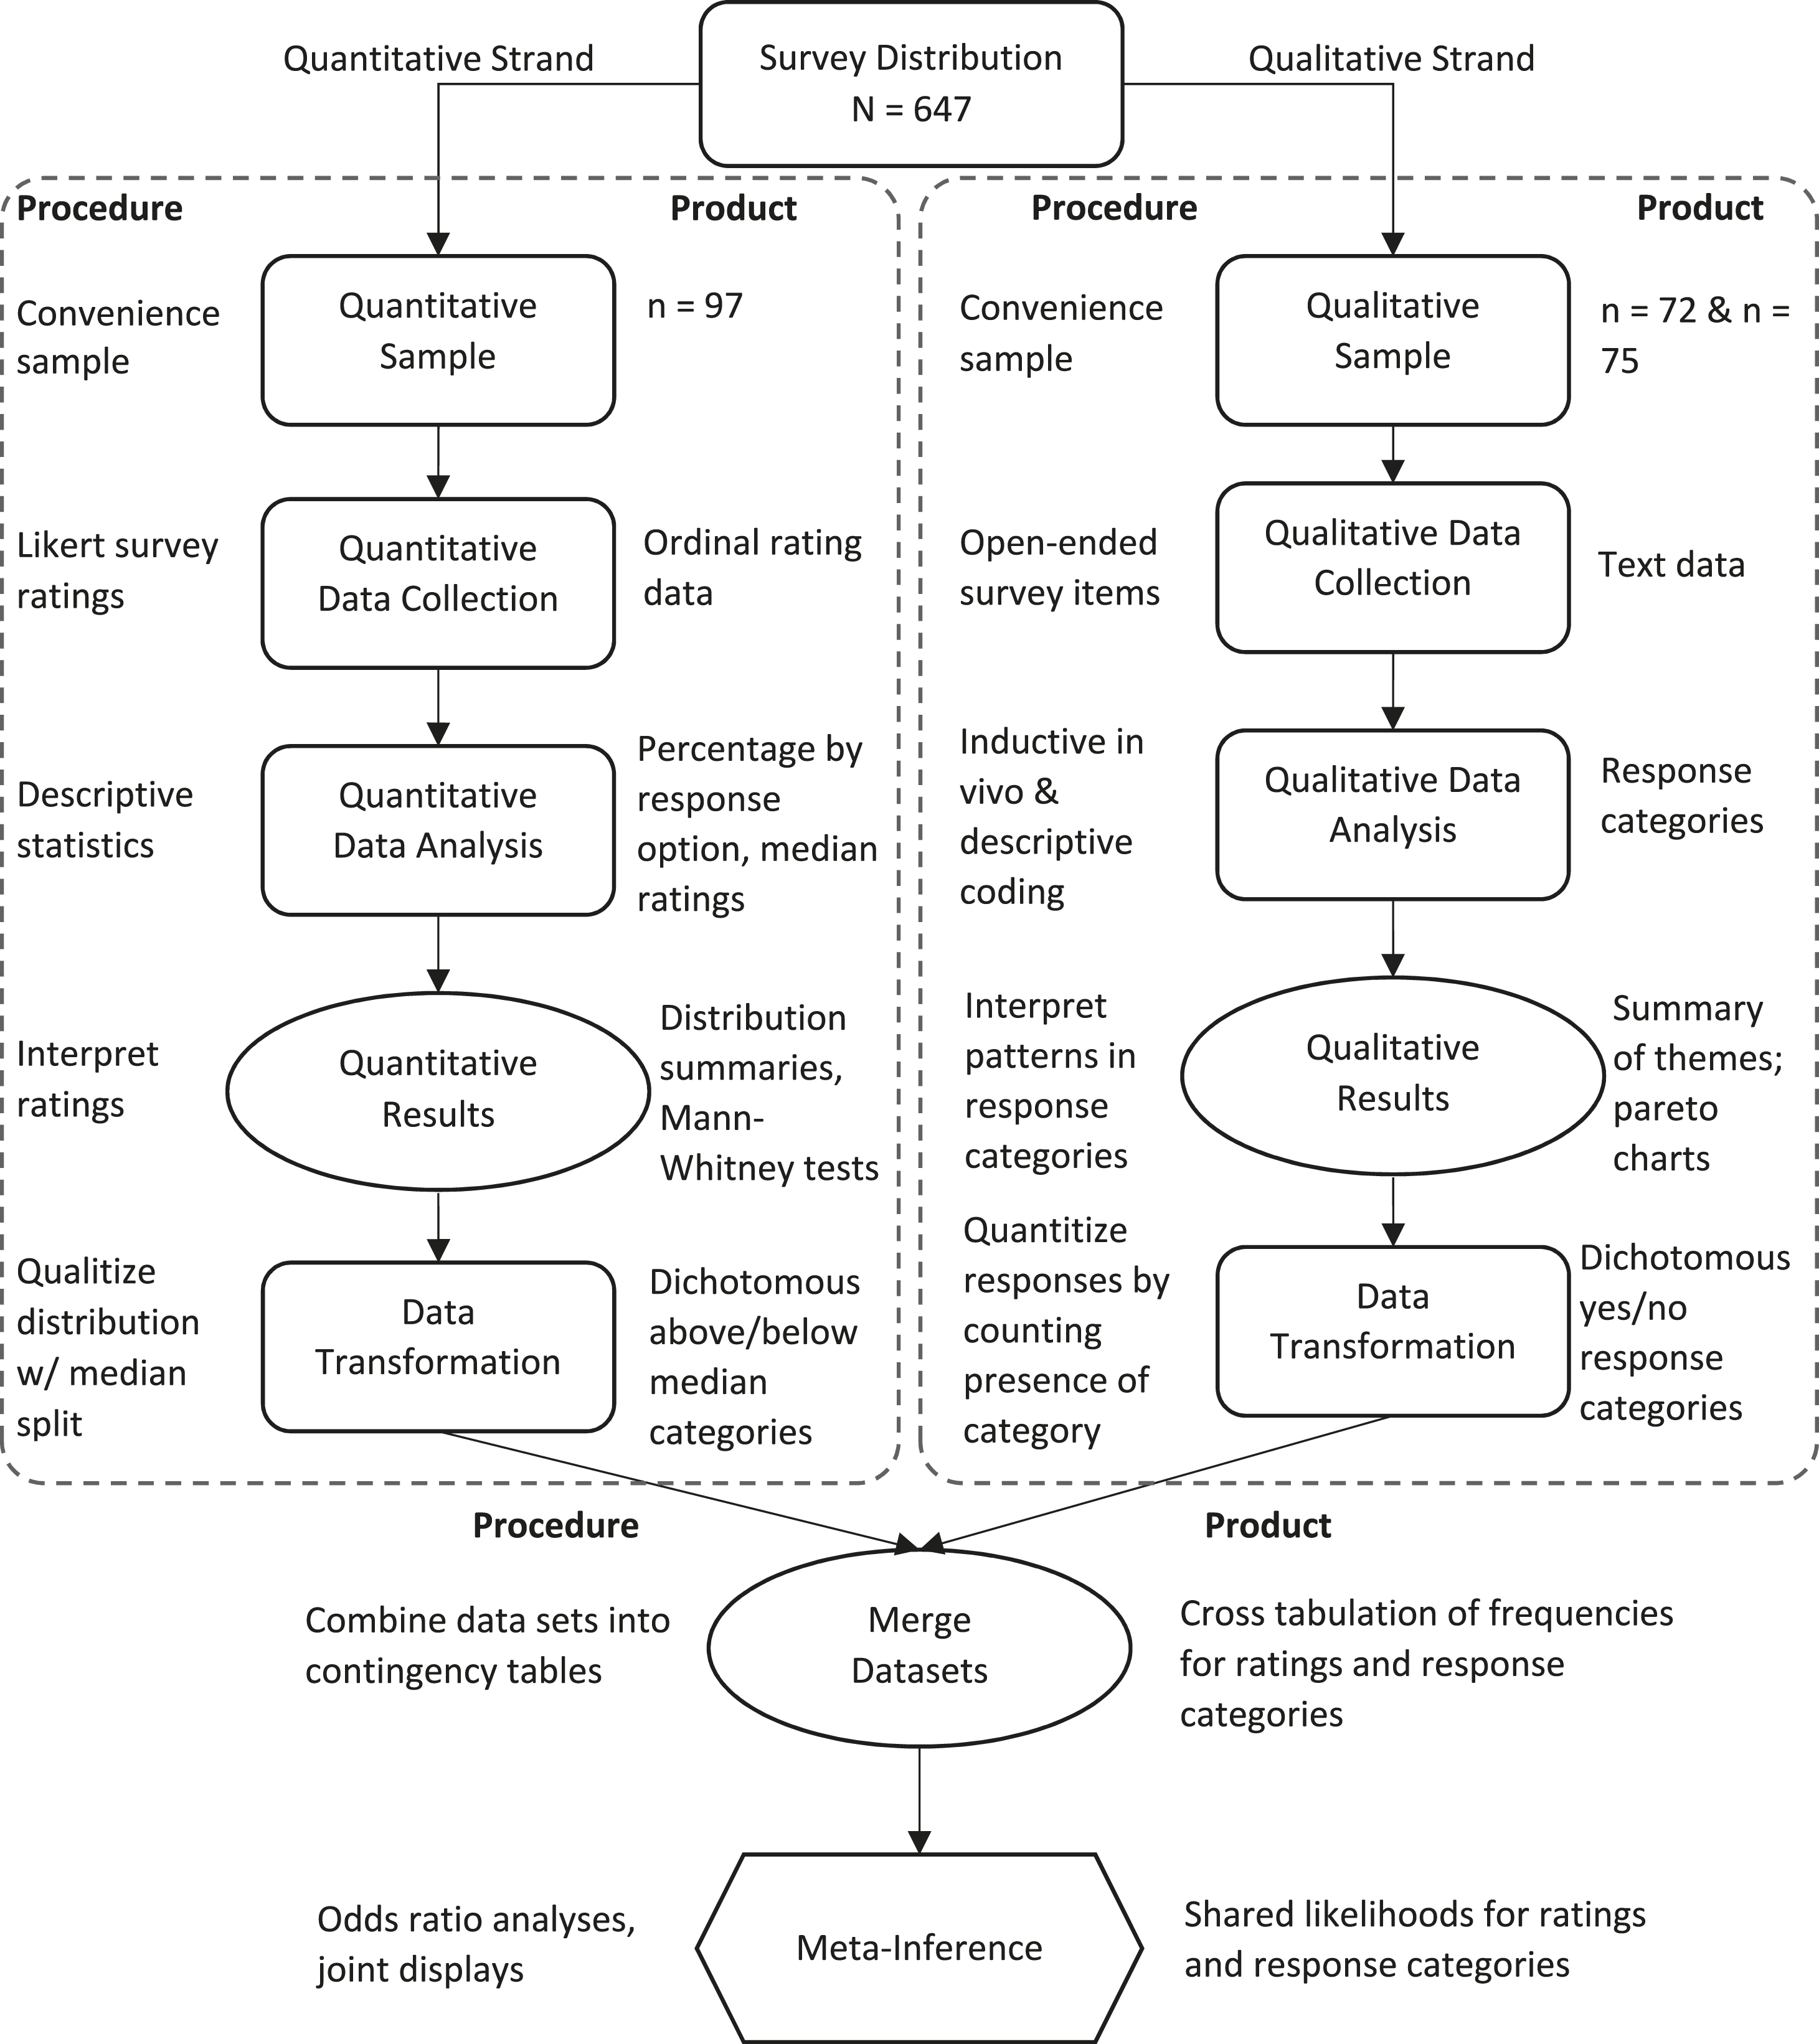
Within-Strategy Quantitative and Qualitative Sample and Data Collection
Data were collected concurrently with a targeted convenience sample using an online survey (i.e., within-strategy, intramethod mixing during data collection). Although the quantitative and qualitative strands drew from the same sample captured simultaneously using a single instrument, the qualitative strand ended up with a nested sample (n = 72) from the quantitative sample (n = 97) due to a lower response rate for the open-ended questions. We were able to link a maximum of 70 quantitative and qualitative stakeholder responses for the crossover analysis.
Quantitative strand questions consisted of three matrix items. The first matrix included the following prompt with 18 rated items: How well prepared do you feel to do each of the following in your instruction (1 = Not at all prepared, 2 = Somewhat prepared, 3 = Moderately prepared, 4 = Very well-prepared). The next matrix included the following prompt with 10 rated items: How much emphasis did you have on the following student objectives (1 = No emphasis, 2 = Minimal emphasis, 3 = Moderate emphasis, 4 = A great deal of emphasis). The final matrix included the following prompt with 21 rated items: How often do you do each of the following in your instruction in this class (1 = Never, 2 = Rarely—a few times a year, 3 = Sometimes—once a month, 4 = Often—daily or weekly)? Qualitative strand questions included two open-ended questions that allowed teachers to discuss their perceptions: What do you perceive to be the greatest barriers to high quality STEM instruction on your campus? In your opinion, what is the most effective way to teach STEM?
Quantitative Strand Data Analyses and Transformation
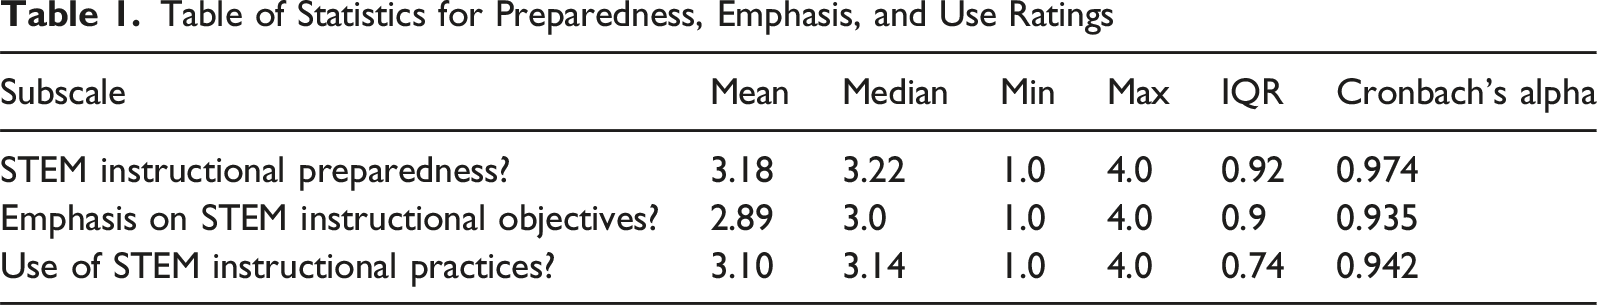
Quantitative data analysis leveraged descriptive (i.e., interquartile range, minimum, maximum, and median) and reliability (i.e., Cronbach’s Alpha) statistics. Visual analyses were supported with box and whisker charts. Although basic analyses around the median were used for the quantitative strand, the methods were intentionally selected to facilitate the data transformation in the second stage.
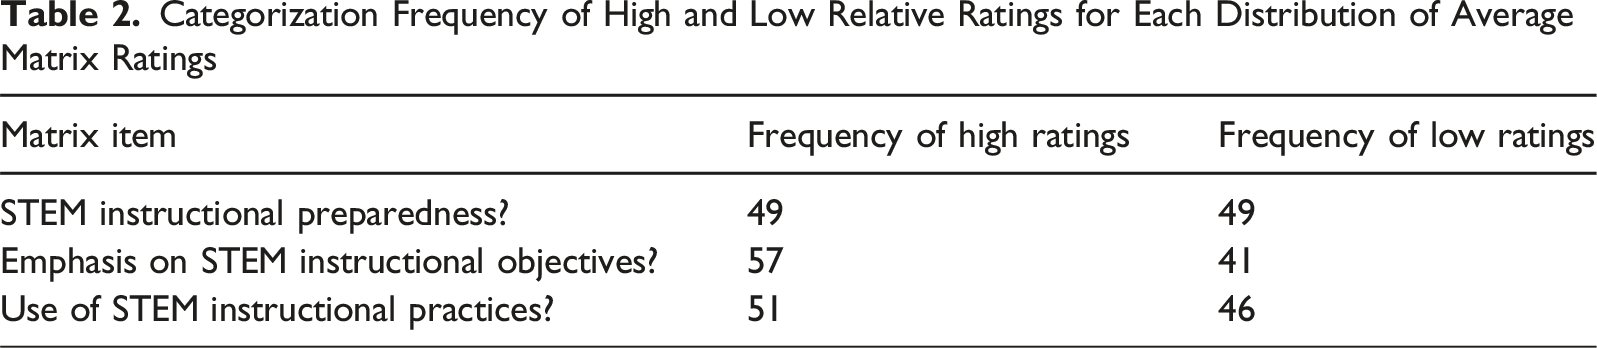
Data transformation used median split procedures for categorizing quantitative distributions into dichotomous upper and lower percentile response sets (Nzabonimpa, 2018; Onwuegbuzie & Leech, 2019, 2021; Sandelowski et al., 2009). The median split was selected to generate categories indicating a relatively high (at or above the median) or low rating (below the median). For matrix items, the mean participant rating across items in the matrix was computed and then the median split was applied to the participant’s mean matrix rating. Mean matrix ratings at or above the median were coded as 1. Mean matrix ratings below the median were coded as 2.
Qualitative Strand Data Analyses and Transformation
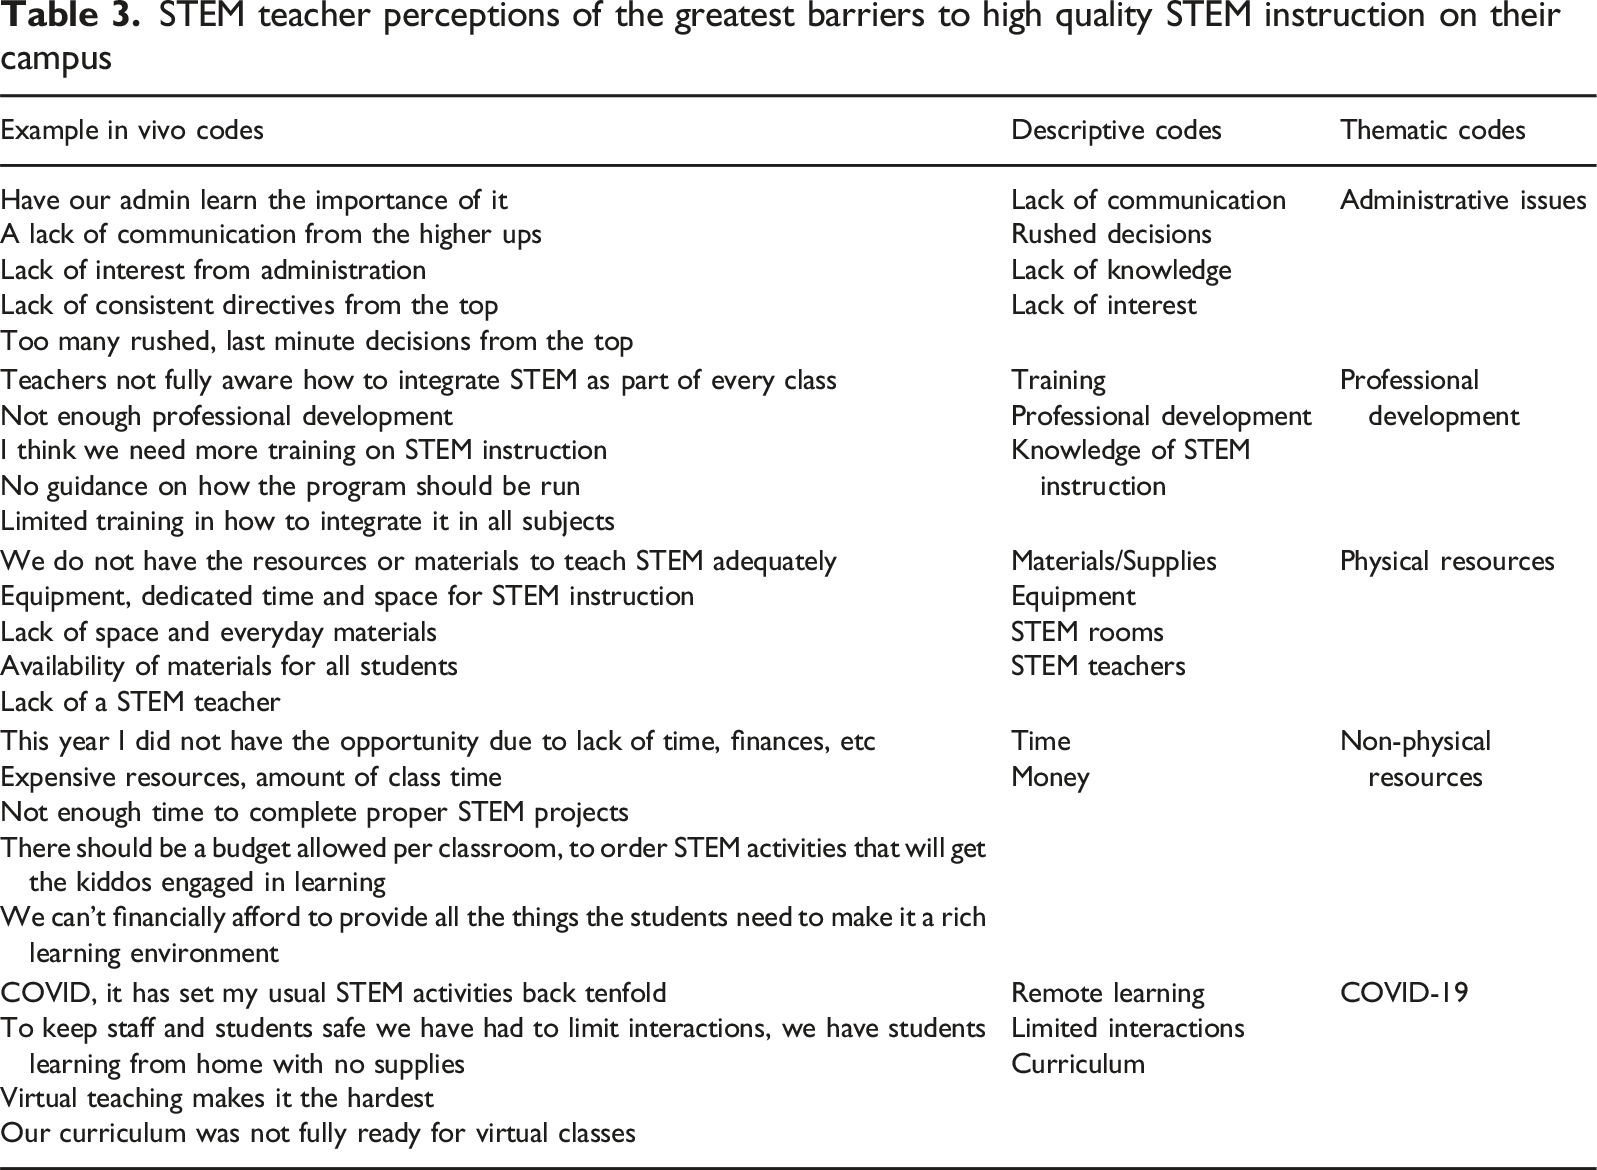
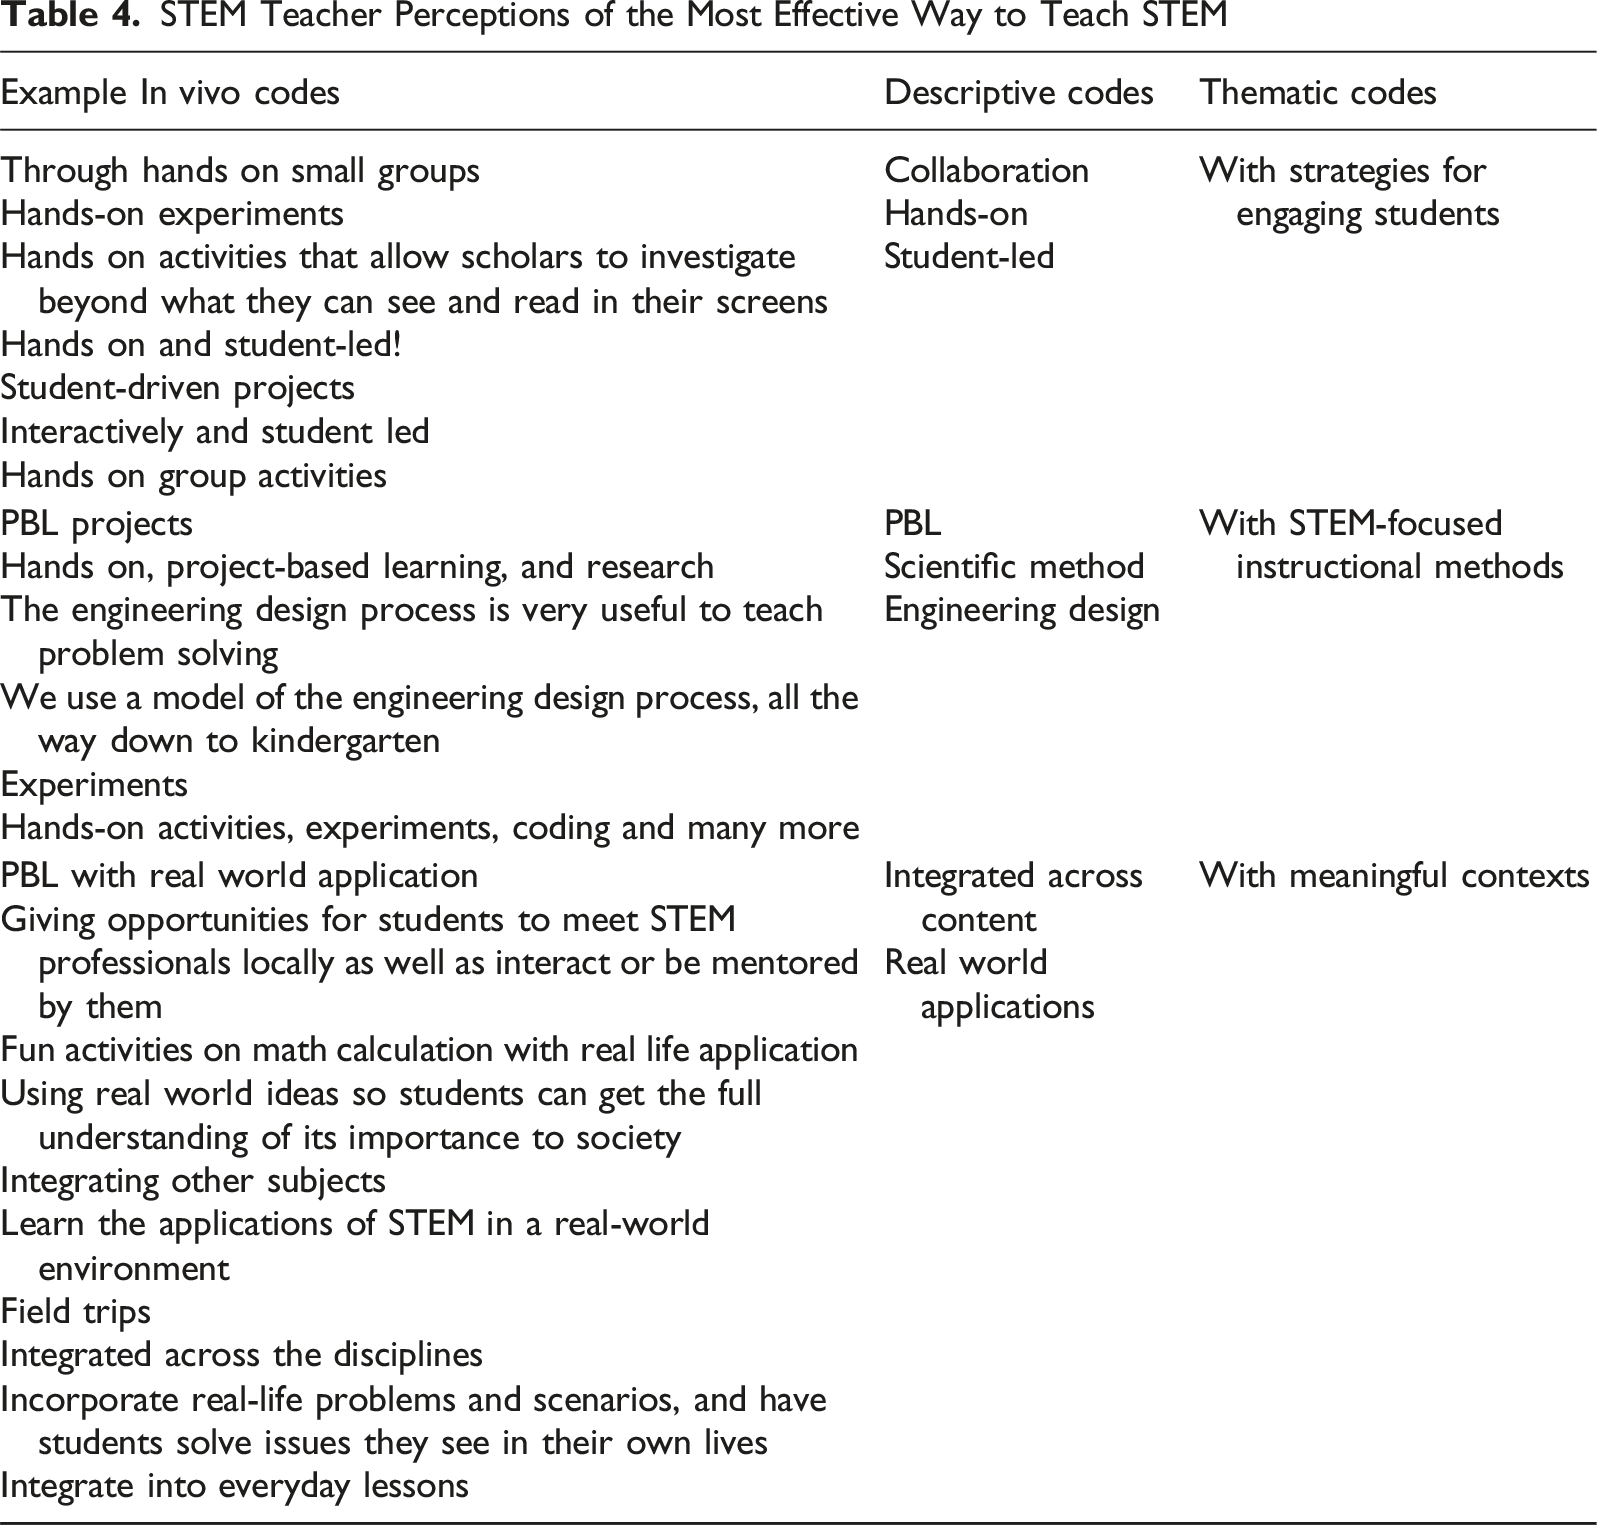
Qualitative data analysis and transformation leveraged an inductive-deductive logic to first inductively generate themes and then to use the themes to code open-ended responses for the presence of each theme. First, qualitative open-ended responses were analyzed jointly by two researchers through a process of inductive qualitative data analysis. The two evaluators independently reviewed the data and then discussed categories. Differences were resolved by consensus. The analysis began with an initial process of in vivo coding to capture the core expressions from each open-ended response. Next, descriptive coding was used to group in vivo codes by semantic similarity. Descriptive codes were then grouped into higher order themes. The emergent descriptive codes and themes were iteratively checked for fit with raw responses. Coding adjustments were made as needed. The process repeated until the descriptive and thematic coding stopped changing when applied back to the raw data. To support visual analysis of the qualitative data, hierarchy tree diagrams were generated to represent connections between thematic, descriptive, and in vivo codes for barriers and teaching methods.
Next, data transformation used procedures for quantitizing the qualitative responses by deductively coding for the presence of each theme, resulting in dichotomized textual response sets (Cox et al., 2021; Nzabonimpa, 2018; Sandelowski et al., 2009). Using the thematic categories generated from the inductive analyses, open-ended responses were deductively coded as 1 for mentioned the theme or 2 for did not mention the theme. Two evaluators independently coded the data. Rater reliability was assessed using Cohen’s Kappa. Results were reviewed and discrepancies were resolved through consensus. The coded qualitative data were then used to generate frequencies of the presence of each theme in participant responses, representing a form of descriptive-based quantitizing, which is considered a level 1 analysis in the DIME-Model of quantitizing (Onwuegbuzie, 2024).
Integrated Mixed Analysis
The transformed quantitative strand results (i.e., dichotomous high or low rating by subscale) and the transformed qualitative strand results (i.e., quantitized, dichotomous frequency of mentioned or did not mention theme in open-ended response) were merged using a series of 2 × 2 contingency tables. The integrated analysis of quantitative and qualitative components represents a type of inferential-based quantitizing and level 2 analysis due to the single independent and dependent variables (quantitative and qualitative strands, respectively) in the contingency table analyses (Onwuegbuzie, 2024). The integration involved “correlating quantitized themes with characteristics of study participants who generated those themes” (Onwuegbuzie, 2024, p. 106) for the purpose of developing insights extending beyond those of the descriptive-based quantitizing alone.
Chi-square analyses were used to test for relationship between strands. Odds ratios were used to compare the odds of mentioning a theme among raters that provided a high item rating to the odds of mentioning a theme among raters that provided a low item rating (Figure 2). An odds ratio greater than 1.0 indicated that the odds of mentioning the category were greater among teachers that provided a high rating than the odds of mentioning the category among teachers that provided a low rating. An odds ratio less than 1.0 indicated that the odds of mentioning the category were less among teachers that provided a high rating than the odds of mentioning the category among teachers that provided a low rating. Odds ratios from across contingency tables were integrated into color-coded joint displays for visual analysis of relationships. Example contingency table, odds for mentioning given high and low ratings, and odds ratio for mentioning between high and low ratings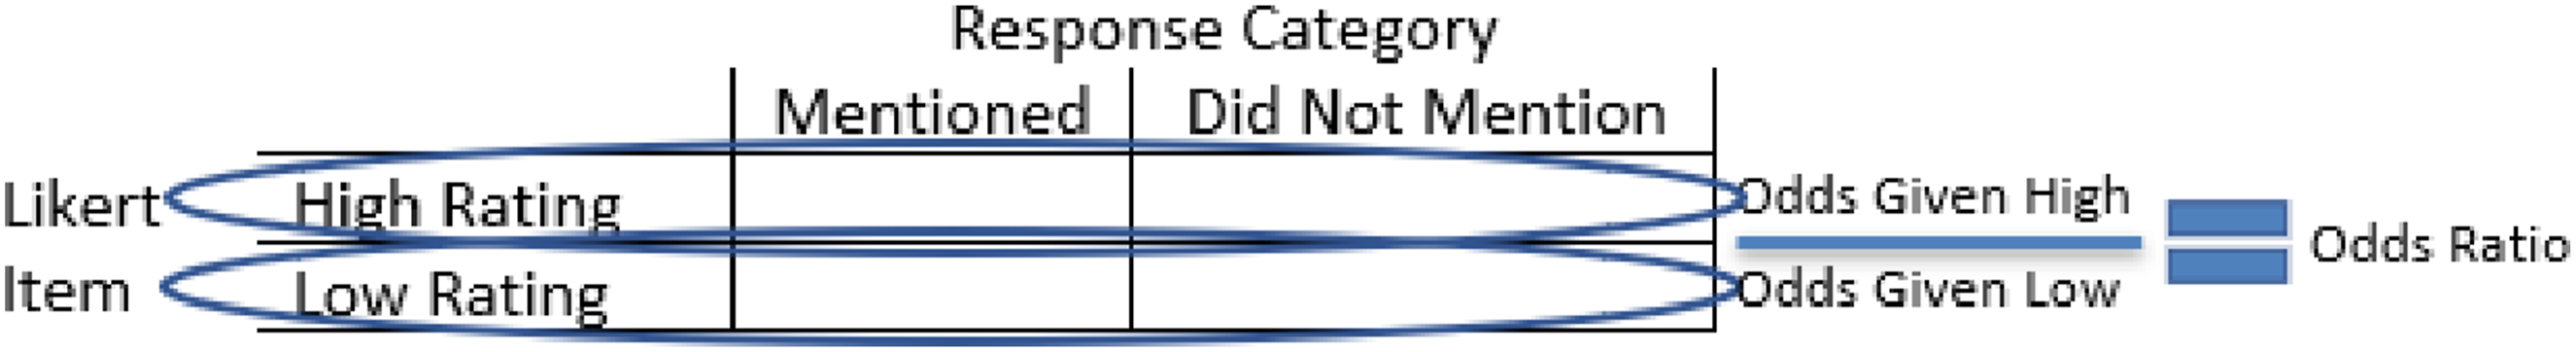
Results
Quantitative Strand Results
Table of Statistics for Preparedness, Emphasis, and Use Ratings
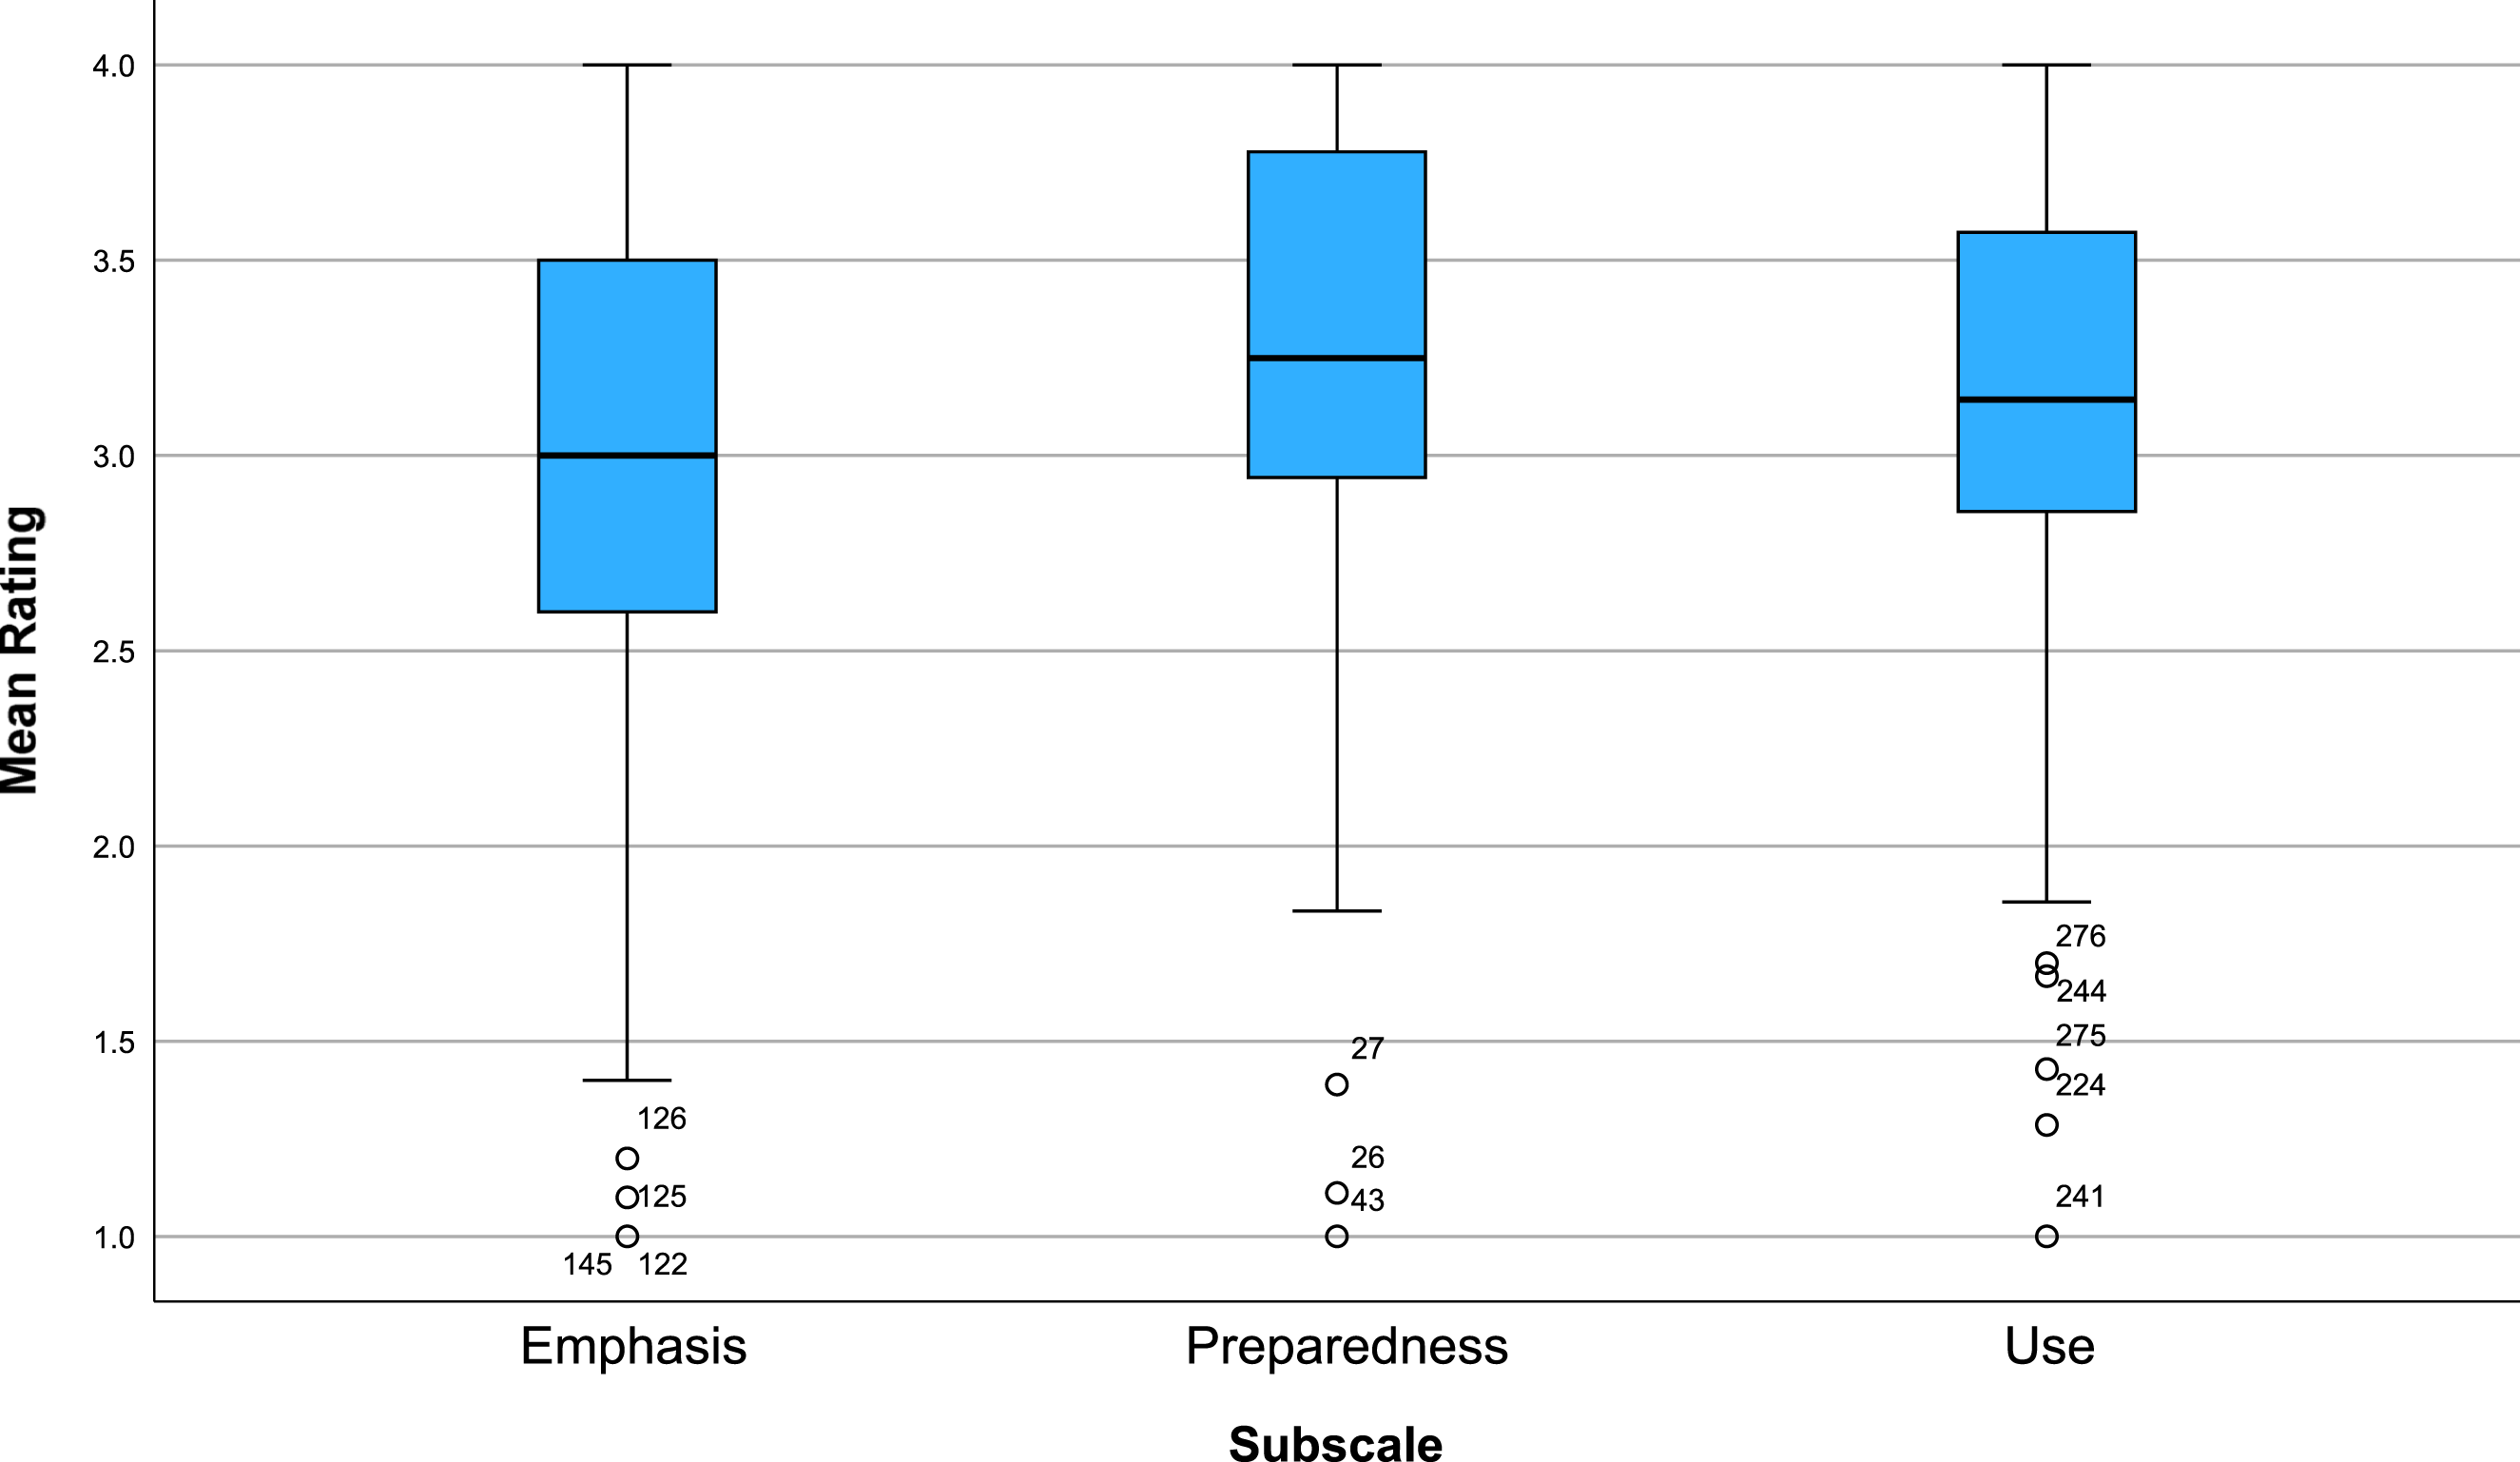
Box plots for emphasis, preparedness, and use ratings
Categorization Frequency of High and Low Relative Ratings for Each Distribution of Average Matrix Ratings
Qualitative Strand Results
STEM teacher perceptions of the greatest barriers to high quality STEM instruction on their campus
STEM Teacher Perceptions of the Most Effective Way to Teach STEM
Integrated Research Results
Overall integrated crossover analysis results are presented in two sets: results of integrating perceived barriers to STEM instruction with perceptual ratings and results of integrating perceptions about effective instruction integrated with perceptual ratings. Joint displays are used to synthesize the odds ratios from contingency table analyses and highlight where the Chi-square tests and odds ratios were statistically significant. Threats to the validity of Chi-square results when at least one cell frequency was less than 5 are indicated with a †. In these instances, Fisher’s Exact Test was interpreted instead of the Chi-square results. Statistically significant Chi-square results, or Fisher’s Exact Test results when at least one cell frequency was less than 5, (α = 0.05) are indicated with bold text. Odds ratios different from one (i.e., the 95% confidence interval around the odds ratio estimate did not include 1.0) are indicated with an *. Thus, the bold odds ratios with an asterisk highlight the most pronounced relationships between subscale ratings and emergent themes. To help interpret the overall pattern of odds ratio directionality, dark grey cell shading indicates the odds of mentioning the qualitative theme were greater when there was a high Likert rating than when there was a low Likert rating. Light grey cell shading indicates the odds of mentioning the qualitative theme were less when there was a high Likert rating than when there was a low Likert rating.
Perceived Barriers to STEM Instruction Integrated with Ratings
Q1. MIXED (design-based): When analyzed together, to what extent did patterns in elementary STEM teacher textual data about barriers to STEM instruction expand understanding of patterns in their rating data about STEM instructional preparedness, instructional objectives, and instructional practices? Q1a. MIXED (Chi-square-based): Were teacher perceptions about barriers to STEM instruction independent of their ratings about STEM instructional preparedness, instructional objectives, and instructional practices? Q1b. MIXED (odds ratio-based): Were stakeholders more or less likely to mention a barrier in the qualitative responses when they provided a high or low ratings about STEM instructional preparedness, instructional objectives, and instructional practices?
Joint Display of Odds Ratios Comparing the Odds of Mentioning the Barrier Themes Between STEM Teachers With High and Low Average Matrix Ratings
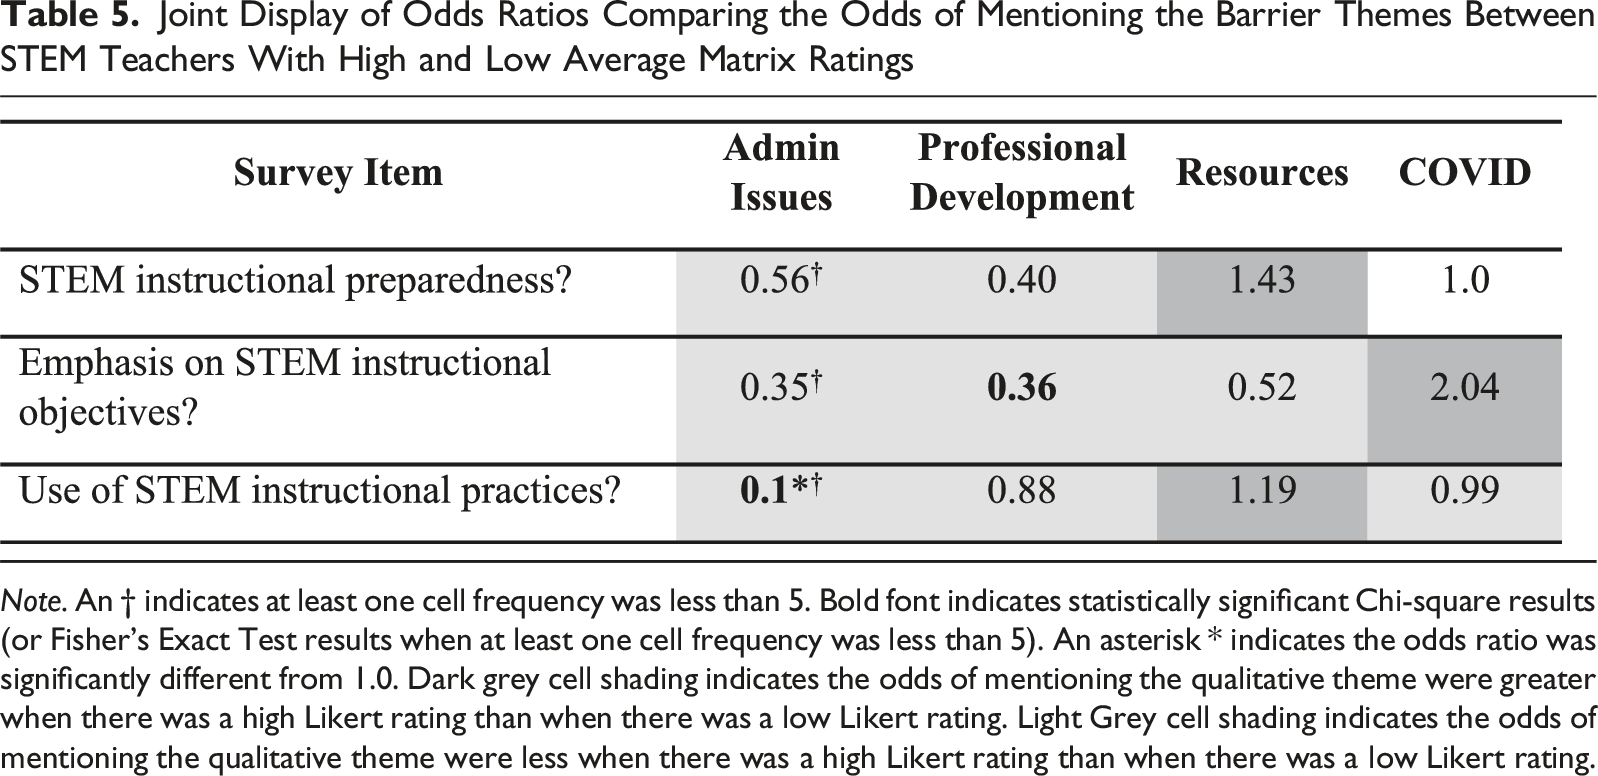
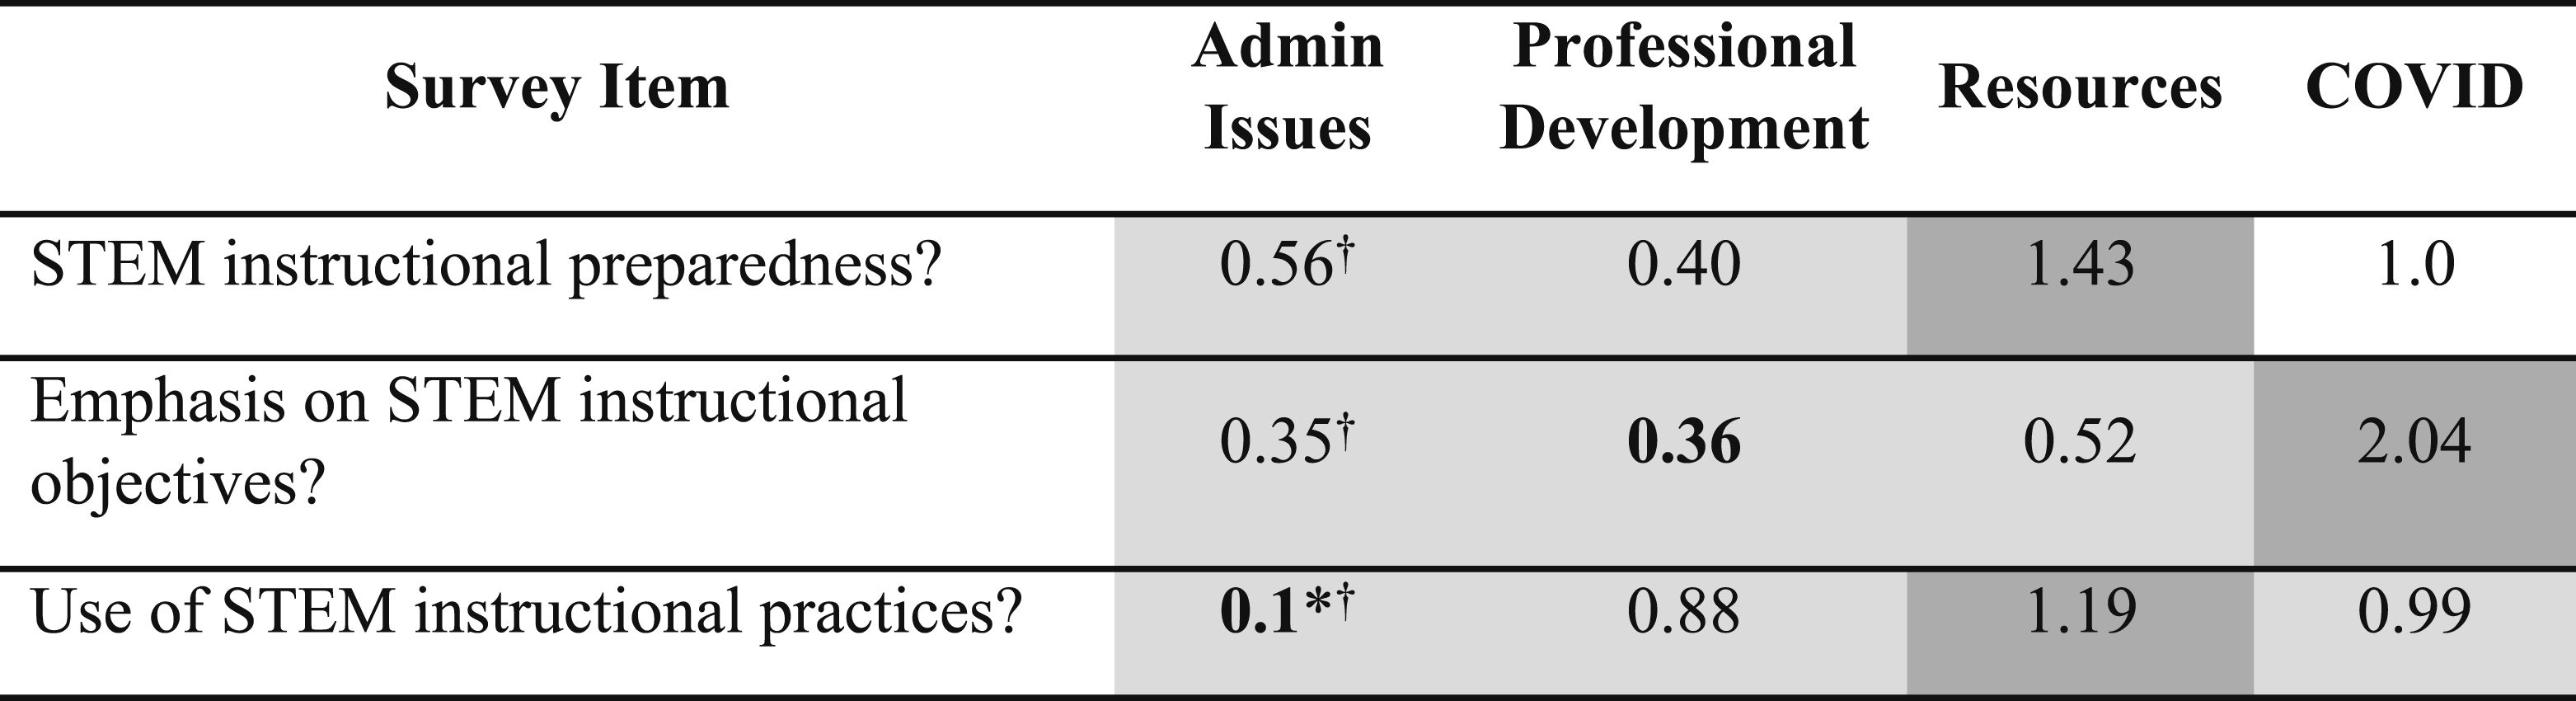
Note. An † indicates at least one cell frequency was less than 5. Bold font indicates statistically significant Chi-square results (or Fisher’s Exact Test results when at least one cell frequency was less than 5). An asterisk * indicates the odds ratio was significantly different from 1.0. Dark grey cell shading indicates the odds of mentioning the qualitative theme were greater when there was a high Likert rating than when there was a low Likert rating. Light Grey cell shading indicates the odds of mentioning the qualitative theme were less when there was a high Likert rating than when there was a low Likert rating.
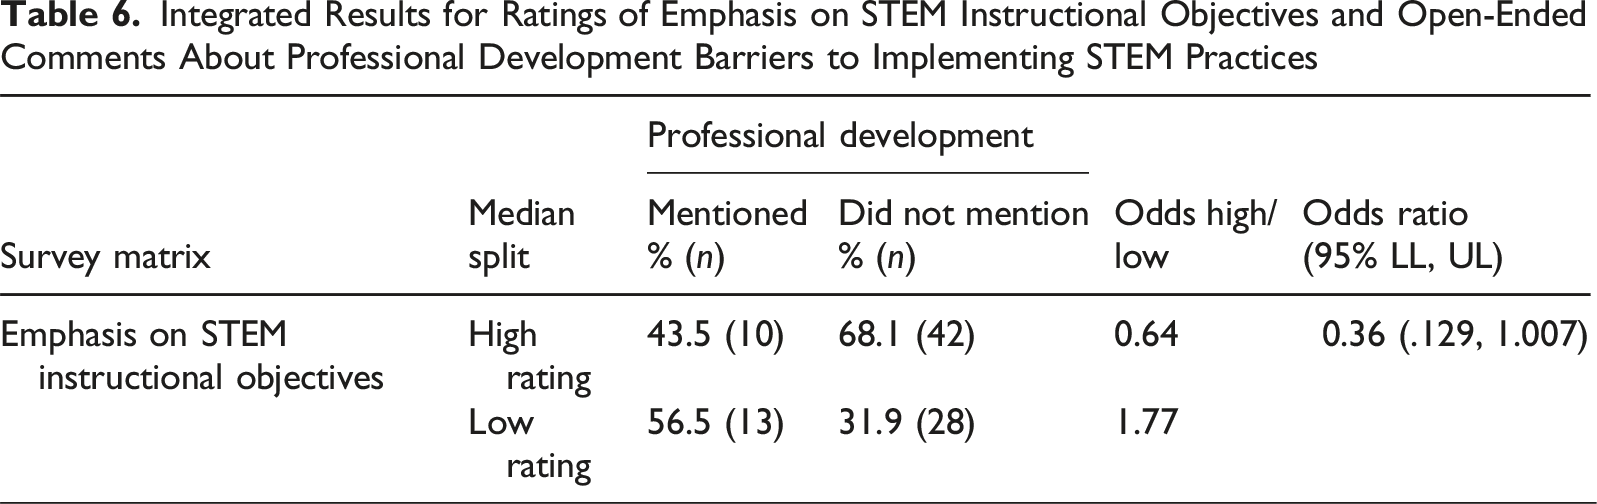
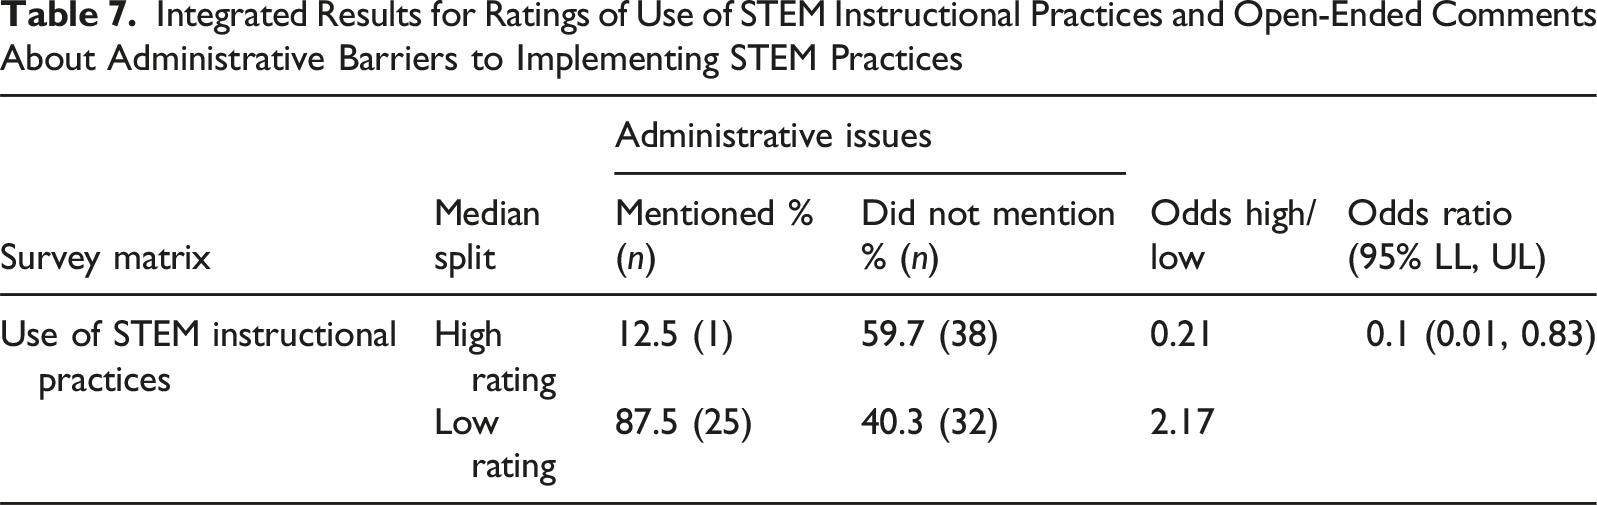
Two of the 12 potential meta-inferences were statistically significant. Overall, the meta-inferences suggest that teachers’ emphasis on STEM instructional objectives were related to their perceptions of professional development as a barrier to implementing STEM instructional practices, χ2 (1, N = 70) = 3.896, p = .048. Teachers’ use of STEM instructional practices were related to their perceptions of administrative issues as a barrier to implementing STEM instructional practices, χ2 (1, N = 70) = 6.355, p = .012. There was at least one cell frequency less than 5. Fisher’s exact test was used to determine if there was a significant association between use and administrative issues; there was a statistically significant association between the two variables (two-tailed p = .02). Next, we contextualize these two statistically significant results using odds ratios.
Integrated Results for Ratings of Emphasis on STEM Instructional Objectives and Open-Ended Comments About Professional Development Barriers to Implementing STEM Practices
Integrated Results for Ratings of Use of STEM Instructional Practices and Open-Ended Comments About Administrative Barriers to Implementing STEM Practices
Perceptions About Effective Approaches to Teach STEM Integrated with Rating Data
Q2. MIXED (design-based): When analyzed together, to what extent did patterns in elementary STEM teacher textual data about effective approaches for STEM instruction expand understanding of patterns in their rating data about STEM instructional preparedness, instructional objectives, and instructional practices? Q2a. MIXED (Chi-square-based): Were teacher perceptions about effective approaches for STEM instruction independent of their ratings about STEM instructional preparedness, instructional objectives, and instructional practices? Q2b. MIXED (odds ratio-based): Were stakeholders more or less likely to mention a method of instruction in the qualitative responses when they provided a high or low ratings about STEM instructional preparedness, instructional objectives, and instructional practices?
Joint Display of Odds Ratios Comparing the Odds of Mentioning Approaches for Effective Instruction Themes Between STEM Teachers With High and Low Average Matrix Ratings
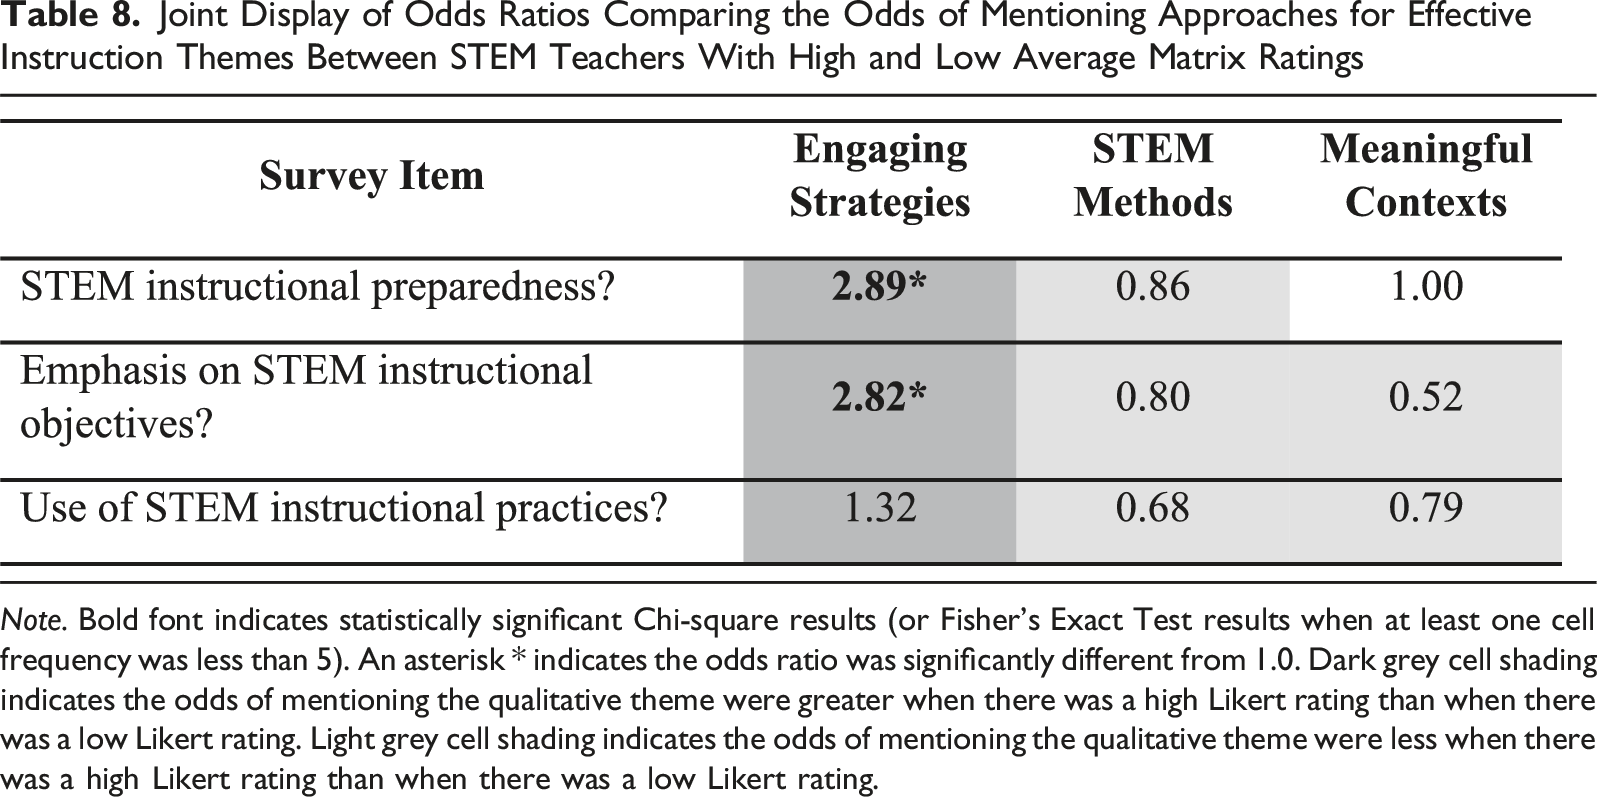
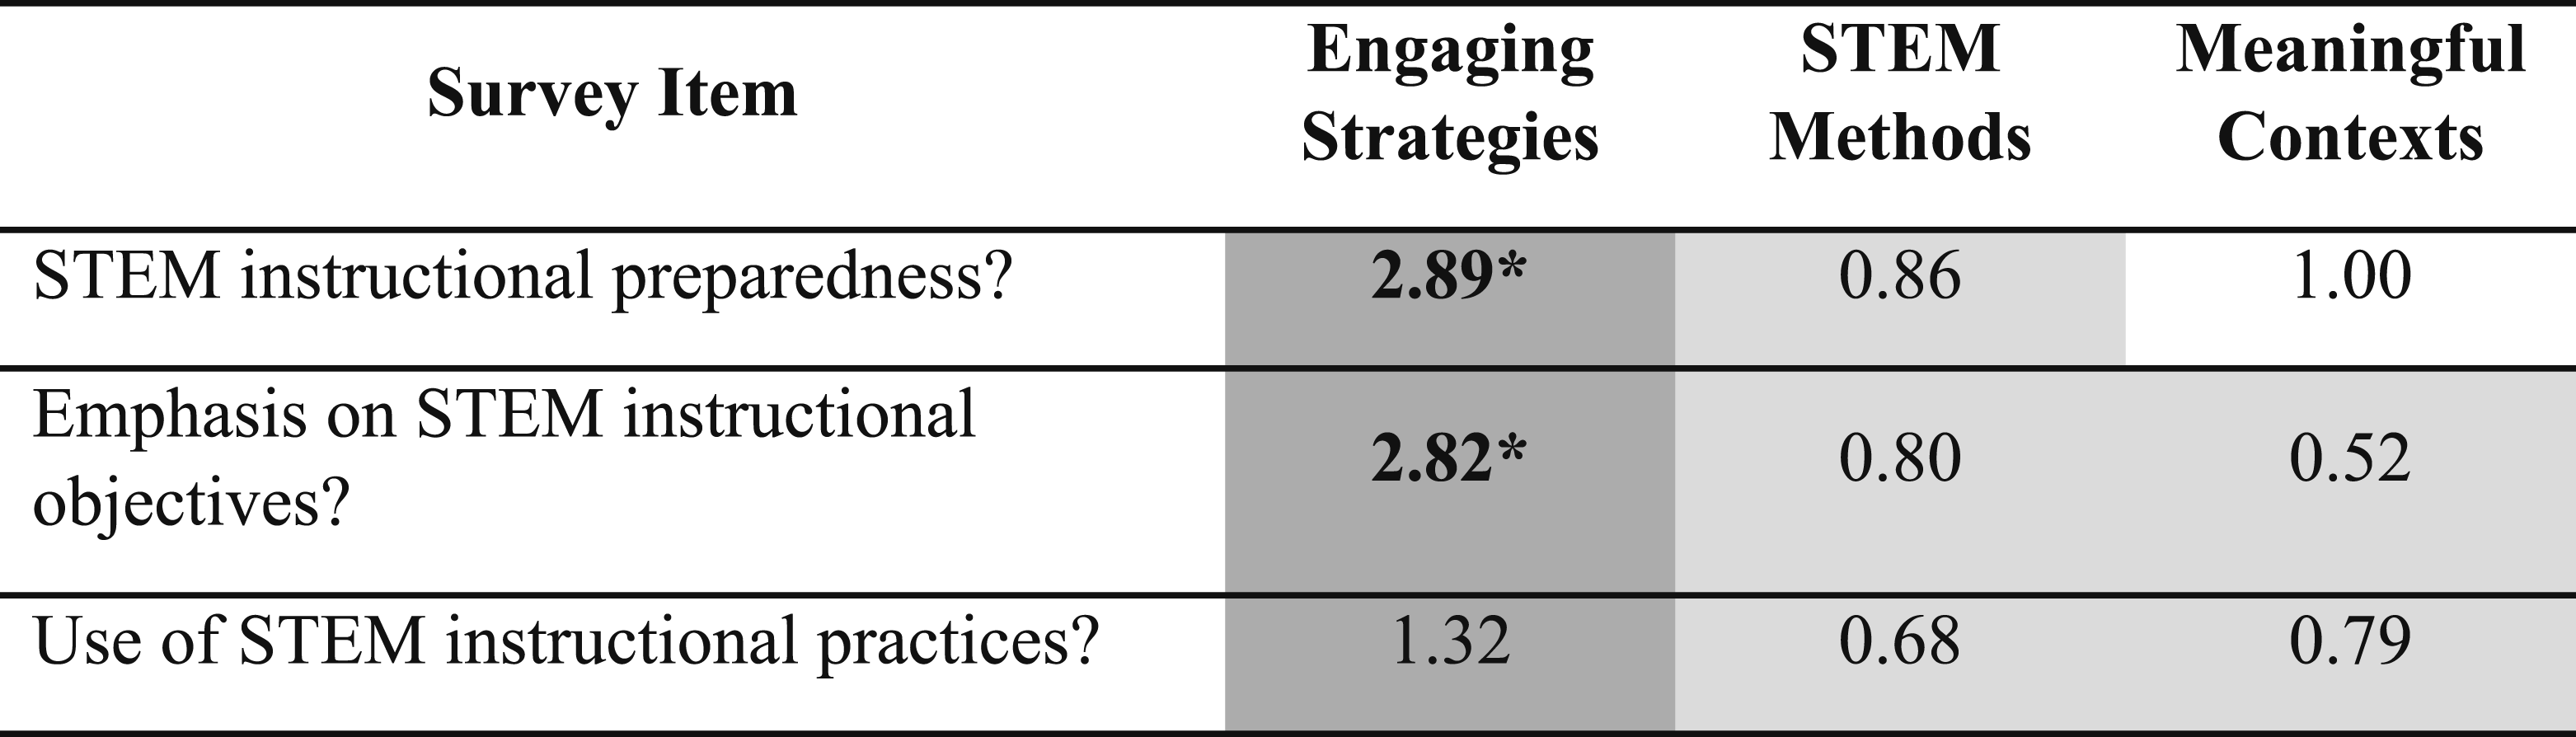
Note. Bold font indicates statistically significant Chi-square results (or Fisher’s Exact Test results when at least one cell frequency was less than 5). An asterisk * indicates the odds ratio was significantly different from 1.0. Dark grey cell shading indicates the odds of mentioning the qualitative theme were greater when there was a high Likert rating than when there was a low Likert rating. Light grey cell shading indicates the odds of mentioning the qualitative theme were less when there was a high Likert rating than when there was a low Likert rating.
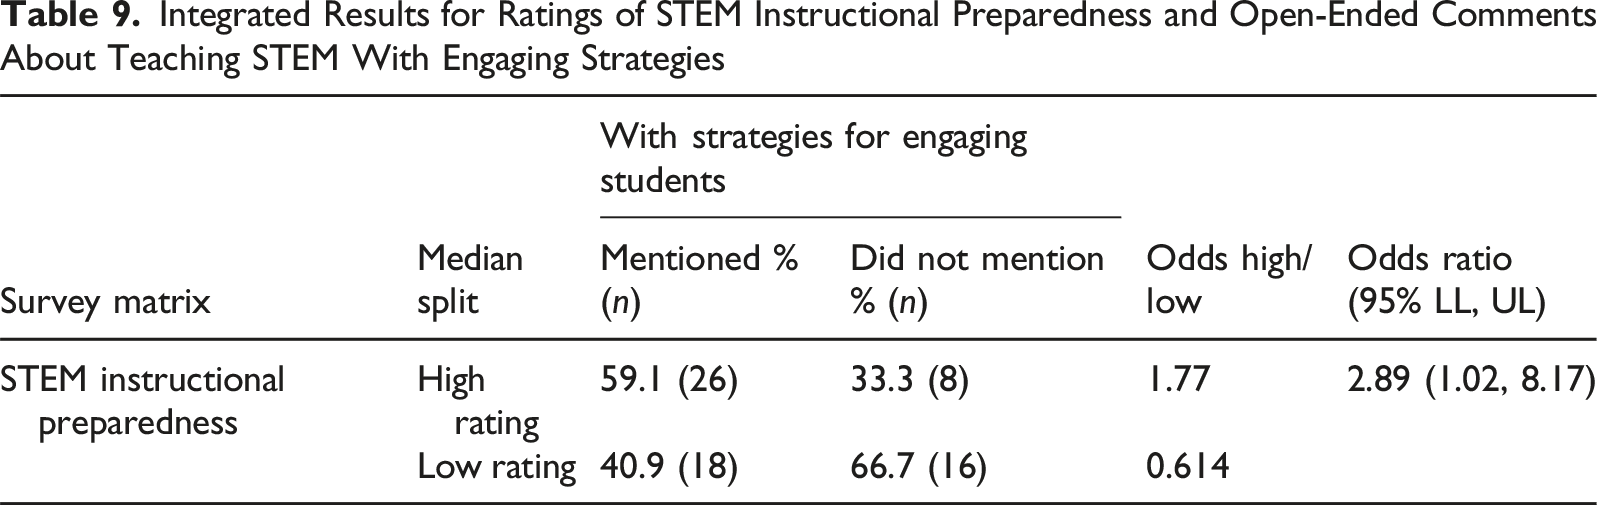
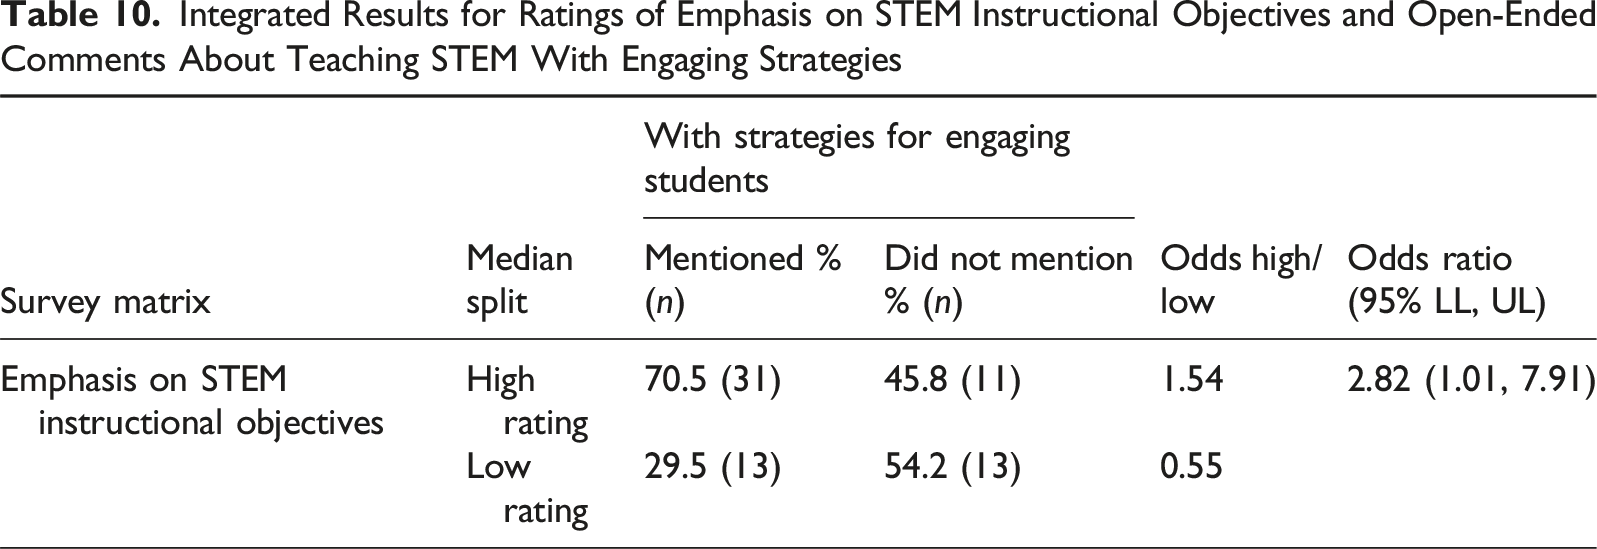
Two of the nine potential meta-inferences were statistically significant. Overall, the meta-inferences suggest that both teachers’ feelings of preparedness for STEM instruction, χ 2 (1, N = 68) = 4.121, p = .042, and emphasis on STEM instructional objectives, χ 2 (1, N = 68) = 3.986, p = .046, were related to their perceptions about using engaging strategies as the most effective way to deliver STEM instruction. Similar to the previous set of analyses, we contextualize these two statistically significant results using odds ratios.
Integrated Results for Ratings of STEM Instructional Preparedness and Open-Ended Comments About Teaching STEM With Engaging Strategies
Integrated Results for Ratings of Emphasis on STEM Instructional Objectives and Open-Ended Comments About Teaching STEM With Engaging Strategies
Discussion
Integrated Findings
In this methodologically oriented mixed methods study, we presented an application of contingency tables as a method of crossover analysis. Quantitative and qualitative responses were integrated to achieve complementarity in a convergent mixed methods design. Here, we defined complementarity as integration of two methods to achieve results that expand coverage and supplement each other with a greater breadth of information (Creswell & Plano Clark, 2026; Greene et al., 1989; Plano Clark & Ivankova, 2016). The design leveraged a quantitative-dominant crossover analysis (Hitchcock & Onwuegbuzie, 2020) through transforming and integrating dichotomized quantitative postpositivist data and qualitative interpretivist data in contingency tables for joint interpretation using Chi-square and odds ratio analyses.
Integration of quantitative ratings and qualitative perceptions enabled evaluation of context-based causality between perceptions about barriers to, and effective approaches for, STEM instruction and teacher feelings of preparedness to deliver STEM instruction, emphasis on STEM learning objectives, and use STEM instructional practices. Through integration, we observed significant patterns between ratings of practice and perceptions of barriers to STEM implementation and effective ways to teach STEM; patterns about program implementation that were undetectable as unmerged quantitative and qualitative survey results. The Chi-square analyses provided information on the relationship between strands. The odds ratio analyses provided information on the likelihood of providing a themed qualitative response given a quantitative subscale rating in the upper or lower 50% of the distribution of rating responses. The integrated data served as two puzzle pieces of a larger perceptual picture about program implementation.
Teachers’ emphasis on STEM instructional objectives were related to their perceptions of professional development as a barrier to implementing STEM instructional practices. Teachers who felt they emphasized STEM instructional objectives were less likely to perceive professional development as a barrier to STEM implementation than teachers who felt they did not emphasize STEM instructional objectives. Teachers’ use of STEM instructional practices was related to their perceptions of administrative issues as a barrier to implementing STEM instructional practices. Teachers who felt they frequently used STEM instructional practices were less likely to perceive administrative issues as a barrier to STEM implementation than teachers who felt they did not frequently use STEM instructional practices. Both teachers’ feelings of preparedness for STEM instruction and their emphasis on STEM instructional objectives were related to their perceptions about using engaging strategies as the most effective way to deliver STEM instruction. Teachers who felt prepared to deliver STEM instruction and felt they emphasized STEM instructional objectives were more likely to perceive engaging strategies as the most effective way to deliver STEM instruction than teachers who felt unprepared and did not emphasize STEM instructional objectives.
Field Specific Implications
A recent report on the future of education research from the National Academy of Sciences, Engineering, and Medicine ([NASEM], 2022) proposed an increased emphasis on mixed methods approaches in funded research. The report authors posited that mixed methods approaches, in contrast with single-method approaches, can produce findings about the effectiveness of educational interventions that are both useful and reliable due to their ability to look across data sources to determine how an intervention performs across settings and contexts. In the case of the present method of crossover analysis, the use of a mixed methods approach provided greater knowledge integration, revealing overall patterns across quantitative and qualitative responses that did not emerge in the initial quantitative and qualitative analyses of study data.
The method of crossover analysis also provides new knowledge about how researchers who are evaluating interventions and programs might approach the design of survey questions for the explicit purpose of connecting the understanding of different facets of the same implementation phenomena. The integration of closed-ended scales and open-ended questions allowed for a more in-depth exploration of the extent to which qualitative responses are related to quantitative perceptual ratings, potentially providing valuable information to program developers about necessary adaptations prior to program scale-up. Beyond informing survey design for evaluations, the additional examples of mixed methods analysis can greatly benefit practicing researchers by expanding their mixed methods repertoires. Diversifying the mixed methods approaches used by applied researchers is especially important because they rarely find themselves working with quant- or qual-only data.
Limitations
The proposed method of crossover analysis aimed to address three variations of mixed methods research questions (i.e., design-based, Chi-square-based, and odds ratio-based questions) through “integration rather than juxtaposition” (Onwuegbuzie, 2024, p. 7) in a convergent mixed methods design. Central to this aim was data transformation and integrated analyses of quantitative and qualitative strand results. Numerous methodological issues with data transformation and the resulting inferences with Chi-square analysis are identified in the literature (e.g., bias detection, bivariate versus multivariate analysis, association versus measurement invariance; Onwuegbuzie, 2024). However, we emphasize two limitations inherent with quantitizing qualitative data into present versus absent coding and the resulting implications on meta-inferences.
When engaged in quantitization of qualitative data, there are three types of responses to which codes are applied: the said, the implicitly said, and unsaid (Nzabonimpa, 2018). The transformation process involves judgements about whether a theme is present (i.e., said or implicitly said) or absent (unsaid). The act of coding text into dichotomous numerical values strips the original qualitative data of rich context, resulting in a loss of critical information, that is, limitation #1 (Cox et al., 2021; Nzabonimpa, 2018; Sandelowski et al., 2009). Not only is information lost in the coding process, but the process of transformation, inclusive of researcher judgements about what constitutes the said or unsaid, can also disappear in the data reduction process (Sandelowski et al., 2009).
Researcher judgements about what constitutes the unsaid represents a second limitation of the crossover analysis method specific to the distinction between that which is not said and that which is truly absent (de Block & Vis, 2019; Sandelowski et al., 2009). The interpretive challenge here lies in the difference between something absent from the data and something absent from the human experience. For example, Absent may, among other options, mean that “it” (a) did not come up; (b) was not seen by the analyst; (c) was forgotten as a factor by the participant; (d) was thought by the participant to be so understood as to not require bringing it up; (e) was a factor, but the participant did not want to bring “it” up; (f) was not brought up because the conversation veered away from “it”; and (g) truly was not a dimension of experience. (Sandelowski et al., 2009, p. 217)
Because the present versus absent coding was used to draw inferences about the relationship between participant perceptions of practice and experience with implementation based on mentioning key experiential themes, the coding challenge around the unsaid presents a legitimate threat to the validity of the resulting meta-inferences. This threat can best be understood through the nine types of legitimation presented by Onwuegbuzie and Johnson (2006). Most of the issues of legitimation were arguably addressed through use of the same sample in both strands (i.e., sample legitimation), the research team’s background in STEM education (i.e., insider-outsider legitimation), the collection of complementary perceptional ratings and open-ended experience-based data (i.e., weakness minimization legitimation), the concurrently quantitative and qualitative data collection (i.e., sequential legitimation), the reliability steps taken with the deductive coding (i.e., commensurability legitimation and multiple validities legitimation), and the overarching critical realist paradigm (i.e., paradigmatic mixing legitimation). Consequently, we focus on conversion legitimation and political legitimation as the most significant threats to forming quality meta-inferences from the joint analysis of quantitative and qualitative data.
The issue inherent with interpreting the unsaid as equivalent to an absence of the theme from the human experience represents a significant threat to the conversion legitimation. By assuming validity to the judgement of present (i.e., said and implicitly said) and absent, we risk simultaneously overweighting the presence of experiences and underweighting the absence of experiences in the analyses. The consequence of this potential for over and underweighting the prevalence of experiences in the qualitative data set could lead to both false positives (significant findings) and false negatives (nonsignificant findings).
Lastly, regarding political legitimation, we contend that this last form of legitimation is only partly addressed. There are two key elements to political legitimation that may lead to rejection of integrated findings, combining results when different researchers are used for the quantitative and qualitative strands (presumably due to differences in researcher methodological expertise) and when interpretive decisions fall to the researchers versus to the stakeholders. Because the members of the research team that engaged in quantitative analysis were also the same two researchers that independently and faithfully engaged in the process of inductive qualitative data analysis in the qualitative strand, the centralization of interpretative decisions with the research team remains the only potential threat to political legitimation.
Contribution to the Field of Mixed Methods
Connecting complementary quantitative and qualitative perceptual data is critical to establishing a holistic point of view. The two types of data about different facets of the same topic provide a more comprehensive understanding than either method alone. However, juxtaposition is not enough. Integration is necessary. We provided empirical example and crossover analysis method for achieving complementarity in a convergent mixed methods design using Chi-square and likelihood analysis to connect quantitative and qualitative responses.
At its core, the method of data integration and crossover analysis was means to understand if survey participants were more or less likely to mention a qualitative theme when they had a high Likert rating than when they had a low Likert rating. The straightforward method of transforming and integrating dichotomized quantitative and qualitative responses for interpretation using Chi-square and odds ratio analyses makes key contributions to the field of mixed methods that may shape how mixed methods researchers think about, design, and analyze surveys collecting both quantitative and qualitative data.
For example, the design and analysis of surveys in evaluation research are linked a priori planning activities aimed at assessing both program outcomes and implementation fidelity. Assessing fidelity, or the extent to which a program is implemented as designed, helps evaluators differentiate insufficiently designed programs from insufficiently implemented programs (Carroll et al., 2007; Giancola, 2025; Meyers & Brandt, 2015). The integration of stakeholder ratings about knowledge, attitudes, and behaviors related to program implementation with stakeholder experiences about what worked well, what did not, and what could be done differently is critical to connecting what stakeholders are doing and learning with why they are (or are not) doing or learning it. The current contingency table approach to the integration of quantitative ratings and qualitative experiences using Chi-square and odds ratio analyses offers example of one mechanism for anticipating how these types of perceptual responses may be linked, and the types of questions that might be conceptualized, for the purpose of generating a holistic view of program implementation and effectiveness.
Alternative crossover analysis possibilities are easily extended from the current approach depending upon how the relationship between qualitative and quantitative strands is framed. For example, quantitative dominant crossover analyses might use the dichotomous qualitative strand variables (i.e., 0/1, mentioned versus did not mention) as dependent variables in logistic regression using various combinations and forms of Likert-type responses as independent variables. Conversely, the dichotomous qualitative strand variables (i.e., 0/1) may be used as independent variables to explore group differences in the Likert-type responses as dependent variables. These analyses may range from simple independent samples t-tests to more complex multivariate analyses such as MANOVA, analyses that explore dimensionality and clustering, and those focused on measurement (Onwuegbuzie, 2024a, 2024b). Qualitative dominant crossover analysis might use the dichotomous quantitative strand variables (i.e., 0/1, high or low relative ratings) as grouping variables for separate thematic analyses of open-ended qualitative responses. These examples are only a few of the alternative possibilities that extend from the current approach.
Lastly, teaching and learning mixed methods can be rewarding yet challenging. Mixed methods research requires foundational knowledge in both quantitative and qualitative data collection and analysis as steppingstones to understanding mixed data collection and analysis. One of the more nuanced concepts of mixed methods research lies in differences between rationales for conducting mixed methods studies and how the process of integration serves those rationales and mixed research questions. In our experience, graduate students often gravitate to offsetting strengths and weaknesses as a general rationale for mixing methods but struggle to understand differences inherent in the meta-inferences related to explanation, generalization, corroboration, and complementarity. Identifying and developing a concrete example of mixed methods crossover analysis was partly motivated by a need for concrete methodological example of complementarity (and contrast to corroboration) for teaching and learning graduate mixed methods coursework. We hope this might serve similar concrete example for others teaching similar methods content.
Footnotes
Funding
The authors received no financial support for the research, authorship, and/or publication of this article.
Declaration of Conflicting Interests
The authors declared no potential conflicts of interest with respect to the research, authorship, and/or publication of this article.