
Abstract
Background
Akt1, a crucial component of the PI3K/Akt signaling pathway, mediates a plethora of cancer-related processes such as cell growth, proliferation, survival, apoptosis and invasion. So, the pathogenesis of various types of cancer may be attributed to single nucleotide polymorphisms (SNPs) in the AKT1 gene. Here, we aimed to investigate whether AKT1 rs1130214, rs1130233 and rs2494732 SNPs are associated with an increased risk of breast cancer (BC).
Material and methods
A total of 100 women diagnosed with BC and 100 healthy controls were included. The AKT1 SNPs were genotyped using polymerase chain reaction-restriction fragment length polymorphism (PCR-RFLP) and amplification refractory mutation system PCR (ARMS-PCR) methods. Using logistic regression analysis, the genotypic and allelic associations between AKT1 SNPs and BC development were determined under co-dominant, dominant, and recessive inheritance models. Genotype combination and haplotype analysis were also performed to assess the combined effect of the AKT1 SNPs on the risk of BC. We used RNAsnp online server to predict the effect of rs1130233 SNP on local RNA secondary structure.
Results
The rs1130233 SNP was observed to be significantly associated with predisposition to BC under recessive inheritance model (p < 0.05). The rs1130233 T allele confers risk of developing BC (OR: 1.877; 95% CI: 1.242–2.837; p = 0.003). For rs1130214/rs2494732 and rs1130233/rs2494732, AA/TC and CC/TC combined genotypes were found to be independently associated with reduced risk of BC, respectively. We also found that individuals with the CTC haplotype have an increased risk of BC (p < 0.05).
Conclusion
Our results highlight that AKT1 rs1130233 SNP is significantly associated with a higher risk of BC. Furthermore, the CTC haplotype can be utilized to identify individuals with a genetic susceptibility to BC.
Introduction
Breast cancer (BC) is by far the most commonly diagnosed malignancy in females worldwide, accounting for nearly 12.5% of all new annual cancer cases. 1 With 670, 000 deaths (∼7% of all cancer deaths), BC is now the fourth leading cause of cancer mortality globally. 1 In 2024, it is expected that there will be 310,720 new cases of BC (32% of all new cases) and 42,250 women will die from the disease (15% of all cancer-related deaths) in the United States, according to the latest American Cancer Society (ACS) estimates. 2 BC is multifactorial in nature and arises from the complex interaction of multiple genetic, environmental, and behavioral/lifestyle factors.3,4 To date, much effort has been devoted to shed light on the cellular and molecular mechanisms that underlie the initiation and progression of the disease.5,6 However, these are only the tip of the iceberg, and many aspects of BC are still unanswered enigma.
The phosphatidylinositol 3-kinase (PI3K)/protein kinase B (AKT) signaling pathway, as an evolutionarily conserved signaling cascade, regulates a wide array of cell physiological processes such as cell growth, proliferation, differentiation, motility, metabolism, migration, autophagy, survival, and apoptosis.7,8 It is therefore not surprising that the PI3K/Akt pathway is dysregulated almost in all human cancers, and is being ardently pursued as a potential therapeutic target. Akt (also referred to as protein kinase B or PKB) family, as one of the key components of this pathway, comprises three closely related isoforms with distinct functions, namely Akt1 (PKBα), Akt2 (PKBβ), and Akt3 (PKBγ). 9 They are serine/threonine kinases belonging to the cAMP-dependent protein kinase A/ protein kinase G/ protein kinase C (AGC) superfamily of protein kinases. 9 Each isoform is encoded by a given gene, AKT1 located on 14q32, AKT2 on 19q13 and AKT3 on 1q44, but proteins share a high degree of structural homology. 10 All three isoforms possess an N-terminal pleckstrin homology (PH) domain, a central catalytic kinase domain, and a C-terminal regulatory domain containing a hydrophobic motif (HM).9,10 Akt1 is the most ubiquitously expressed member of the family, while Akt2 is predominantly expressed in in insulin-responsive tissues such as liver, skeletal muscle, and adipose tissue, and Akt3 is primarily expressed in brain, and testes. 9 These cell- and tissue-specific expression patterns suggest unique functions for each isoform. 11 Akt1 plays a fundamental role in cell growth and survival, while Akt2 governs glucose metabolism, and Akt3 is involved in brain development. 12 Meanwhile, Akt isoforms are unique in their subcellular distribution: Akt1 is located in the cytoplasm, Akt2 in the mitochondria, and Akt3 in the nucleus or nuclear envelope. 13 Functionally, Akt isoforms act as downstream effectors of many growth factor signaling pathways. 11 Binding growth factors to their receptor tyrosine kinase (RTK) leads to the dimerization and autophosphorylation of RTK and triggers the class IA phosphatidylinositol 3-kinases (PI3K) activation. 14 PI3K catalyzes the generation of the lipid second messenger phosphatidylinositol-3,4,5-triphosphate (PIP3), which binds to the PH domain of Akt. Site-specific phosphorylation by 3-phosphoinositide-dependent kinase 1 (PDK1) triggers activation of Akt. 14 Subsequently, activated Akt mediates the phosphorylation of a series of downstream target proteins such as glycogen synthase kinase 3 (GSK-3), nuclear factor kappa B (NF-κB), mouse double minute 2 homolog (MDM2), forkhead box protein O (FOXO), mammalian target of rapamycin (mTOR), and Bcl-2 agonist of cell death (BAD), which can lead to tumorigenesis. 14
Akt overexpression and hyperactivation is a common feature of a myriad of human malignancies. 15 One of the causes of dysregulated expression and activity of AKTs is single nucleotide polymorphisms (SNPs) in those genes. Although many SNPs have been identified in the AKT1 gene, but rs1130214, rs1130233, and rs2494732 are the most common ones. A body of emerging evidence suggests that these SNPs may be associated with risk of gastric cancer (GC), 16 papillary thyroid cancer (PTC), 17 head and neck squamous cell carcinoma (HNSCC), 18 nasopharyngeal carcinoma (NPC), 19 oral squamous cell carcinoma (OSCC), 20 and non-small cell lung cancer (NSCLC). 21 To the best of the authors’ knowledge, no studies so far have investigated the possible association of AKT1 rs1130214, rs1130233 and rs2494732 polymorphisms with an increased risk of BC. Therefore, this study was designed for the first time to address the question of whether AKT1 SNPs and haplotypes can underlie susceptibility to BC in Iranian women.
Materials and methods
Subjects
In this case-control study, one hundred women who had histopathologically confirmed BC (mean age ± standard deviation (SD); 51.56 ± 11.24 years, range 29 to 80) were recruited from the Anahid Breast Cancer Clinic, Isfahan Healthcare City, Isfahan, Iran between August 2020 and April 2021. Histopathological assessment of breast biopsies was performed by a panel of pathologists at the hospital’s histology laboratory. Detailed clinicopathological characteristics of all BC cases including age at diagnosis, tumor histological type, grade, stage, size, laterality, family history, and status of lymph node metastasis were collected by reviewing the patients’ medical records and pathology reports. Patients who underwent preoperative chemotherapy, hormone therapy, and/or radiotherapy were excluded. The control group consisted of one hundred healthy, unrelated, ethnically matched women without any personal and/or family history of BC or any other cancers (mean age ± SD; 39.01 ± 10.51 years, range 17 to 76). A questionnaire form was used to capture demographic and clinical data for all healthy participants. This study was approved by the Institutional Review Board /Independent Ethics Committee (IRB/IEC) of the Shahid Ashrafi Esfahani University, Isfahan, Iran (Ethical Approval Code: No. 329.12 MP, 07.09.2023). In compliance with the principle of the World Medical Association’s Declaration of Helsinki, written informed consent form was signed by all subjects before participating in the study.
DNA extraction and genotyping of the AKT1 SNPs
Primer sequences and restriction enzyme used in ARMS-PCR and PCR-RFLP assays for genotyping of the AKT1 rs1130214, rs1130233 and rs2494732 polymorphisms.
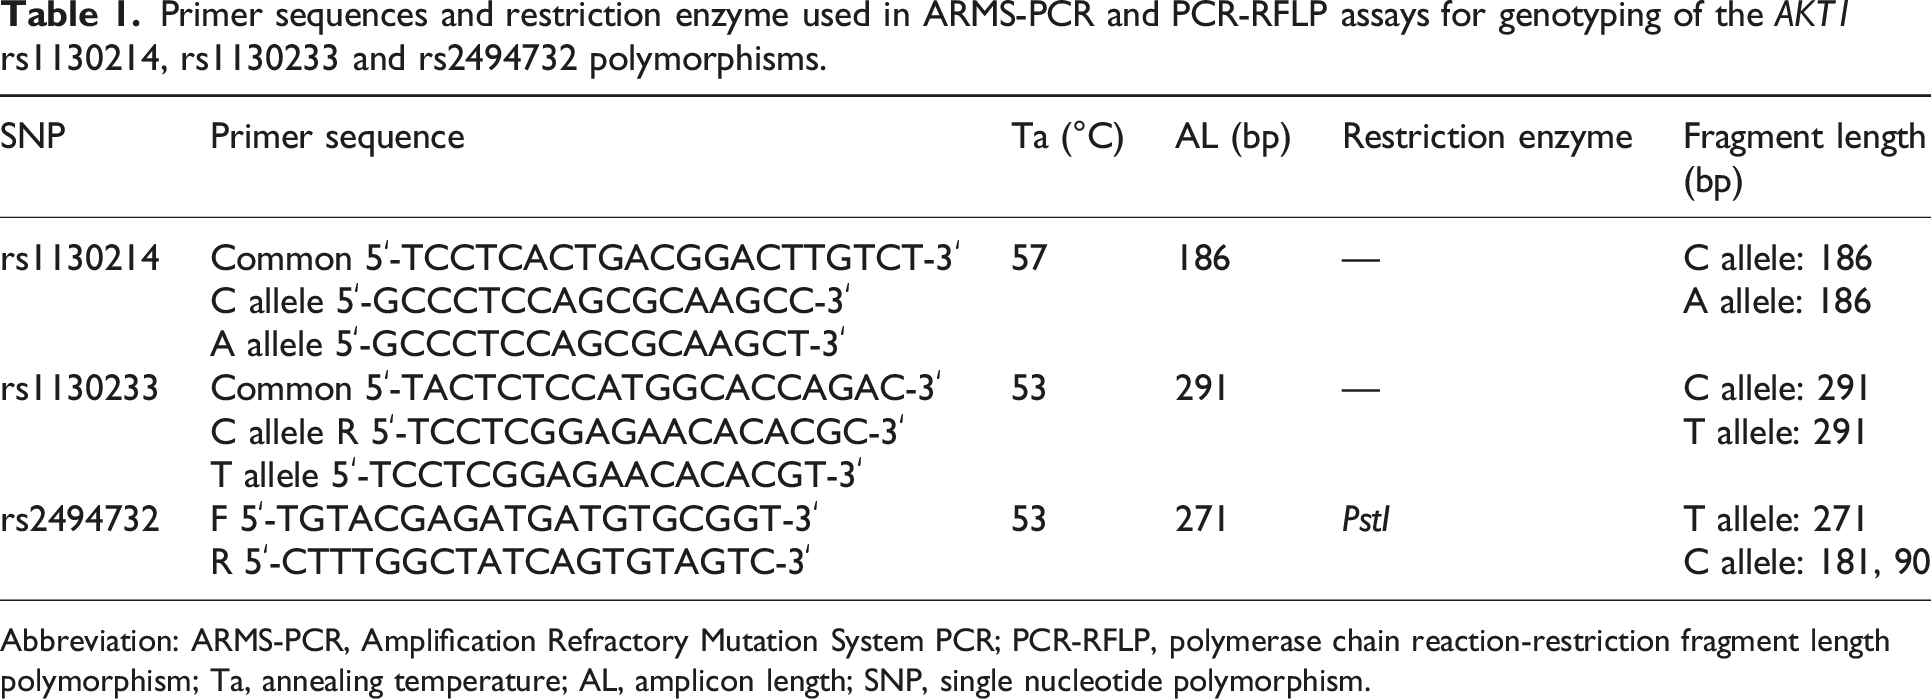
Abbreviation: ARMS-PCR, Amplification Refractory Mutation System PCR; PCR-RFLP, polymerase chain reaction-restriction fragment length polymorphism; Ta, annealing temperature; AL, amplicon length; SNP, single nucleotide polymorphism.
Linkage disequilibrium and haplotype analysis
Pairwise linkage disequilibrium (LD) between AKT1 SNPs was determined by Lewontin’s standardized coefficient (D′) and the square of the Pearson’s correlation coefficient (r2) values using the online web-based SHEsis online server (https://analysis.bio-x.cn/myAnalysis.php). The distribution of haplotypes was compared between BC patients and healthy controls to evaluate the association of haplotypes with the risk of BC.
In silico analysis
The sequence of AKT1 mRNA in FASTA format was retrieved from the National Center for Biotechnology Information (NCBI) (https://www.ncbi.nlm.nih.gov/) as an input to examine whether AKT1 rs1130233 SNP (c.726 G/A) has an impact on the local RNA secondary structure. Web-based RNAsnp server (https://rth.dk/resources/rnasnp/) was used to predict the effect of this polymorphism on mRNA secondary structure based on the RNA folding algorithms.
Statistical analysis
All statistical analysis was performed using IBM Statistical Package for Social Sciences (SPSS) Statistics for Windows, Version 22.0 (IBM Corp., Armonk, N.Y., USA). Any p value less than 0.05 was considered statistically significant. Continuous variables were expressed as mean ± standard deviation (SD) and compared by Student’s t-test. Fisher’s exact test was used to compare the genotype distributions and allele frequencies of AKT1 rs1130214, rs1130233 and rs2494732 polymorphisms between BC patients and healthy controls. Testing AKT1 SNPs for deviations from Hardy-Weinberg equilibrium (HWE) was performed using chi-square test (https://gene-calc.pl/hardy-weinberg-page). By calculating odds ratio (OR) and corresponding 95% confidence interval (95% CI) computed using from logistic regression analysis, the possible association of AKT1 rs1130214, rs1130233 and rs2494732 SNPs with increased risk of BC was determined in the co-dominant, dominant and recessive inheritance models. Moreover, the possible association between AKT1 rs1130214, rs1130233 and rs2494732 SNPs and patientsʹ clinicopathological features was calculated using Chi-square test.
Results
Baseline characteristics of participants
Demographic and clinicopathological characteristics of breast cancer patients and healthy controls.

Abbreviation: SD, standard deviation; BMI, body mass index; IDC, invasive ductal carcinoma; ILC, invasive lobular carcinoma.
Values are presented as mean ± SD for age, weight, height and BMI, and as % for other variables.
p values were calculated using t-test for continuous variables and Chi-square test for categorical variables.
Bold values indicate statistically significant differences (p < 0.05).
Association of AKT1 SNPs with BC risk under different inheritance models
Genotype and allele distribution of AKT1 rs1130214, rs1130233 and rs2494732 polymorphisms in breast cancer patients and healthy controls.

Abbreviation: OR, odds ratio; CI, confidence interval; HWE, Hardy-Weinberg equilibrium.
p value were calculated by Chi-square test.
Bold values indicate statistically significant differences (p < 0.05).
Distribution of AKT1 rs1130214, rs1130233 and rs2494732 polymorphisms combined genotypes in breast cancer patients and healthy controls.

Abbreviation: OR, odds ratio; CI, confidence interval; ND, not determined.
p value calculated by Chi-square test.
Bold values indicate statistically significant differences (p < 0.05).
Association of AKT1 SNPs with patients’ clinicopathological parameters
Association of AKT1 rs1130214 polymorphism with age, BMI, family history of breast cancer, histological type, histological grade, tumor size and other organ metastasis in breast cancer patients.

Abbreviation: BMI, body mass index; IDC, invasive ductal carcinoma; ILC, invasive lobular carcinoma; ND, not determined.
Values are presented as number (%).
p values were calculated using Chi-square test.
Bold values indicate statistically significant differences (p < 0.05).
Association of AKT1 rs1130233 polymorphism with age, BMI, family history of breast cancer, histological type, histological grade, tumor size and other organ metastasis in breast cancer patients.

Abbreviation: BMI, body mass index; IDC, invasive ductal carcinoma; ILC, invasive lobular carcinoma; ND, not determined.
Values are presented as number (%).
p values were calculated using Chi-square test.
Bold values indicate statistically significant differences (p < 0.05).
Association of AKT1 rs2494732 polymorphism with age, BMI, family history of breast cancer, histological type, histological grade, tumor size and other organ metastasis in breast cancer patients.

Abbreviation: BMI, body mass index; IDC, invasive ductal carcinoma; ILC, invasive lobular carcinoma; ND, not determined.
Values are presented as number (%).
p values were calculated using Chi-square test.
Association between the haplotypes of AKT1 SNPs and BC risk
Pairwise LD of AKT1 rs1130214, rs1130233 and rs2494732 polymorphisms in breast cancer patients and healthy controls.
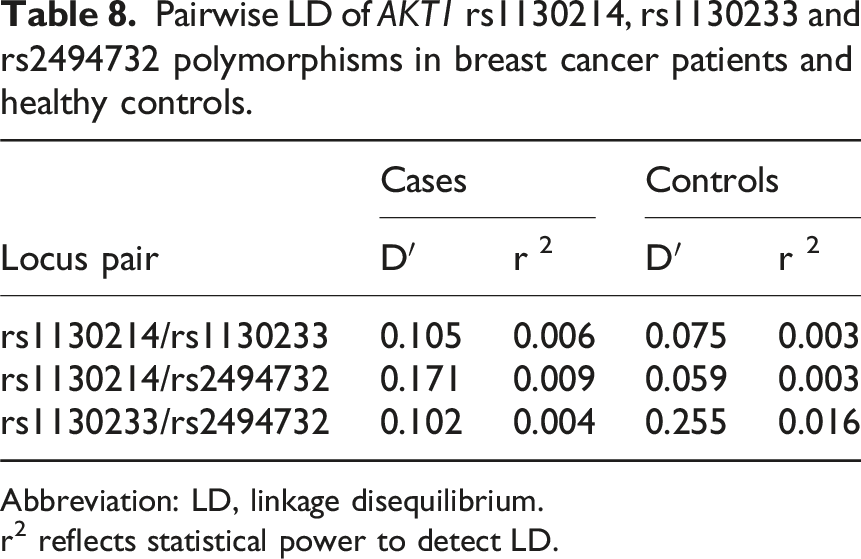
Abbreviation: LD, linkage disequilibrium.
r2 reflects statistical power to detect LD.

Linkage disequilibrium (LD) plot of AKT1 rs1130214, rs1130233 and rs2494732 polymorphisms in (a) breast cancer patients and (b) healthy controls.
Haplotype distribution of AKT1 rs1130214, rs1130233 and rs2494732 polymorphisms in breast cancer patients and healthy controls.

Abbreviation: SNPs, single nucleotide polymorphisms; OR, odds ratio; CI, confidence interval.
p value were calculated using Pearson’s chi-square test.
Bold values indicate statistically significant differences (p < 0.05).
In silico analysis of AKT1 rs1130233 SNP
The effect of the rs1130233 SNP on the secondary structure of mRNA was assessed using the RNAsnp online server. The results demonstrated that the rs1130233 variant did not alter the mRNA secondary structure of AKT1 (Figure 2). RNAsnp analysis of AKT1 rs1130233 SNP. Secondary RNA structure of c.726 G/A SNP in (a) wild-type and (b) mutant.
Discussion
Akt1 is one of the key nodes in the PI3K/AKT signaling pathway that regulates the expression of protein-coding genes by activating transcription factors such as NF-κB and FOXO, and thereby contributes to a wide variety of cancer-related biological processes. 14 A study has suggested that Akt1 promotes BC cell proliferation by upregulating cyclin D1 and S6 expression, but suppresses cell migration and invasion by downregulating β1-integrin and focal adhesion kinase (FAK) expression in IBH-6 and T47D human breast cancer cell lines. 22 Akt1 is also crucial for the G1/S phase transition of the cell cycle, and cells that lack it exhibit an attenuated proliferation and G1/S transition. 23 In 2014, Chen et al., reported that Akt1 leads to an increase in cell proliferation and promotion of colony formation in HepG2 and HCT 116 cell lines by overexpression of NF-κB and B cell lymphoma 2 (Bcl-2). 24 Moreover, they illustrated that enforced expression of Akt1 induces the migration and invasion of HepG2 cells, but it reduces the migration and invasion of HCT116 cells through altering the expression of matrix metalloproteinase 2 (MMP 2), MMP9, hypoxia-inducible factor 1-alpha (HIF1α) and vascular endothelial growth factor (VEGF) genes. 24 Another study has shown that Akt1 mediates migration of mammary epithelial cells by inducing the expression and secretion of C-X-C motif chemokine ligand 16 (CXCL16) and macrophage inflammatory protein 1 gamma (MIP1γ) chemokines. 25 Furthermore, activated Akt1 is involved in glucose metabolism by inhibiting GSK-3 isoforms through phosphorylation of GSK-3α at Ser21 and GSK-3β at Ser9. 26 Downregulation of AKT1 gene expression by transfection of AKT1-RNAi plasmid into the SMMC-7721 hepatocellular carcinoma cell line inhibits cell proliferation and survival, as well as enhances apoptosis by modifying the expression levels of phosphatase and tensin homolog (PTEN) and neurogenic locus notch homolog protein 1 (Notch 1) genes. 27 These data highlight that the altered level/function of Akt1 may be linked to the initiation and progression of human malignancies. SNPs have the potential to alter the expression level and function of Akt1, as they can impact transcription, pre-mRNA processing, nucleocytoplasmic export, subcellular localization, stability of mRNAs, translation rate, and protein activity depending on their genomic location. 28 Accordingly, several studies have already been conducted to assess the association between AKT1 SNPs and the risk of developing different types of cancer.16–21 Based on the literature review, no study has yet examined the possible association of AKT1 rs1130214, rs1130233 and rs2494732 SNPs with BC development. Hence, we hypothesized that these polymorphisms might be linked to a higher risk of BC. To test this hypothesis, for the first time, we investigated the genotypic and allelic association of AKT1 SNPs with BC genetic susceptibility in Iranian women under three different inheritance models including co-dominant, dominant, and recessive. The possible association between the studied SNPs and patients’ clinicopathological parameters was determined using logistic regression analysis. Haplotype and linkage disequilibrium analysis were performed for AKT1 SNPs based on the detected genotypes. We also used RNAsnp online server to predict the effect of rs1130233 SNP on local RNA secondary structure.
Regarding AKT1 rs1130214 SNP, we did not find any significant association between this SNP and BC development in any inheritance models (p > 0.05) (Table 3). Our findings are in line with a previous study that found no significant association between the rs1130214 SNP and the risk of developing PTC. 17 Maruei-Milan et al., conducted a study on 131 patients with PTC and 144 healthy subjects, and demonstrated that the rs1130214 SNP did not affect the susceptibility of individuals to PTC in Iranian population. 17 In another study, there was no significant association between rs1130214 SNP and the risk of NPC. 19 Similar data were reported by Li et al., who observed that the rs1130214 SNP was not significantly associated with the risk of brain metastasis in patients with NSCLC. 21 In contrast, a study has suggested that the rs1130214 SNP may contribute to the genetic risk of OSCC. 20 In the study conducted by Wang et al., on 182 OSCC patients and 207 healthy controls, they found that the rs1130214 SNP could predispose an individual to OSCC in Chinese Han Population. 20 For AKT1 rs1130233 SNP, it has a statistically significant association with the risk of BC under recessive inheritance model (p < 0.05). The presence of the T allele also conferred a higher risk of developing BC, up to 1.8-fold (OR: 1.877; 95% CI: 1.242–2.837; p = 0.003). Our findings are in line with those of previous studies that found significant associations between the rs1130233 SNP and the chance of cancer.16,17 In 2015, Piao et al., reported that rs1130233 SNP is associated with an increased risk of GC in Helicobacter pylori-negative individuals. 16 Maruei-Milan and colleagues investigated 131 PTC patients and 144 healthy subjects in a case-control study, and demonstrated that the rs1130233 SNP is linked to a 2.9-fold higher risk of developing PTC under recessive inheritance model. 17 Conversely, Li et al., found a statistically significant association between the rs1801133 SNP and reduced risk of HNSCC under dominant (CC vs CT + TT), and recessive (CC + CT vs TT) inheritance models. 18 They also revealed that the rs1130233 TT genotype reduces the progression of HNSCC in co-dominant inheritance model. 18 Another study found a similar result by investigating the possible association between the rs1130233 SNP and developing of NPC in 593 NPC patients and 480 healthy controls. 19 According to their report, there is no significant difference in the distribution of rs1130233 SNP genotypes between two groups. 19 Similarly, Wang et al., failed to find any significant association between the rs1130233 SNP and genetic susceptibility to OSCC in the Han population of China. 20 Furthermore, rs1130233 SNP was not found to be significantly linked to the risk of GC in another study. 29 For AKT1 rs2494732 SNP, a statistically significant 1.94-fold decrease in breast cancer risk was observed for rs2494732 TC genotype in co-dominant inheritance model (OR: 1.949; 95% CI: 1.073–3.539; p = 0.035). Li et al., found that the risk of HNSCC is lower for individuals with the AKT1 rs2494732 CC genotype. 18 Conversely, a study has shown that the rs2494732 CT/TT genotype is associated with a higher risk of brain metastasis in patients with NSCLC. 21 We also found that this SNP was not significantly related to BC susceptibility in dominant and recessive inheritance models (p > 0.05).
These results reflect those of Maruei-Milan et al., who indicated that the rs2494732 SNP is not involved in PTC pathogenesis. 17 Similarly, Zhang et al., reported that the rs2494732 SNP is not significantly associated with an increased risk of NPC. 19 Moreover, Wang et al., demonstrated that there is no evidence to suggest that rs2494732 SNP is associated with OSCC risk. 20 The lack of consistency in the results of studies makes it challenging to reach a consensus on the association between AKT1 rs1130214, rs1130233, and rs2494732 SNPs and cancer. Although the reason for these discrepancies is not yet fully understood, it can be explained in part by ethnic/racial disparities, differences in sample size and multifactorial nature of cancer. Therefore, further large-scale studies in diverse populations are needed to find conclusive evidence. The rs1130233 polymorphism may interfere with AKT1’s normal DNA repair function because of its critical role in DNA repair pathways. This could be done by decreased AKT1 expression or activity or by interfering with repair proteins. Uncontrolled proliferation and tumor formation can come from accumulated mutations caused by unrepaired DNA damage, some of which may arise in genes that regulate cell growth and division. Mutations and cumulative DNA damage are common in breast cancer cells. The rs1130233 may render cells more vulnerable, as evidenced by the correlation between the SNP and greater DNA damage. The rs1130233 further raises the risk of developing DNA damage and mutations by impairing AKT1-mediated DNA repair. Over time, this increased DNA damage and diminished repair capacity can elevate breast cancer risk. Therefore, the AKT1 rs1130233 polymorphism may increase breast cancer risk by contributing to increased DNA damage and potentially impairing the DNA repair process.
In conclusion, our findings provide the first evidence that AKT1 rs1130233 SNP is strongly linked to a higher risk of BC. Furthermore, the CTC haplotype, as a risk factor, can be used to identify those with a genetic susceptibility to BC. Despite that, there were two limitations in the current study. (1) The present work was conducted on the limited sample size of breast cancer patients and large-scale studies in different populations will be needed to confirm the potential link between AKT1 SNPs and breast cancer susceptibility. (2) Some characteristics, such as age and BMI, are statistically significantly different between breast cancer patients and healthy controls, which may have been confounding factors and could have affected the results. (3) Our study is unable to detect the molecular mechanisms by which the AKT1 rs1130233 SNP and CTC haplotype causes breast cancer. So, more work is needed to fully comprehend these molecular mechanisms.
Recommendations for future research
Future research should consider multivariate adjustment for Body Mass Index (BMI) and age in the analysis of the association between identified SNPs and breast cancer risk. This will strengthen the robustness and reliability of the observed associations, providing a more accurate understanding of the independent contribution of these genetic variants to breast cancer susceptibility. Larger sample sizes and comprehensive multivariate analyses are needed to validate and extend the findings.
Footnotes
Acknowledgments
Authors would like to express their sincerest appreciation to all subjects for participating in this study.
Funding
The authors received no financial support for the research, authorship, and/or publication of this article.
Declaration of conflicting interests
The authors declared no potential conflicts of interest with respect to the research, authorship, and/or publication of this article.