
Abstract
Background
Patients diagnosed with HER2-positive breast cancer who do not respond to anti-HER2 therapies face unfavorable outcomes. Multiple resistance mechanisms have been described in the literature; however, further exploration at the protein level as well as gene level is necessary. The present study focuses on in vitro elucidation of differentially expressed proteins (DEPs), gene expression profiling, and hotspot HER2 and PIK3CA alterations underlying the resistance mechanisms.
Methods
SKBR3, a HER2-positive breast cancer cell line, was used to generate trastuzumab-resistant SKBR3/TR cells by treating with increasing concentrations of trastuzumab, followed by viability assays at each concentration. The cells viable at highest trastuzumab concentration were subjected to LC-MS/MS, immunohistochemistry (IHC), and ddPCR to evaluate differences in protein, gene expression profiling, and hotspot HER2 and PIK3CA alterations between the trastuzumab-resistant SKBR3/TR cells and sensitive SKBR cell line.
Results
Following the generation of trastuzumab-resistant SKBR3/TR cell lines, IHC analysis revealed significantly lower expression of the HER2 membrane receptor. ddPCR further identified PIK3CA hotspot mutations in these resistant cells. Comparative proteomic analysis by LC-MS demonstrated marked upregulation of Ras-related proteins, along with activation of DNA mismatch repair and ATM signaling pathways, compared to the sensitive SKBR3 cells. Additionally, proteins involved in trafficking pathways, including Proteasome subunit beta type-1, RAB 11, and Ras-related proteins, were significantly downregulated in the resistant cells.
Conclusion
Our findings indicate that resistance to trastuzumab in SKBR3/TR cells is mediated by alterations in the PI3K-AKT signaling pathway along with upregulation of Ras-related proteins and activation of DNA mismatch repair and ATM signaling pathways. These molecular changes constitute key mechanisms underlying trastuzumab resistance. Notably, the dysregulation of these pathways presents potential therapeutic targets, offering opportunities for the development of novel strategies aimed at overcoming trastuzumab resistance and enhancing treatment efficacy in HER2-positive breast cancer.
Keywords
Background
Breast cancer is the most commonly diagnosed cancer and the leading cause of cancer-related death in women worldwide. According to the World Health Organization (WHO), breast cancer accounts for approximately 2.3 million new cases and 685,000 deaths in 2020. 1 HER2-positive subtype of breast cancer, which constitutes approximately 10–15% cases of breast cancer, is characterized by overexpression of the human epidermal growth factor receptor 2 (HER2) protein which is a transmembrane protein that belongs to the HER family of receptor tyrosine kinases. HER2 amplification or overexpression leads to abnormal activation of signaling pathways, promoting uncontrolled cell growth and proliferation. 2
Trastuzumab, a monoclonal antibody targeting the HER2 receptor, has been widely used as a first-line therapy for HER2-positive breast cancer. It binds to the extracellular domain of the HER2 receptor, inhibiting downstream signaling and exerting anti-tumor effects. 3 Trastuzumab has significantly improved outcomes for patients with HER2-positive breast cancer, leading to increased survival rates and improved disease-free survival. 4 However, despite the initial efficacy of trastuzumab, many patients develop resistance to the drug over time, which remains a major clinical challenge in the treatment of HER2-positive breast cancer. The classifications of resistance to trastuzumab encompass various categories, such as modifications in the HER2 receptor, initiation of alternative signaling cascades, and alterations within the tumor microenvironment. 5 Nevertheless, the precise underlying mechanisms governing this phenomenon remains under explored.
In the present study, the primary objective was to identify differentially expressed proteins (DEPs) between trastuzumab-resistant and trastuzumab-sensitive SKBR cell line by analyzing the protein data obtained from liquid chromatography-mass spectrometry (LC-MS/MS). Hotspot PI3K mutations were also looked for in the sensitive and resistant cell line.
Objective
To investigate the underlying resistance mechanisms at the protein and gene levels in HER2-positive breast cancer patients who do not respond to anti-HER2 therapies, with the aim of identifying potential targets for improving treatment outcomes.
Material and methods
Cell line, culture, and reagents
SKBR3 cells obtained from NCCS, Pune, India, in the exponential growth phase were seeded in T25 flask with McCoy’s, 16600108 media containing 10% FBS (Himedia-RM10432) and 1% Pen-Strep antibiotic (Thermo Fisher-15140122). Trastuzumab (Roche) was dissolved at a stock concentration of 20 mg/mL. The concentrations and methods followed for generation of resistant cell line were selected based on previous reports by Qiang Zuo et al. 6 but with some modifications which included altered time and concentration of drug treatment and FBS concentration as we used the different cell line. For inducing resistance, (McCoy’s) media with FBS(5%) in the absence of Pen-Strep was supplemented initially with 20 ug/mL of recombinant humanized monoclonal HER2 antibody trastuzumab in mitotic phase of cells for 48 hours and then the cells were transferred to drug-free media for next 48 hours till the cells acquired 60–70% confluency. The process was continued for 11 months till the concentration reached 3200 ug/mL and the MTT and FACS assays were performed regularly. After the establishment of transient trastuzumab-resistant cell lines, SKBR3/TR cell lines were stored with 20 ug/mL of inhibitory dose in the freezing media. After freezing the cells for 45 days, the SKBR3/TR cells were revived and subjected to trastuzumab treatment again to confirm the transiently acquired resistance, with sensitive control SKBR3 cells used as a reference.
Resistance index (RI) via MTT assay
To assess the resistance index (RI) of SKBR sensitive and SKBR resistant cell lines, the MTT assay was done. The cells in the serum starved condition were inoculated into each well of a 96-well plate at a density of 3 × 10³ cells per well in triplicates. The cells were then exposed to gradients of drug concentrations for 48 h (0–2000 ug/mL) and MTT was performed. Cell viability was calculated using the following equation: (drug-supplemented OD - blank control OD)/(normal control OD - blank control OD) × 100%. To determine the survival rate as a function of drug concentration, the data was plotted using Origin 6.1 software, and the 50% inhibitory concentration (IC50) was calculated. The resistance index (RI) was determined by calculating the ratio between the IC50 value of SKBR3/TR resistant cells and SKBR3 sensitive cells.
Annexin V and PI staining for apoptosis
Apoptosis was detected with Annexin PI Apoptosis kit (BD-559763) as per manufacturer’s protocol. Cells were seeded into T25 culture flasks and grown for 24 hours. After 24 h, drug was administered in culture flasks with non-resistant SKBR3 and trastuzumab-resistant SKBR3/TR. After treatment with equimolar concentration of drug in both flasks for 48 hours, cells were trypsinized and washed with PBS. Immediately after washing, 1 x 10⁶ cells/ml were resuspended in a 1X binding buffer. The 100 ul of this solution with 1 x 10⁵ cells were transferred to a 5 mL culture tube and 5 ul (0.25 µg/mL) of Annexin solution and 5 ul (1 µg/mL) of PI solution were added. This step was followed by vortexing the cells and finally incubating cells for 15 minutes in the dark. Again, 400 ul of 1× buffer was added followed by flow cytometry within 1 hour of the experimental work. Flow cytometry analysis was performed on both trastuzumab-sensitive and resistant cell lines at varying concentrations of trastuzumab ranging from 20 to 3200 ug/mL. Cells were first gated on forward scatter (FSC) and side scatter (SSC) to exclude debris and non-cellular events. A single-cell gate was applied using FSC-A versus FSC-H to eliminate doublets. Next, a dual-parameter plot of Annexin V-FITC (X-axis) versus PI (Y-axis) was used to define cell populations. The following quadrants were set: • • • •
Compensation was performed using single-stained controls to account for spectral overlap, and gates were defined based on control samples. Data were collected from at least 10,000 events per sample, and results were averaged from three independent experiments.
Immunohistochemistry
For IHC, cells were collected in 15 mL falcon and then washed with 1X PBS. Then cell block was made. HER2 antibody from Sigma (SAB4500782) Rabbit Recombinant Monoclonal was used. Paraffin sections of 3–4 μm were deparaffinized, followed by heat-induced epitope-retrieval. After incubation with H2O2 blocking solution, sections were incubated with the primary antibody, followed by a biotinylated polyvalent secondary antibody F solution (Ultra View from Roche Ventana). Subsequently, sections were incubated with horseradish peroxidase-conjugated avidin-biotin complex, followed by 3,3-diaminobenzidine (DAB) and hydrogen peroxidase. To visualize the staining, sections were counterstained with hematoxylin and mounted with dibutyl phthalate polystyrene xylene (DPX).
HER2 IHC staining and scoring system
The HER2 status was evaluated using immunohistochemistry (IHC) staining. The scoring system followed the ASCO/CAP guidelines, with scores ranging from 0 to 3+. A score of 0 or 1+ was considered negative, 2+ was equivocal, and 3+ was considered positive for HER2 overexpression. To ensure accuracy, inter-rater reliability was assessed, with two independent pathologists scoring the slides. Any discrepancies in scoring were resolved through consensus. Positive controls (known HER2-positive tissues) and negative controls (known HER2-negative tissues) were included in each staining run to validate staining specificity and ensure reproducibility.
Screening of HER2 gene and PI3KC hotspot mutations
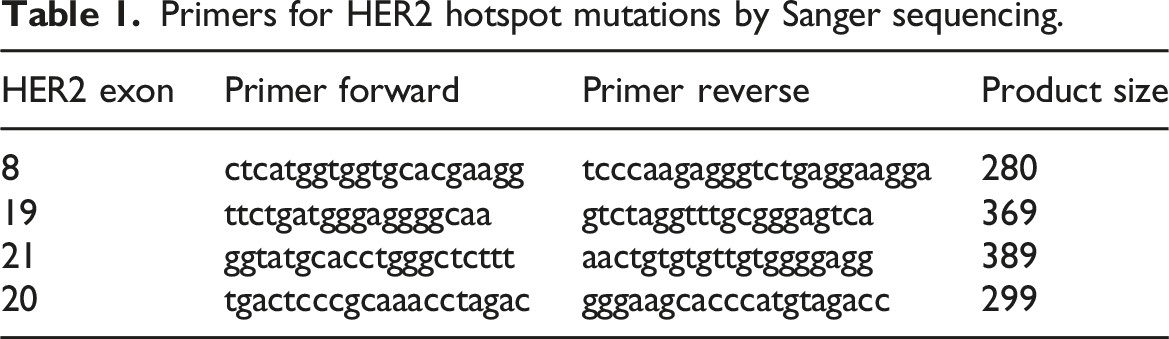
Primers for HER2 hotspot mutations by Sanger sequencing.
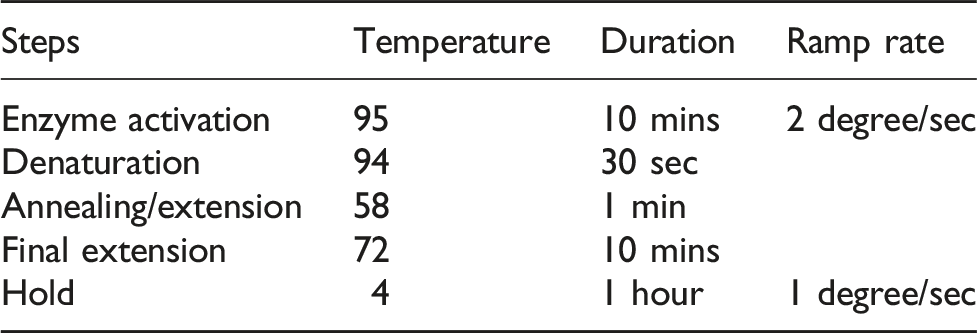
DNA extraction from cells: 5 × 10⁷ cells were collected in 15 mL falcon and then washed with 1X PBS. The promega DNA isolation kit (A2351) was used for the isolation of DNA. Extracted DNA was quantified with the help of nanodrop. ddPCR was used for screening PI3K hotspot mutations. Commercially available FAM/HAX probes for two hotspot mutations (H1047R and E545K) were used. Total reaction volume performed was 20 ul along with 10 ng (1 ul) of DNA extracted from cell lines, 10 ul ddPCR supermix, primers (FAM + HEX) 1 ul each, and deionized distilled water. Then for the droplet generation, 32-well cartridge was used in which 8 wells are from samples and 8 wells were from oil, then the cartridge was inserted into the droplet generator. The droplets generated were then transferred to the 96-well PCR plate and then were subjected to thermal cycler. The plate was then read using Bio Rad droplet reader prior to which droplets were incubated at 4°C for 2 hours. Quantasoft v1.4.0 was used for the data analysis.
Quality control measures
LC-MS/MS
Cells were washed with 1× PBS, mixed with 10 ul of protease inhibitor and 90 ul of hot 6 M GnHcl/0.1 M Tris pH 8.5 (Sigma) was added within 20 s of adding protease inhibitor, followed by vortex. Lysate was kept at 90°C for 10 minutes, followed by sonication and again an incubation at 90°C for 5 minutes. The lysate was centrifuged at 15000 rpm for 20 minutes, supernatant was collected in a fresh tube, and pellet was discarded. From the final supernatant, 25 μg was taken and 10 millimolar DTT (Thermo Scientific) was added and incubated at 37°C for 45 minutes in the dark. Iodoacetamide (50 millimolar; Sigma) stock was added and again incubated at 37°C for 45 minutes in the dark. Finally, the sample was diluted 10 times and 80 ul of water was added to 20 ul of sample. Trypsin was added to diluted samples (2 ug/ul) and kept at 37°C for 16 hours. To the trypsinized sample, 2 ul of 10 % TFA was added and the sample was submitted for LC-MS/MS. Total protein was measured with the help of a spectrophotometer and then run on the system.
Protein identification and filtering
Proteins were identified using a standard LC-MS/MS workflow, with raw data processed through a proteomics software, that is, Proteome Discoverer to match peptide spectra to protein sequences from a reference database. For filtering, proteins with at least two unique peptides were considered for further analysis to ensure robust identification. Proteins showing a fold change of ≥2.0 or ≤0.5 between the trastuzumab-resistant and sensitive cell lines were considered differentially expressed. To ensure statistical significance, a false discovery rate (FDR) threshold of ≤0.01 was applied, along with p-value generated using ANOVA to account for variability. Mutual exclusivity of proteins was assessed by comparing the expression patterns across resistant and sensitive cells. Proteins were considered mutually exclusive if they exhibited significant differential expression in one condition (resistant cells) but were either absent or showed no significant change in the other condition (sensitive cells).
Pathway analysis
For the prediction of biological pathways, KEGG ID mapping and run in enricher were performed. The proteins with significant more than 2-fold change (resistant and sensitive SKBR) were submitted to the KEGG and enricher website for pathway analysis. Selected enriched pathways were statistically significant with p < .05.
Statistical analysis
One-way ANOVA and unpaired t test were used for statistical analysis. SPSS 13.0 was the software used, and p values less than 0.05 were considered statistically significant. All data were represented as the mean of triplicate samples.
Results
Generation of trastuzumab resistance SKBR3 (acquired resistance) and resistant index
The half-maximal inhibitory concentration (IC50) of trastuzumab for SKBR3 cells was determined by performing a cell viability assay using MTT. Although anti-proliferative effects of trastuzumab have been reported at 0.5 µg/ml, a stabilizing concentration of 10 µg/ml was selected for the generation of trastuzumab-resistant SKBR cells (Figure 1). The selection of trastuzumab concentrations ranging from 10 μg/mL to 3200 μg/mL was selected based on previous studies that demonstrated the clinical significance of these concentrations. The higher concentrations reflected the increased exposure that might occur during prolonged treatment or under specific experimental conditions aimed at inducing resistance. This rationale was supported by published literature, such as Zuo et al.,
7
which highlighted the relevance of these concentrations in modeling therapeutic resistance in vitro. Thus, the chosen concentrations were grounded in their clinical importance and established efficacy in prior research. Initially, the cells were exposed to a concentration of 10 µg/ml trastuzumab for the first 20 days, after which the dose was increased to 20 µg/ml. Subsequently, the cells were grown in trastuzumab-free media for 48 hours before the concentration was exponentially increased to 100 µg/ml, 200 µg/ml, 400 µg/ml, 800 µg/ml, 1600 ug/mL, and finally 3200 µg/ml. The exponential increase in trastuzumab concentration was performed to ensure that the cells were continuously exposed to increasing levels of trastuzumab, which is known to promote the development of resistance. This gradual escalation mirrors the clinical development of resistance by allowing sufficient time for the selection and adaptation of resistant subpopulations. At each concentration step, viability assays were conducted to confirm that cells remained viable under increasing drug pressure, ensuring a robust model of resistance development. The cells were cultured at each concentration of trastuzumab for 10 days before increasing the dose to the next concentration. During this time, the parental cell lines were maintained without treatment to preserve their drug sensitivity, allowing them to serve as procedural controls Morphological changes of SKBR3 treated with (A) 20μg/ml; (B) 400μg/ml; (C) 1600μg/ml and (D) 3200μg/ml of trastuzumab.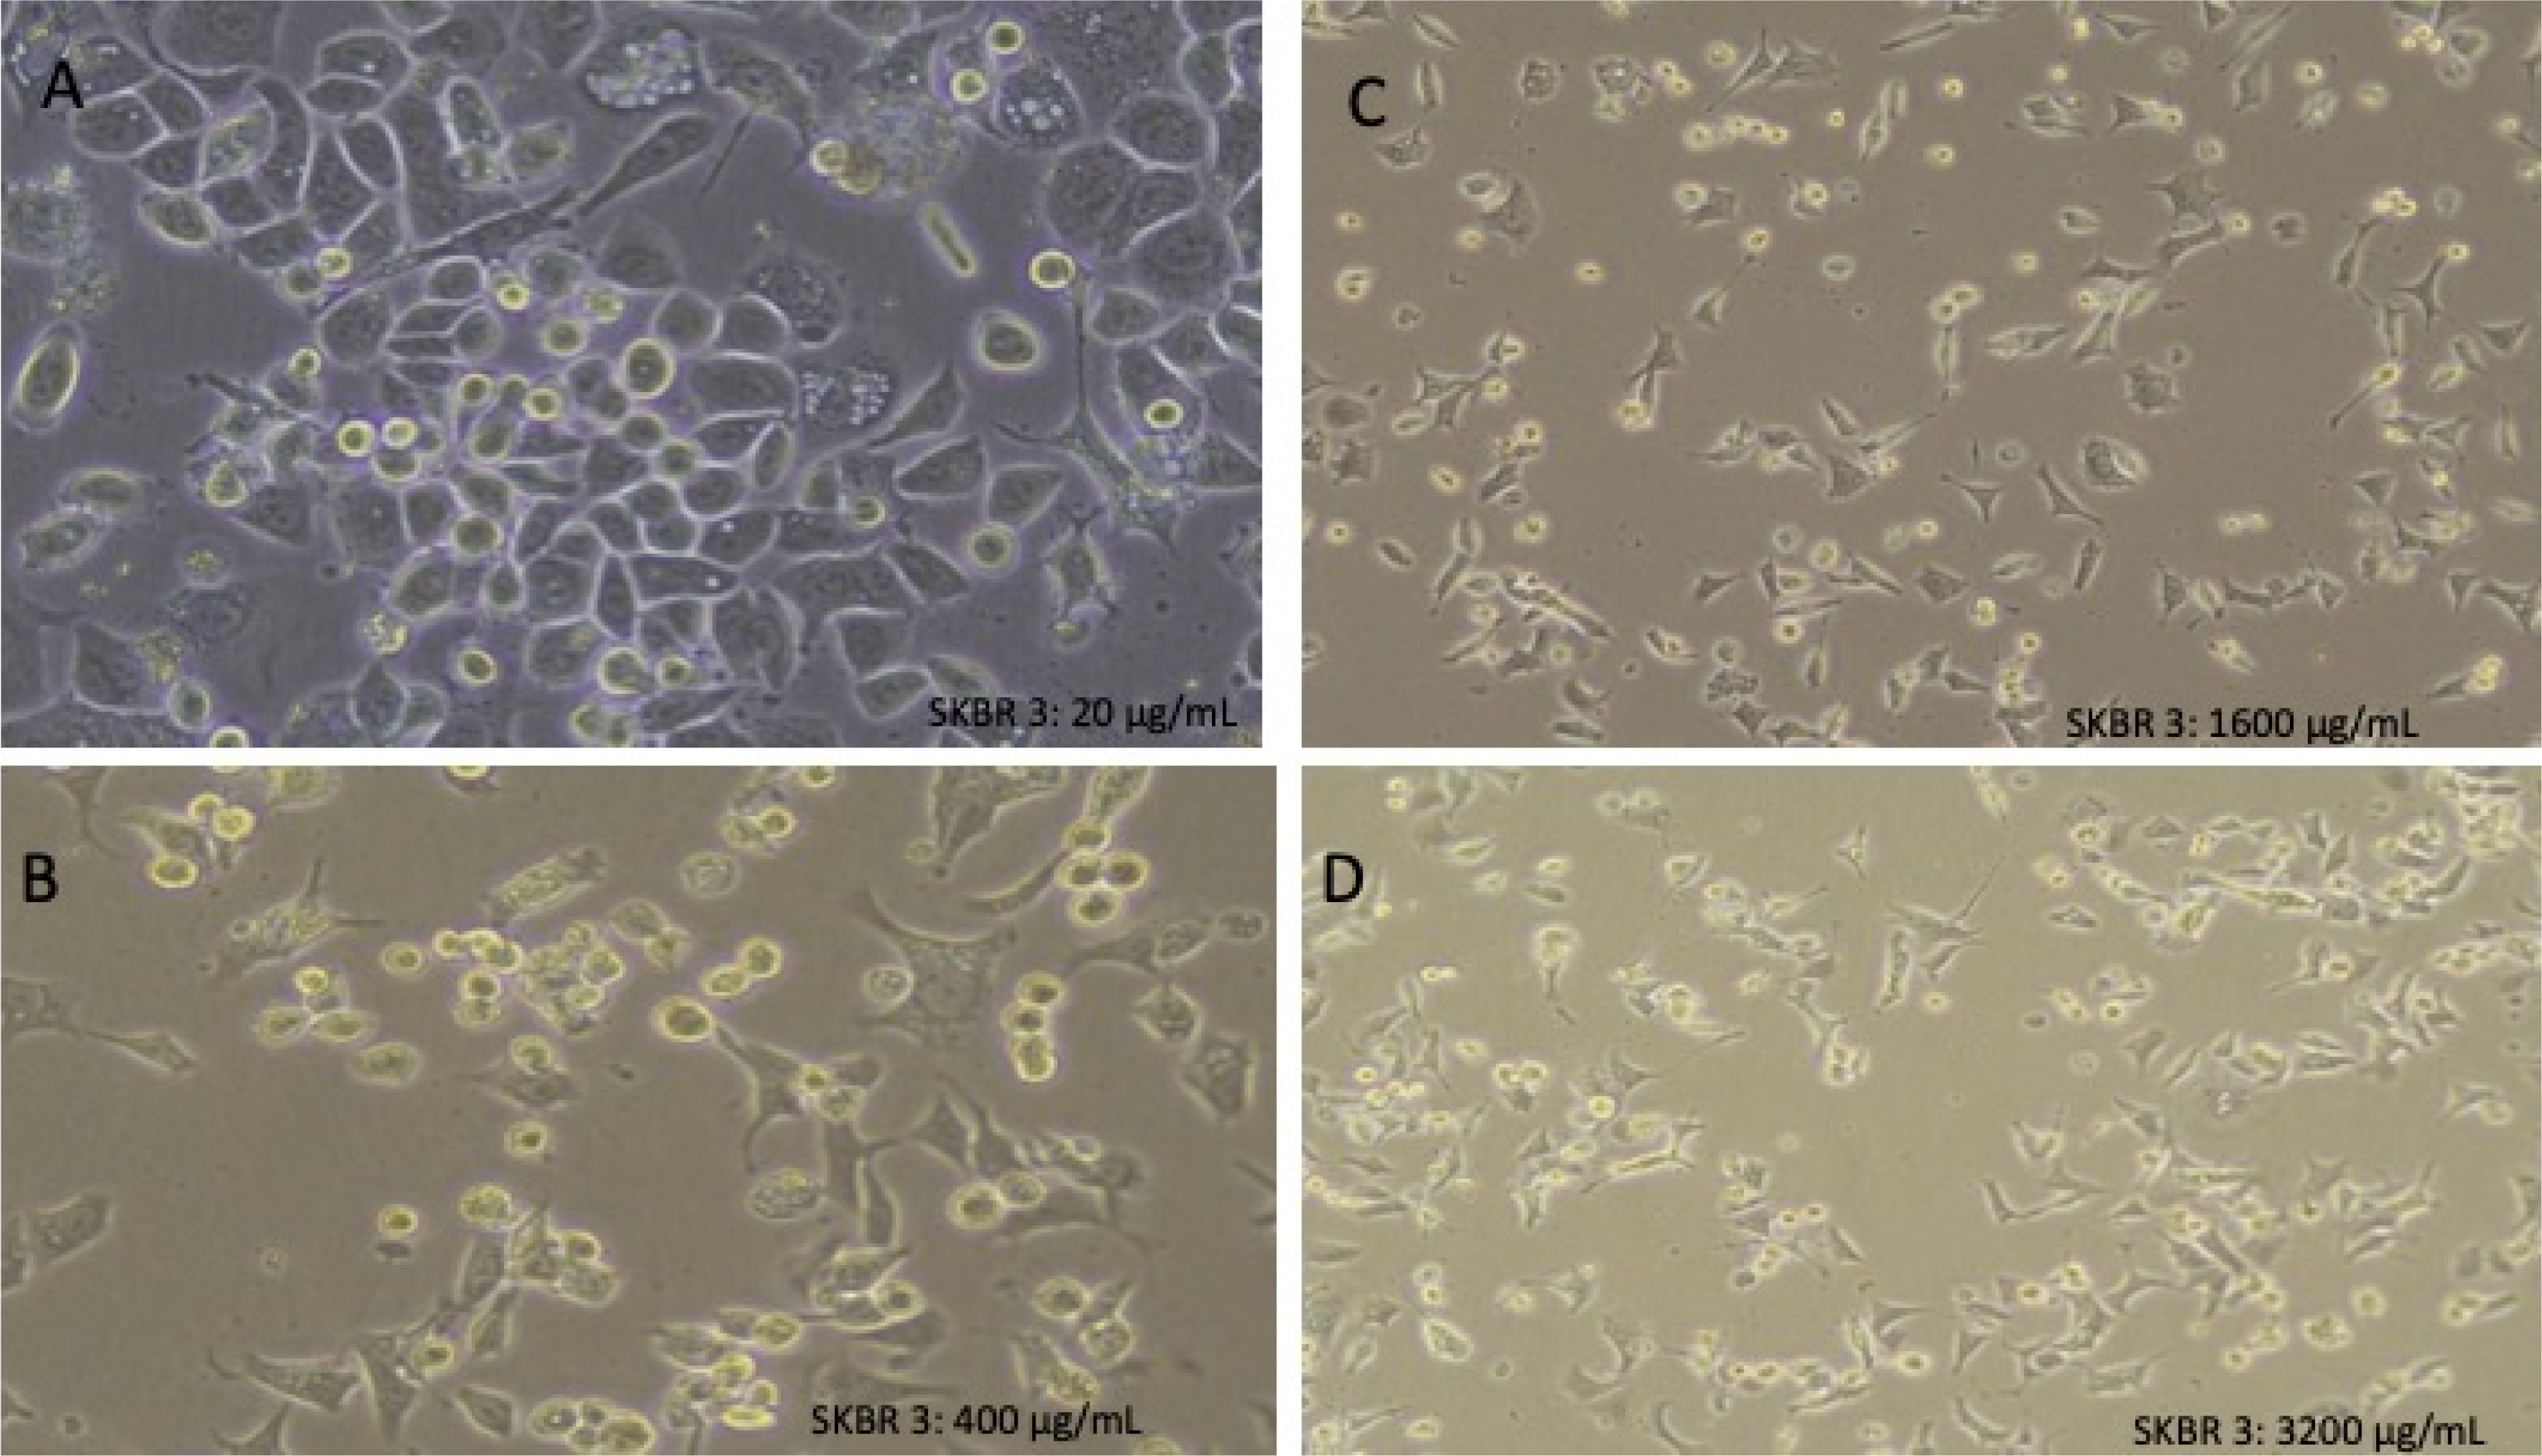
To confirm the morphological changes such as reduced cell size, altered shape, and tapered ends observed in trastuzumab-resistant SKBR3 cells, a parental SKBR3 cell line was grown simultaneously without any trastuzumab treatment (Figure 1). This control cell line ensured the maintenance of sensitivity to trastuzumab and provided a reference or control for comparison with the SKBR3/TR cell lines.
Resistant index = IC50 (resistant) / IC50 (sensitive). Given that the IC50 for the resistant SKBR cell line is 254 μg/mL and the IC50 for the sensitive SKBR3 cell line is 22 μg/mL, the resistant index of the cell line was 11.54.
Apoptosis assay
Results revealed that a difference in cell death was first observed at the 400 ug/mL concentration (Figure 2. A: Resistant, Figure 2. B: Sensitive). At this concentration, average cell death in SKBR3/TR and sensitive SKBR3 was 2.01% and 9%, respectively. As the concentration was increased to 3200 ug/mL, the average cell death was observed to be 3.083% and 17.4% in SKBR3/TR and sensitive SKBR3, respectively. It was found that the resistant cell line exhibited significantly lower levels of apoptosis compared to the sensitive cell line at similar drug concentrations. Comparison of Annexin/PI staining results by FACS analysis in resistant SKBR3/TR (a) and sensitive SKBR3 (b) with box plot (c).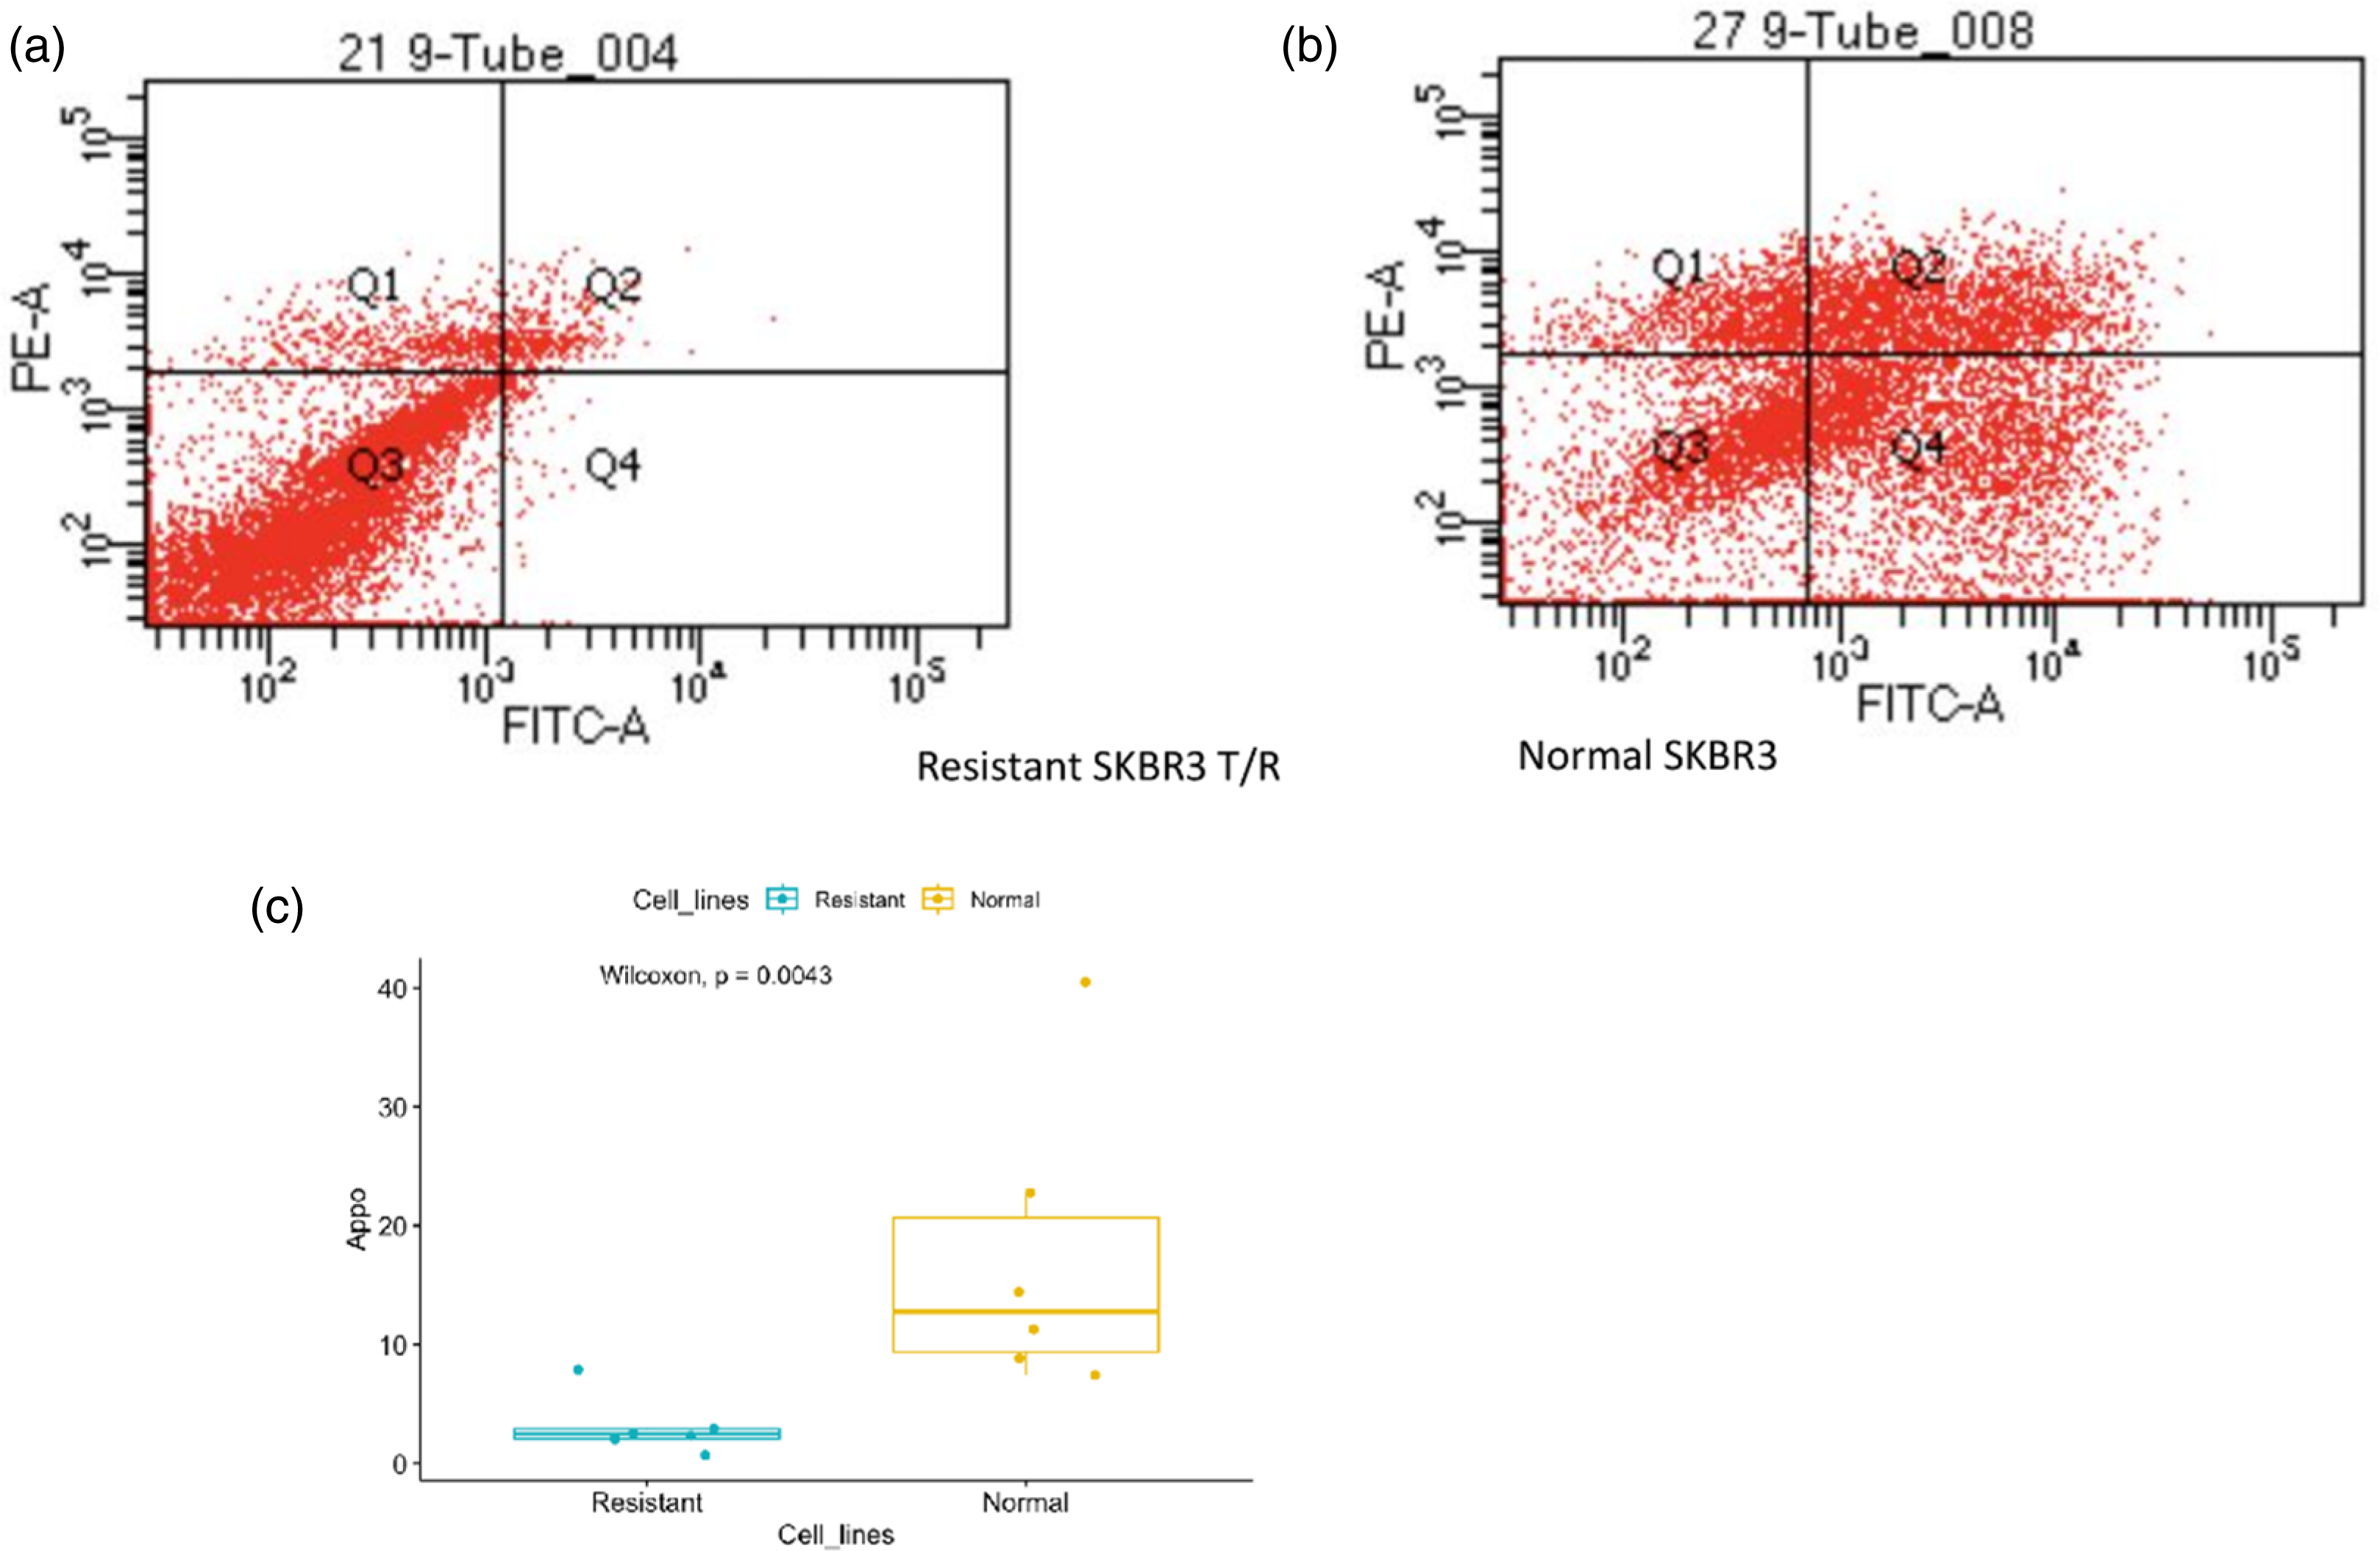
Expression analysis by IHC
Results revealed a reduced expression of HER2 (1+) in the resistant cell line in comparison to the sensitive SKBR3 cell line (HER2 3+) (Figure 3). Immunohistochemical (IHC) analysis of HER2 expression in trastuzumab-resistant SKBR3/TR (b) and sensitive SKBR3 (a).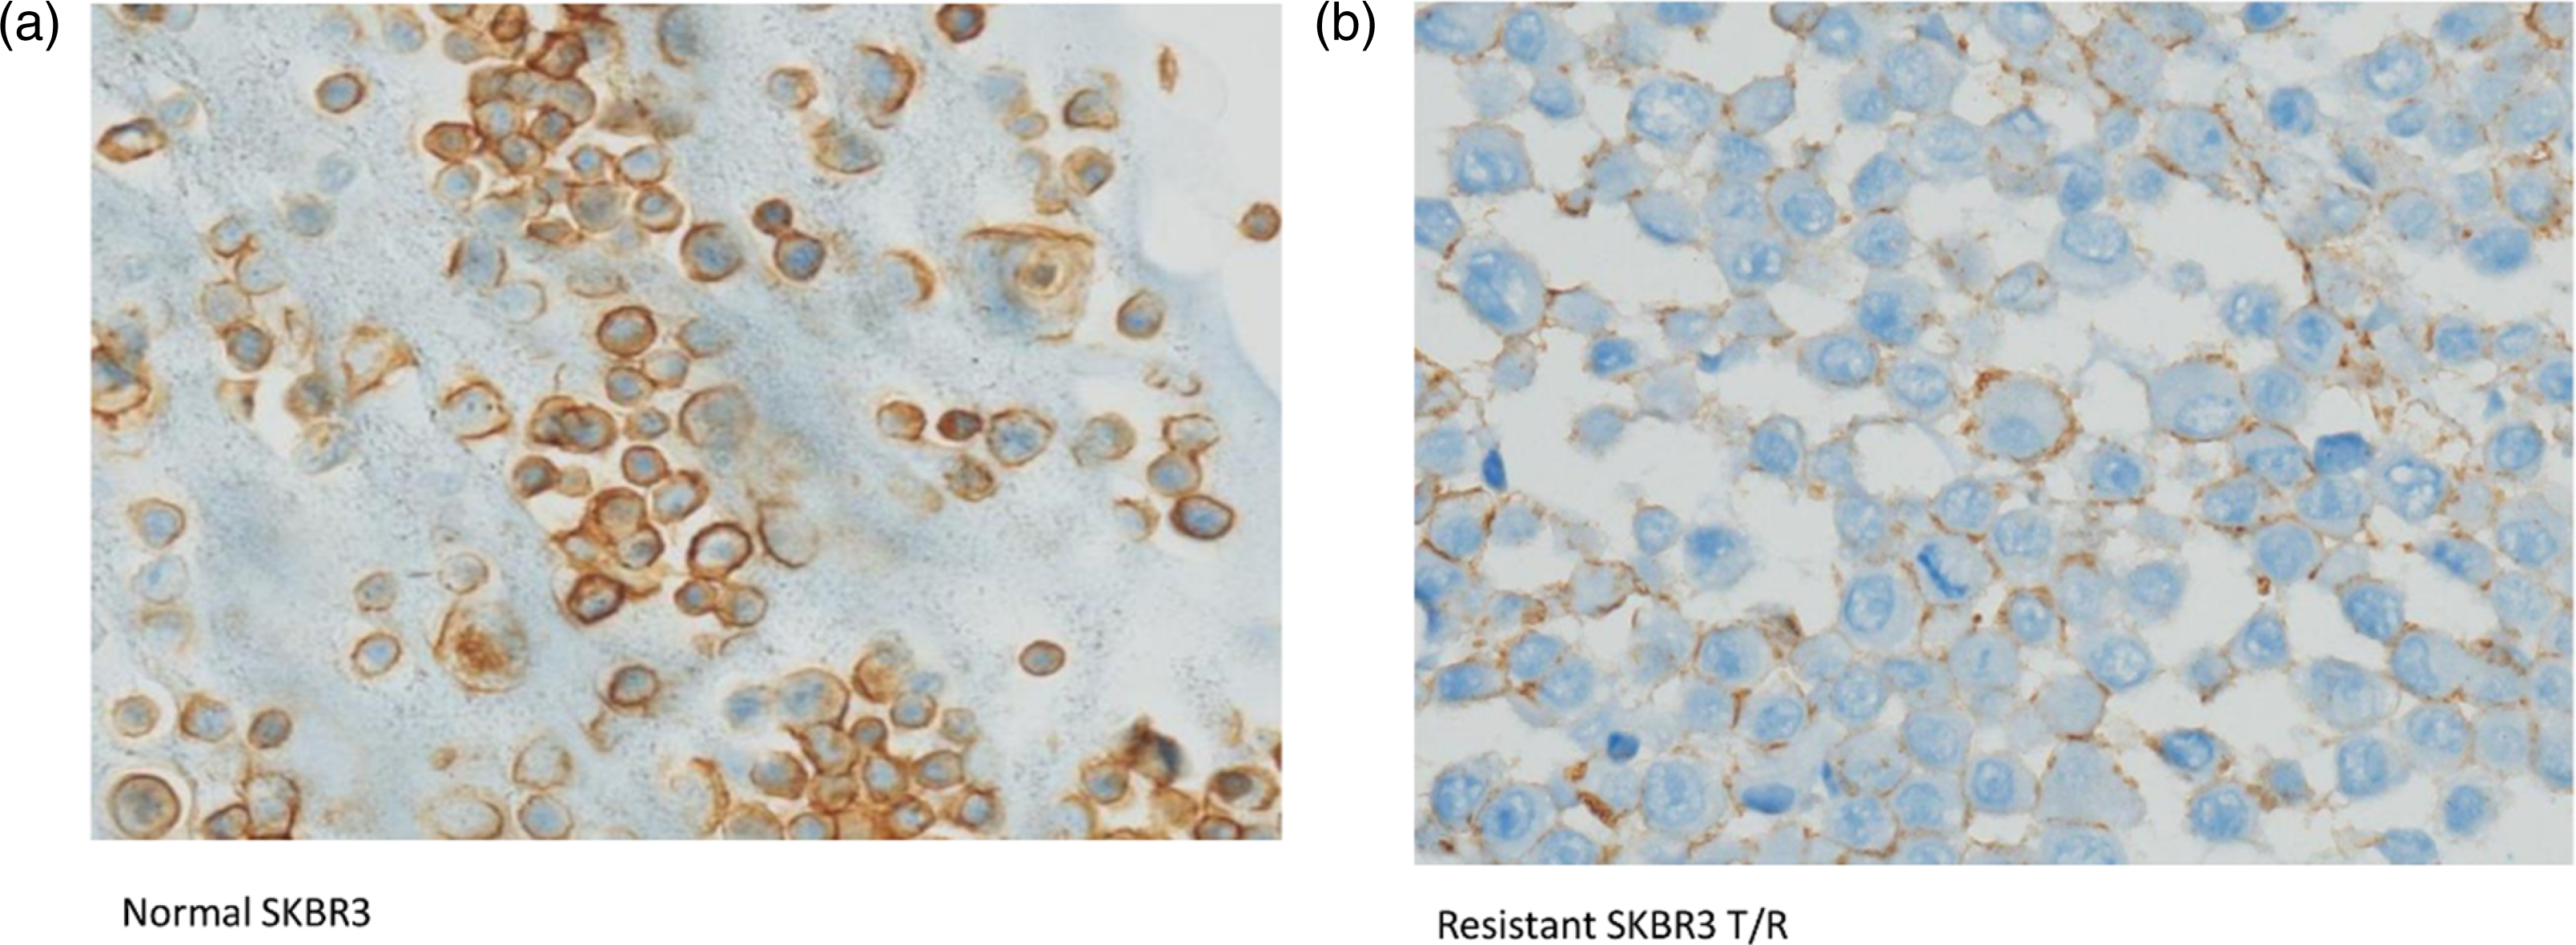
HER2 gene and PI3KCA hotspot mutations
The H1047R mutation was found at a rate of 2.2 copies/ul in the resistant cell line, while only 0.2 copies/ul were found in the sensitive cell line. Similarly, the E545K mutation was detected at an allelic frequency of 2.7 copies/ul in the resistant SKBR3/TR, but only 1.1 copies/ul in the sensitive SKBR3. No hotspot mutations in HER2 gene were noted in exon 8, 19, and 20 (Figure 4). Representative dd-PCR profile of PIK3CA mutation (a) positive in resistant SKBR3T/R (b) negative in Normal SKBR3 (c, d) negative controls.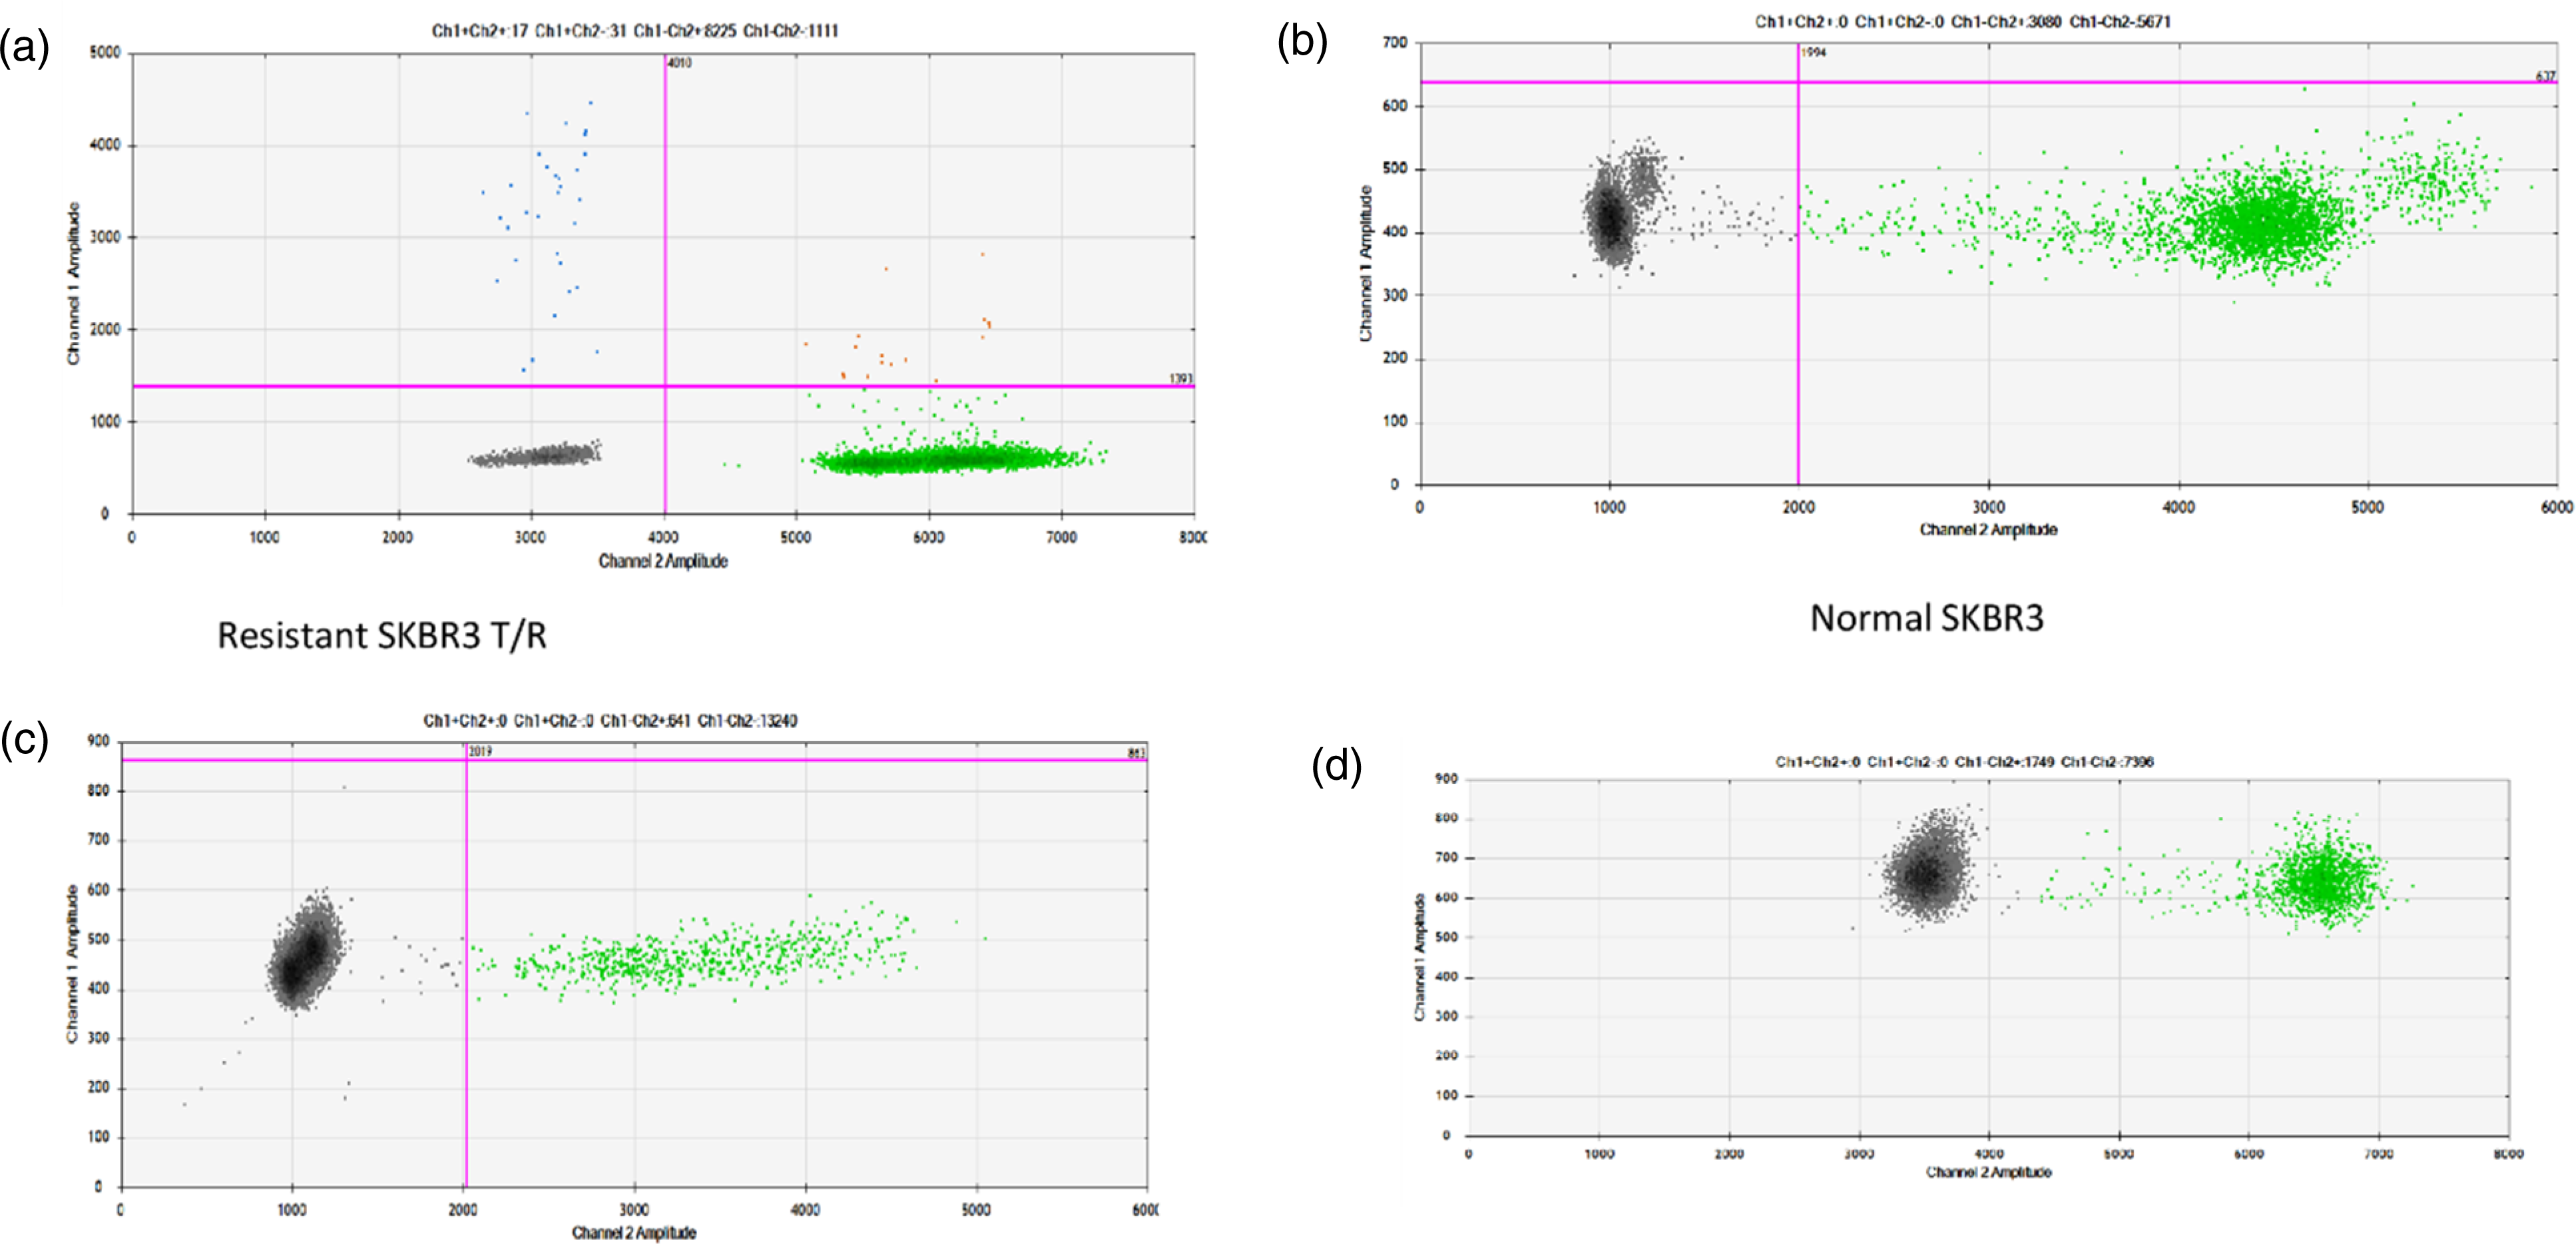
Comparative proteomic analysis by LC-MS
LC-MS/MS was performed on the resistant SKBR3/TR as well as sensitive SKBR3 cell lines. A total 1846 proteins were found after the comparative analysis by protein discoverer and the fold change was calculated by the same software. Heat map shows multiple upregulated and downregulated proteins in both the cohorts (Figure 5(a)). Out of 1846 proteins, only 170 were found mutually exclusive proteins in trastuzumab-resistant SKBR3/TR cell lines and majority of these proteins were involved in cell cycle, programmed cell death as well as metabolic pathways that supports increased cell growth and 117 were only found in sensitive SKBR cell lines (Figure 5(b)). After plotting the volcano plot (Figure 5(c)), proteins with more than 2-fold increase and more than 2-fold decrease in expression were selected for the functional annotations. The upregulation of several proteins such as cytochrome C oxidase ATP synthase subunit, ATP synthase subunit beta, and DNA mismatch protein in the trastuzumab-resistant SKBR3/TR cell line was observed.
The functional annotation of the data obtained from LC-MS/MS showed that a substantial proportion of the elevated proteins are implicated in the ATM signaling network, as well as in processes concerning DNA mismatch repair and DNA damage response. These upregulated proteins suggest their potential involvement in trastuzumab resistance mechanisms. The downregulation of proteins such as cytochrome b-c1 complex, isocitrate dehydrogenase [NAD] subunit alpha, and mitochondrial import receptor subunit associated with carbohydrate metabolic pathways was noted in the trastuzumab-resistant SKBR3/TR cell line. This downregulation may indicate alterations in metabolic processes that contribute to the development of resistance.
String analysis and functional annotation
PPI network analysis was performed to identify structural proteins related to Ras function. The analysis was carried out using the STRING and enricher database, and the results revealed functional partners of RRAS which included important proteins like GRB2, MAP2K1, and EGFR. These proteins were found to have high correlation scores, with values ranging from 0.99 to 0.999.
Conclusions
Overexpression of HER2 protein is associated with poor prognosis and overall survival. 8 Trastuzumab is the first targeted treatment approved as first-line therapy in combination with chemotherapy for HER2-positive breast cancer. 9 It has significantly improved the survival of metastatic breast cancer patients. Despite initial favorable response to trastuzumab combined with chemotherapy in patients with HER2 overexpression, most patients develop resistance within 1 year. Therefore, it is important to investigate the mechanisms of resistance and identify biological markers that can predict the effectiveness of trastuzumab.
Proteomic analysis can aid in early detection of markers for breast cancer at baseline and screening of proteins related to metastasis which are considered the regulators of cell behavior. Compared to genes, proteins are more dynamic indicators that enable accurate diagnosis and monitoring of disease progression. Numerous studies have leveraged proteomics to advance the understanding of breast cancer pathogenesis, identify biomarkers, determine prognosis, identify therapeutic targets, and predict treatment outcomes. 10 In the present study, we focused on identifying differentially expressed proteins in acquired trastuzumab-resistant SKBR3/TR and sensitive SKBR3 cell line.
The trastuzumab-resistant cell line was generated by continuously increased exposure of trastuzumab for 11 months. The trastuzumab-resistant cells exhibited slower growth compared to the normal SKBR cells. Morphologically, the resistant cells were different and had more tapered ends and shrunken cytoplasm compared to the normal cells. Apoptosis assay suggested that the trastuzumab-resistant SKBR3/TR acquired a mechanism to evade the drug-induced apoptosis. The probable molecular mechanism that may contribute to the development of trastuzumab resistance is the downregulation of HER2 expression on the cell surface which was also noted on immunohistochemistry of resistant cells. The proposed molecular mechanisms responsible for the reduced expression of HER2 after trastuzumab treatment include antibody-mediated receptor internalization.11,12
Other resistance mechanisms can be the activation of alternative signaling pathways, or mutations in genes involved in the HER2 pathway. Our study identified higher allelic frequencies of hotspot PIK3CA mutations in trastuzumab-resistant SKBR3 cells. However, no HER2 hotspot mutations were noted in sensitive and resistant cell lines. These mutations in PIK3CA, including clinically documented variants such as E545K and H1047R, are well-known for their role in activating the PI3K/AKT signaling pathway, contributing to therapeutic resistance. While these mutations are clinically validated and frequently associated with resistance to HER2-targeted therapies, their specific functional impact on downstream signaling pathways in the context of trastuzumab resistance was not directly evaluated in this study.
LC-MS/MS data revealed several differentially expressed proteins (DEPs) in trastuzumab-resistant SKBR3/TR and trastuzumab-sensitive SKBR3 cell line (supplementary sheet 1). The augmented expression of proteins related to the ATM signaling network, DNA mismatch repair, metabolic reprogramming, DNA damage response, and fatty acid pathways within resistant cell lines holds paramount significance in understanding drug resistance mechanisms. The upregulation of these proteins indicates a potential adaptive response to counteract drug-induced damage, facilitating cell survival and proliferation despite treatment challenges. Enhanced ATM signaling components contribute to DNA damage sensing and repair, conferring resistance by mitigating drug-induced DNA damage13–15 Elevated DNA mismatch repair proteins aid in rectifying DNA lesions induced by treatments, thwarting drug cytotoxicity. 16 Moreover, metabolic reprogramming, involving altered energy utilization and biosynthesis, sustains cell survival and growth under adverse conditions, fostering resistance mechanisms.15,17 Additionally, heightened fatty acid metabolism fuels energy production and contributes to membrane synthesis, supporting the survival and proliferation of resistant cells. 18 Ras-related proteins which are known to regulate essential cellular processes such as cell proliferation, survival, and migration were upregulated in the resistant cell lines compared to the sensitive cell line, with a fold change of 5.26. 19 Their overexpression has been associated with cancer progression and drug resistance. The drug resistant-associated protein from a family of transporters that plays a crucial role in drug efflux, pumping drugs out of cancer cells showed upregulation in the resistant cell lines with a fold change of more than 2.0, thus contributing to drug resistance 20 Understanding the overexpression of these pathways sheds light on potential targets for overcoming drug resistance in cancer therapy.
The downregulation of Proteasome subunit beta type-1 and RAB 11 protein has been observed in trastuzumab-resistant SKBR3/TR cell line. Downregulated RAB proteins in breast cancer contribute to resistance against treatments by altering intracellular trafficking pathways, hindering drug delivery to target sites.
21
This dysregulation impairs vesicle transport, reducing drug efficacy and promoting survival of cancer cells. These DEPs play significant roles in cancer progression and drug resistance, and their interrelationships provided insights into the mechanisms underlying trastuzumab resistance. In addition to the STRING analysis for identifying functional partners, further pathway analysis using tools Reactome provided more detailed insights into the biological processes involved. The data highlights key pathways such as “signaling by BRAF mutants” and “GTPase cycle,” indicating areas where Ras may have significant biological roles. By incorporating these advanced pathway analyses, deeper functional implications of Ras-related signaling can be uncovered, aiding in more targeted research and therapeutic strategies (Figure 5(e)). (a) Heat map of differential protein expressed in Sensitive SKBR3 and trastuzumab SKBR3/TR, (b) Exclusive proteins expressed in sensitive SKBR3 and resistant SKBR3/TR, and (c) volcano plot depicting protein fold change. (d) Representation of a bar graph illustrating the overexpressed genes contributing to specific biological pathways.
In conclusion, the probable molecular mechanisms associated with trastuzumab resistance include the downregulation of HER2 expression after trastuzumab treatment and increase in variant allele frequency of hotspot PI3K mutations leading to activation of alternative pathways. Targeting these pathways could provide a potential therapeutic strategy for overcoming trastuzumab resistance. For instance, ATM inhibitors or PI3K pathway inhibitors might sensitize resistant cells to trastuzumab, offering a rational approach for combination therapies. Incorporating these strategies in preclinical studies would provide a strong foundation for their potential clinical application. The study has also identified several proteins exhibiting both unregulated and downregulated states, which potentially play a role in the mechanisms underlying resistance.
However, this study is limited by experiments done on only one HER2-positive cell line. Still the data offers valuable insights into the molecular alterations in resistant cells, and the mechanistic underpinnings of trastuzumab resistance warrant further exploration. Future studies focused on elucidating the functional roles of the dysregulated proteins identified in our analysis are required to understand their contribution to resistance. To strengthen the clinical relevance of findings, validation in patient-derived xenograft (PDX) models or clinical samples is essential. Such validation would help confirm the significance of the identified proteomic changes in a more physiologically relevant context, bridging the gap between in vitro observations and real-world applicability. 22 Ultimately, these efforts could lead to the development of more effective treatment regimens for HER2-positive breast cancer patients who develop resistance to trastuzumab.
Supplemental Material
Supplemental Material - Comparative proteomic landscape, gene expression profiling and hotspot HER2 and PIK3CA alterations in trastuzumab-sensitive and resistant HER2-positive breast cancer cell line
Supplemental Material for Comparative proteomic landscape, gene expression profiling and hotspot HER2 and PIK3CA alterations in trastuzumab-sensitive and resistant HER2-positive breast cancer cell line by Tamanna Thakur, Shalmoli Bhattacharyya, Ashim Das, Ishita Laroiya, Rajender Kumar, and Amanjit Bal in breast disease
Statements and declarations
Footnotes
Author contributions
Conception: Dr Amanjit Bal.
Interpretation of data: Dr. Amanjit Bal, Tamanna Thakur, Dr Shamlmoli Bhattacharyya, Preparation of manuscript: Dr. Amanjit Bal, Tamanna Thakur, Dr Ishita laroiya, and Dr Ashim Das.
Revision for important intellectual content: Dr. Amanjit Bal, Tamanna Thakur, Dr. Rajender Kumar, and Dr. Shalmoli Bhattacharyya.
Supervision: Dr Amanjit Bal, Dr Shalmoli Bhattacharyya, and Dr Ashim Das.
Declaration of conflicting interests
The author(s) declared no potential conflicts of interest with respect to the research, authorship, and/or publication of this article.
Funding
The author(s) received no financial support for the research, authorship, and/or publication of this article.
Ethical approval
The study was approved by the institutional Ethics Committee and Postgraduate institute of Medical Education and Research, Chandigarh, vide letter no NK/7508/PhD/231.
Supplemental material
Supplemental material for this article is available online.
References
Supplementary Material
Please find the following supplemental material available below.
For Open Access articles published under a Creative Commons License, all supplemental material carries the same license as the article it is associated with.
For non-Open Access articles published, all supplemental material carries a non-exclusive license, and permission requests for re-use of supplemental material or any part of supplemental material shall be sent directly to the copyright owner as specified in the copyright notice associated with the article.