
Abstract
Obesity significantly contributes to declining serum testosterone levels in men, with chronic inflammation being a crucial potential mechanism; Clinical research evidence directly supporting this pathway remains limited. We investigated how obesity relates to serum testosterone in males, with particular attention to the intermediary role of chronic inflammation. Our study included adult males aged ≥20 years from the National Health and Nutrition Examination Surveys (NHANES) conducted from 2011 to 2016 and from 2021 to 2023. Obesity status was assessed with body mass index (BMI), body roundness index (BRI), and waist circumference (WC). Chronic inflammatory status was assessed with an aggregate index of systemic inflammation (AISI), systemic immune-inflammation index (SII), and systemic inflammation response index (SIRI). Multivariable regression assessed associations between obesity metrics and testosterone. The indirect influence of inflammatory indicators was assessed through mediation analysis. Subgroup analyses were performed by weight status. The study comprised 7,418 participants. Multivariable linear regression revealed that obesity (BMI, WC, BRI) was negatively associated with male serum testosterone. Generalized additive models indicated a nonlinear relationship, showing a clear inverse association. Chronic inflammatory status (SII, SIRI, and AISI) mediated the association between obesity and male serum testosterone. In subgroup analyses, the association was consistent with overall findings, but the mediating effect of chronic inflammatory status was statistically significant only in the group with obesity (BRI ≥4.5, WC ≥102 cm, and BMI ≥30 kg/m2). Obesity was inversely associated with serum testosterone in adult males. Chronic inflammatory status may partly explain this association, particularly among individuals with obesity.
Introduction
Serum testosterone is essential for sustaining male reproductive development, sexual performance, and psychological well-being (Su et al., 2022). In recent years, with the deepening of testosterone research, the significant roles of serum testosterone in the maintenance of muscle mass (Shin et al., 2018), regulation of bone density (Snyder et al., 2017), cardiovascular health (Elagizi et al., 2024), and cognitive function (Resnick et al., 2017) have gradually been revealed. Epidemiological studies indicate that, with lifestyle changes and an aging population, the decline in testosterone levels among adult males has become increasingly common (Travison et al., 2007). Reduced testosterone levels have been associated with multiple health risks, including sexual dysfunction, metabolic syndrome, and depression, among others (Halpern & Brannigan, 2019). This highlights the clinical significance of serum testosterone.
Obesity is a global health challenge. The 2025 World Obesity Atlas projects that, without effective interventions, nearly 3.3 billion adults, about half of the global adult population, will be overweight or have obesity by 2035 (World Obesity Federation, 2025). Obesity is not only closely associated with various chronic comorbidities but represents a major contributing factor to the decline in serum testosterone levels (Biernikiewicz et al., 2025). Numerous epidemiological studies have demonstrated that obese men may experience a decline in testosterone levels (Dhindsa et al., 2022; Eriksson et al., 2017). For example, Guo et al. (2025) reported that 15 obesity and lipid-related indices, including Body Mass Index (BMI), Body Roundness Index (BRI), Waist Circumference (WC), and the triglyceride-glucose index, are negatively associated with serum testosterone levels in patients with testosterone deficiency. Consistent with these results, multiple studies have reported inverse associations between BMI, WC, and serum testosterone levels (Dhindsa et al., 2010; H. Ma et al., 2024; Wang et al., 2024). Evidence suggests that obesity can lead to chronic inflammation (Craveiro et al., 2025). One potential mechanism is that excessive adipocyte hypertrophy in individuals with obesity induces endoplasmic reticulum stress, mitochondrial dysfunction, and tissue hypoxia, which in turn activate inflammatory pathways (Hotamisligil, 2006; Lee & Olefsky, 2021). This process may subsequently affect the function of the hypothalamic-pituitary-gonadal (HPG) axis, thereby inhibiting the production and release of testosterone (Leisegang & Henkel, 2018; Wittert & Grossmann, 2022). Clinical studies directly examining the role of chronic inflammation in mediating declines in serum testosterone associated with obesity remain scarce, highlighting a significant gap and potential value for further research.
Chronic inflammation serves as a common pathological basis for various diseases and has a complex interplay with testosterone levels, which are closely linked to male health (Babcock et al., 2022; Cheng et al., 2024). Our previous study and other study revealed that chronic inflammatory is negatively associated with male testosterone metabolism (Li et al., 2022; Su et al., 2026; Zhou et al., 2024). The Systemic Immune Inflammation Index (SII), Aggregate Index of Systemic Inflammation (AISI), and Systemic Inflammatory Response Index (SIRI) are currently regarded as novel inflammatory biomarkers, calculated from cell counts obtained through routine blood tests. These biomarkers serve as cost-effective screening tools for chronic inflammation and demonstrate a certain association with serum testosterone levels (Li et al., 2022; H. Liu et al., 2024).
Chronic inflammation associated with obesity may be a pivotal factor contributing to decreased testosterone levels in men. We utilized the National Health and Nutrition Examination Survey (NHANES) database to comprehensively investigate the relationship between obesity and serum testosterone levels in adult men and to explore the mediating role of chronic inflammatory status (AISI, SII, and SIRI) in this relationship.
Method
Study Population
We used data from the NHANES database, a continuous cross-sectional program designed to evaluate the nutrition and health of non-institutionalized U.S. residents (Deierlein et al., 2023; Yang et al., 2025). This analysis included participants from four survey cycles: 2011 to 2012, 2013 to 2014, 2015 to 2016, and 2021 to 2023. We included men aged 20 years or older who had available data on serum testosterone, BMI, BRI, WC, SII, SIRI, and AISI. Participants with missing data or covariates were excluded from the analysis. In addition, participants with a prior cancer diagnosis were excluded due to the potential for bias (Su et al., 2026). The final analysis comprised 7,418 individuals after excluding participants based on the following criteria: (1) females and individuals younger than 20 years (n = 30,102); (2) missing data for testosterone, BMI, BRI, WC, SII, AISI, or SIRI (n = 2,312); (3) prior cancer diagnosis (n = 943); and (4) missing values for covariates (n = 1,060). Supplemental Figure S1 shows the selection details.
Exposure Definitions
In the NHANES database, measurements of WC, height, and weight were conducted at mobile examination centers using standardized equipment such as digital scales, stadiometers, and measuring tapes, following standardized protocols to ensure the accuracy and consistency of anthropometric assessments. In our analysis, the exposure variable was obesity, which we assessed using BMI, BRI, and WC. Traditionally, BMI is commonly used to evaluate body fat levels and to classify individuals as being overweight or having obesity (Ortega et al., 2016). The WC provides a direct indication of abdominal fat (Alberti et al., 2006). The BRI is a novel metric for assessing obesity; compared with BMI, it offers a more accurate evaluation of visceral fat distribution and serves as a better predictor of visceral adiposity (Thomas et al., 2013). We employed multiple metrics to comprehensively assess obesity status. The BMI was classified based on standard criteria as follows: <25 kg/m2 (people with underweight or normal weight), 25 to 30 kg/m2 (people with overweight), and ≥30 kg/m2 (people with obesity; An et al., 2024). The WC in men was categorized into two groups: <102 cm (people with normal weight) and ≥102 cm (people with obesity; “Executive Summary of the Third Report of the National Cholesterol Education Program (NCEP) Expert Panel on Detection, Evaluation, and Treatment of High Blood Cholesterol in Adults (Adult Treatment Panel III),” 2001). The BRI was calculated according to the formula proposed by Thomas et al. (2013). In a national cohort study, X. Zhang et al. (2024) identified a U-shaped relationship between BRI and all-cause mortality among American adults. Informed by this finding, we categorized BRI into two groups: <4.5 and ≥4.5.
Measurement of Inflammatory Indicators, Outcome, and Covariates
This study evaluated inflammatory indicators derived from routine complete blood count tests, conducted with an automated hematology analyzer to measure neutrophils, lymphocytes, monocytes, and platelets (R. Ma et al., 2024). The systemic inflammatory indices, including SII, SIRI, and AISI, were computed based on peripheral blood cell counts (H. Liu et al., 2024). The specific formulas used for these calculations are detailed in Supplemental Table S1. In this study, SII, AISI, and SIRI were considered as mediating variables. The primary outcome was serum testosterone, determined by isotope dilution liquid chromatography coupled with tandem mass spectrometry (Hernández-Pérez et al., 2024).
Potential confounding factors affecting serum testosterone levels were assessed with reference to prior studies, including age, race, household poverty-to-income ratio (PIR; Huang et al., 2024; Wang et al., 2024), smoking status (X. Liu et al., 2025; Svartberg et al., 2003), hypertension, diabetes mellitus, and high cholesterol. Diabetes, hypertension, and high cholesterol were determined through self-reported medical diagnoses.
Statistical Analysis
All analyses were conducted according to a prespecified analytical framework consisting of four sequential steps. First, descriptive analyses were performed to summarize baseline characteristics across obesity categories (BMI, BRI, and WC). Continuous variables were compared using t-tests or Kruskal–Wallis tests as appropriate, and categorical variables were compared using chi-square tests. Second, we examined the associations between obesity indicators (BMI, BRI, and WC) and serum testosterone using multivariable linear regression models. Each obesity metric was analyzed separately. Both continuous and categorical forms of obesity indicators were evaluated. Three models were constructed: Model I (unadjusted), Model II (adjusted for age and race), and Model III (further adjusted for smoking status, PIR, diabetes, hypertension, and high cholesterol). Third, to explore potential nonlinear relationships, generalized additive models with smooth curve fitting were applied for each obesity indicator. Fourth, mediation analyses were conducted to evaluate whether inflammatory indices (SII, SIRI, and AISI) mediated the associations between each obesity indicator (BMI, BRI, WC) and serum testosterone. Mediation analyses were performed separately for each obesity metric and each inflammatory marker. The average causal mediation effect (ACME), average direct effect (ADE), total effect, and proportion mediated were estimated using bootstrap resampling. In addition, subgroup analyses stratified by obesity categories (BMI <25, 25–30, ≥30 kg/m2; BRI <4.5, ≥4.5; WC <102 cm, ≥102 cm) were performed. Mediation analyses were further repeated within stratified groups to assess whether the indirect effects differed by obesity status. Statistical analyses were performed by EmpowerStats software and R version 4.4.1. Because of the skewed distribution of serum testosterone, a natural logarithmic transformation of serum testosterone was performed for the analysis (Scinicariello & Buser, 2016; Su et al., 2022). Statistical significance was defined as p < .05.
Results
Relationship Between BMI and Male Serum Testosterone, and Mediating Effects of SII, SIRI, and AISI
Characteristics Distribution of Participants by BMI Categories
Supplemental Table S2 presents the baseline characteristics of 7,418 participants categorized by BMI. Significant differences in the baseline data for age, race, hypertension, diabetes, high cholesterol, PIR, serum testosterone, and chronic inflammation markers (SII, SIRI, and AISI) were noted within the three BMI groups (all p < .001), while baseline smoking data shows no significant differences. Participants with obesity (BMI ≥30 kg/m2) had the lowest serum testosterone levels (p < .001) and higher levels of chronic inflammation markers (SII, SIRI, and AISI; p < .001).
Association Between BMI and Male Serum Testosterone
Table 1 shows that BMI was inversely associated with natural log-transformed serum testosterone levels in all models. In the fully adjusted model (Model III), each 1 kg/m2 increase in BMI was associated with a 0.03-unit decrease in ln-testosterone (β = −0.03; 95% CI: −0.03, −0.03; p < .001). In subgroup analyses stratified by BMI categories, the negative associations remained significant. For participants with BMI <25, 25 to 30, and ≥30, the corresponding β coefficients for ln-testosterone were −0.03 (95% CI: −0.04, −0.02), −0.03 (95% CI: −0.05, −0.02), and −0.02 (95% CI: −0.03, −0.02), respectively (p < .001 for all). We also employed generalized additive modeling and smoothed curve fitting to evaluate the relationship between BMI and serum testosterone levels (Supplemental Figure S2). In adult males, we observed a nonlinear negative relationship, demonstrating a clear negative association between BMI and serum testosterone levels.
Association Between BMI and Serum Testosterone in Adult Males.

Note. Values are presented as β coefficients with corresponding 95% confidence intervals and p values. Model I was unadjusted; Model II adjusted for age and race; Model III further controlled for smoking status, PIR, diabetes, hypertension, and high cholesterol. BMI = body mass index.
Mediation Effects of SII, SIRI, and AISI on BMI and Male Serum Testosterone Associations
Table 2 presents the mediation analyses evaluating inflammatory indicators in the association between BMI and serum testosterone. For SII, the ACME was –0.0015 (95% CI: –0.0030 to –0.0004, p = .004), accounting for 0.72% of the total effect. For SIRI, the ACME was –0.0039 (95% CI: –0.0067 to –0.0018, p < .001), with 1.89% of the effect mediated. For AISI, the ACME was –0.0044 (95% CI: –0.0076 to –0.0021, p < .001), corresponding to 2.12% of the effect. In addition, we conducted BMI-stratified subgroup analyses (Supplemental Table S3). Significant mediation effects were observed exclusively among participants with obesity (BMI ≥30 kg/m2), with proportion mediated values of 2.83% (SII), 4.89% (AISI), and 5.14% (SIRI).
Mediation Analyses With Inflammatory Indicators Between the Association of BMI and Serum Testosterone.

Note. Age, race, poverty income ratio, diabetes, hypertension, high cholesterol and smoking were adjusted. BMI = body mass index (kg/m2); SII = Systemic Immune-Inflammation Index; SIRI = Systemic Inflammatory Response Index; AISI = Aggregate Index of Systemic Inflammation; ACME = average causal mediation effect; ADE = average direct effect.
Relationship Between BRI and Male Serum Testosterone, and Mediating Effects of SII, SIRI and AISI
Characteristics Distribution of Participants by BRI Categories
Supplemental Table S4 summarizes the baseline characteristics of 7,418 participants categorized by BRI, with 3,168 subjects at BRI <4.5 and 4,250 at BRI ≥4.5. Significant differences in baseline data for age, race, hypertension, diabetes, high cholesterol, PIR, smoking, serum testosterone, and chronic inflammation markers (SII, SIRI, and AISI) were observed among the two BRI groups (all p < .05). Participants in the BRI ≥4.5 group had the lowest serum testosterone levels (p < .001) and higher levels of chronic inflammation markers (SII, SIRI, and AISI; p < .001)
Association Between BRI and Male Serum Testosterone
Table 3 presents the associations between BRI and log-transformed serum testosterone levels in adult males. In the continuous analysis, a 1-unit increase in BRI was significantly associated with a 0.09-unit decrease in ln-testosterone across all models (Model I: β = −0.09, 95% CI: −0.10 to −0.09; Model II: β = −0.09, 95% CI: −0.10 to −0.09; Model III: β = −0.09, 95% CI: −0.09 to −0.08; all p < .001). Subgroup analyses based on BRI levels revealed stronger associations in men with lower BRI. Among participants with BRI <4.5, the β values ranged from −0.15 to −0.16 across models, indicating a pronounced inverse relationship (Model III: β = −0.15, 95% CI: −0.17 to −0.13; p < .001). In contrast, for those with BRI ≥4.5, the association was weaker but still statistically significant (Model III: β = −0.07, 95% CI: −0.08 to −0.06; p < .001). We also employed generalized additive modeling and smoothed curve fitting to evaluate the relationship between BRI and serum testosterone levels (Supplemental Figure S2). In adult males, we observed a nonlinear negative relationship, demonstrating a clear negative association between BRI and serum testosterone levels.
Association Between BRI and Serum Testosterone in Adult Males.
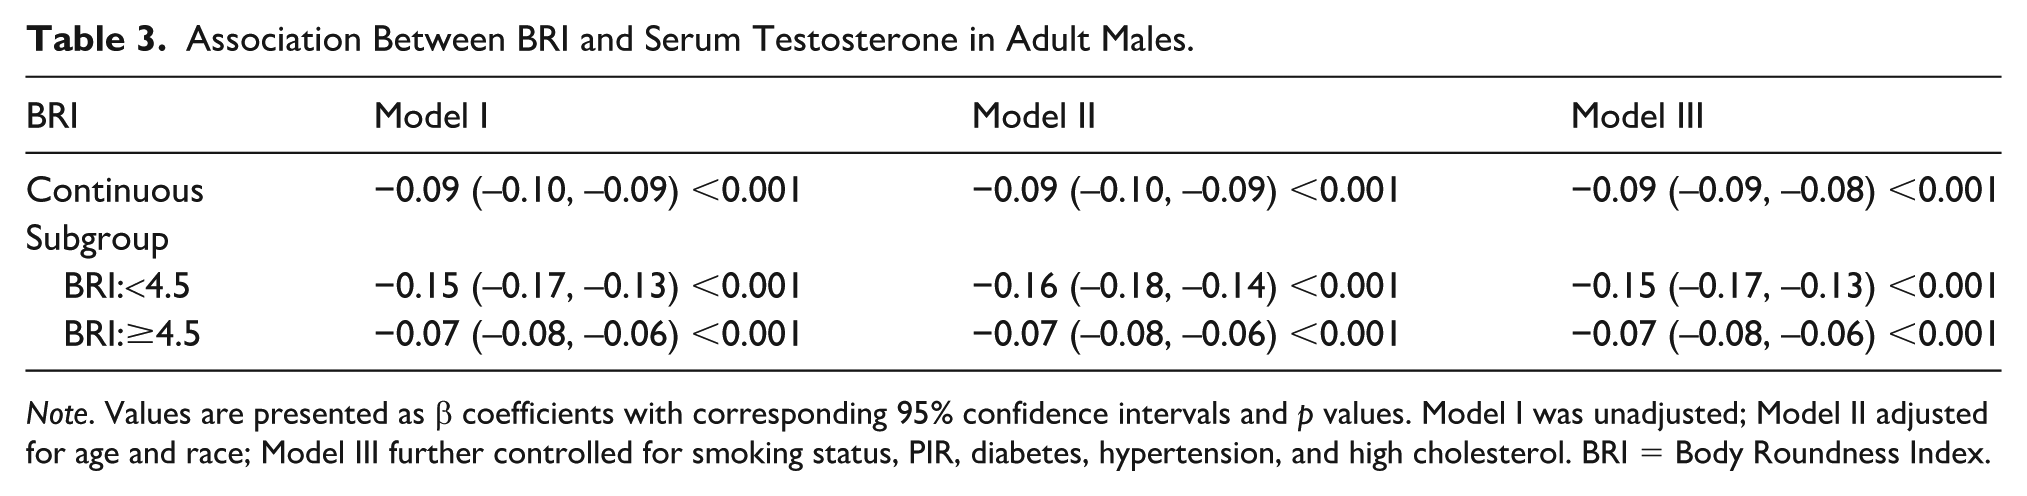
Note. Values are presented as β coefficients with corresponding 95% confidence intervals and p values. Model I was unadjusted; Model II adjusted for age and race; Model III further controlled for smoking status, PIR, diabetes, hypertension, and high cholesterol. BRI = Body Roundness Index.
Mediation Effects of SII, SIRI, and AISI on BRI and Male Serum Testosterone Associations
Table 4 presents the mediation analyses evaluating inflammatory indicators in the association between BRI and serum testosterone. For SII, the ACME was −0.0022 (95% CI: −0.0040 to −0.0008, p < .001), accounting for 0.99% of the total effect. For SIRI, the ACME was −0.0048 (95% CI: −0.0082 to −0.0023, p < .001), with 2.17% of the effect mediated. For AISI, the ACME was −0.0053 (95% CI: −0.0092 to −0.0024, p < .001), corresponding to 2.38% of the effect. In addition, we conducted BRI-stratified subgroup analyses (Supplemental Table S5). Significant mediation effects were observed exclusively in the BRI ≥4.5 group, with proportion mediated values of 1.70% (SII), 4.17% (AISI), and 4.18% (SIRI).
Mediation Analyses With Inflammatory Indicators Between the Association of BRI and Serum Testosterone.
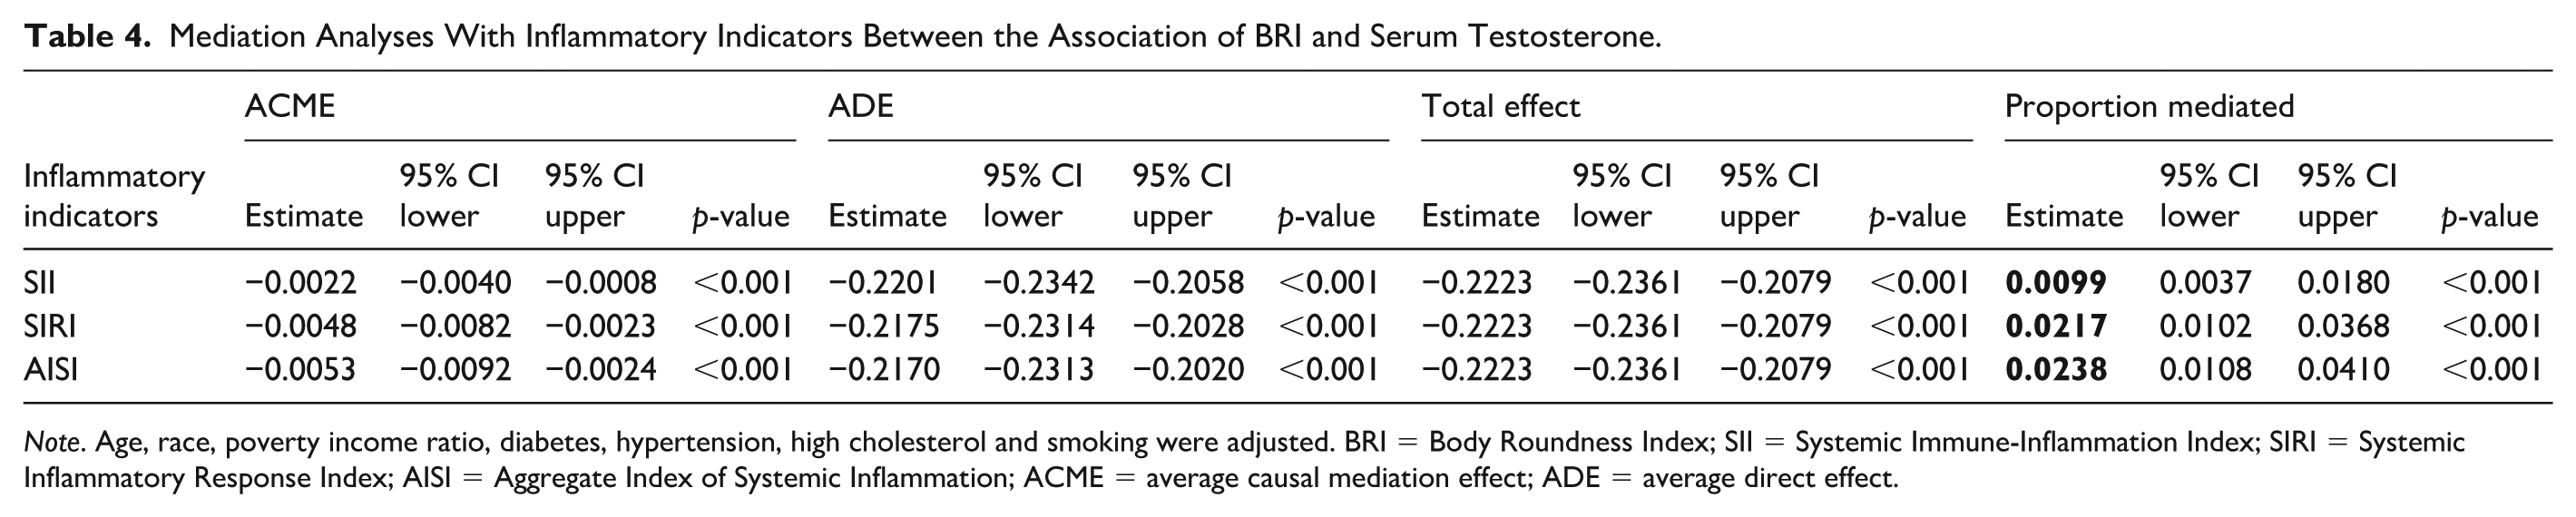
Note. Age, race, poverty income ratio, diabetes, hypertension, high cholesterol and smoking were adjusted. BRI = Body Roundness Index; SII = Systemic Immune-Inflammation Index; SIRI = Systemic Inflammatory Response Index; AISI = Aggregate Index of Systemic Inflammation; ACME = average causal mediation effect; ADE = average direct effect.
Relationship Between WC and Male Serum Testosterone, and Mediating Effects of SII, SIRI, and AISI
Characteristics Distribution of Participants by WC Categories
Supplemental Table S6 provides the baseline characteristics of participants grouped by WC, with 4,201 subjects having a WC <102 cm and 3,217 subjects with a WC ≥102 cm. Significant differences in baseline data for age, race, hypertension, diabetes, high cholesterol, serum testosterone, and chronic inflammation markers (SII, SIRI, and AISI) were observed among the two WC groups (all p < .001), while baseline data for smoking and PIR showed no significant differences. Participants with obesity (WC ≥102 cm) had the lowest serum testosterone levels (p < .001) and higher levels of chronic inflammation markers (SII, SIRI, and AISI; p < .001).
Association Between WC and Male Serum Testosterone
Table 5 displays the associations between WC and log-transformed serum testosterone levels in adult males. In the continuous analysis, each 1 cm increase in WC was significantly associated with a 0.01-unit decrease in ln-testosterone across all three models (Model III: β = −0.01, 95% CI: −0.01 to −0.01; p < .001). Subgroup analysis by WC categories showed consistent negative associations. Among men with WC <102 cm, the β remained −0.01 (95% CI: −0.02 to −0.01; p < .001) across all models. Similarly, in those with WC ≥102 cm, a stable inverse association was observed, with β = −0.01 (95% CI: −0.01 to −0.01; p < .001) across all models. We also employed generalized additive modeling and smoothed curve fitting to evaluate the association between WC and serum testosterone levels (Supplemental Figure S2). In adult males, we observed a nonlinear negative relationship, demonstrating a clear negative association between WC and serum testosterone levels.
Association Between WC and Serum Testosterone in Adult Males.

Note. Values are presented as β coefficients with corresponding 95% confidence intervals and p values. Model I was unadjusted; Model II adjusted for age and race; Model III further controlled for smoking status, PIR, diabetes, hypertension, and high cholesterol. WC = waist circumference.
Mediation Effects of SII, SIRI, and AISI on WC and Male Serum Testosterone Associations
Table 6 presents the mediation analyses evaluating inflammatory indicators in the association between WC and serum testosterone. For SII, the ACME was −0.0021 (95% CI: −0.0038 to −0.0008, p < .001), accounting for 0.88% of the total effect. For SIRI, the ACME was −0.0048 (95% CI: −0.0082 to −0.0023, p < .001), with 1.99% of the effect mediated. For AISI, the ACME was −0.0052 (95% CI: −0.0091 to −0.0025, p < .001), corresponding to 2.20% of the effect. In addition, we conducted WC-stratified subgroup analyses (Supplemental Table S7). Significant mediation effects were observed exclusively among participants with obesity (WC ≥102 cm), with proportion mediated values of −2.14% (SII), 5.41% (AISI), and 5.01% (SIRI).
Mediation Analyses With Inflammatory Indicators Between the Association of WC and Serum Testosterone.

Note. Age, race, poverty income ratio, diabetes, hypertension, high cholesterol and smoking were adjusted. WC = Waist Circumference (cm); SII = Systemic Immune-Inflammation Index; SIRI = Systemic Inflammatory Response Index; AISI = Aggregate Index of Systemic Inflammation; ACME = Average Causal Mediation Effect; ADE = Average Direct Effect.
Discussion
Our study ultimately included 7,418 adult men. Our analysis revealed that higher levels of obesity, reflected by BMI, WC, and BRI, tended to be associated with lower serum testosterone, with inflammatory indicators (SII, SIRI, AISI) mediating this relationship. Subgroup analyses for BMI, WC, and BRI consistently indicated a negative association with serum testosterone across all subgroups. The mediating effect of chronic inflammatory status was statistically significant only among individuals with obesity (BRI ≥4.5, WC ≥102 cm, and BMI ≥30 kg/m2). These results offer valuable understanding of how obesity is related to male serum testosterone levels and highlight the involvement of chronic inflammation in this association.
The majority of studies have reported a negative impact of having obesity on serum testosterone levels. Svartberg et al. (2003) identified BMI as an independent predictor of total testosterone, free testosterone (FT), and sex hormone–binding globulin (SHBG), all of which were negatively associated with BMI. Analysis of the NHANES database (n = 6,859) further revealed a significant negative association between serum testosterone levels and weight-adjusted waist index in adult males (Wang et al., 2024). In addition, meta-analyses have indicated that total testosterone, SHBG, and FT in adult men are negatively correlated with increasing BMI (MacDonald et al., 2010). Weight loss interventions, including dietary modifications and bariatric surgery, have been shown to significantly increase plasma total testosterone levels in men (Biernikiewicz et al., 2025). By analyzing various obesity indicators, including BMI, BRI, and WC, our study demonstrated a negative association between obesity and male testosterone levels, thereby enhancing the reliability of this finding.
Chronic inflammation induced by obesity may represent one potential biological pathway contributing to reduced testosterone levels. Beyond serving as an energy reservoir, adipose tissue also functions as an endocrine organ. In the state of having obesity, hypertrophied white adipose tissue releases a substantial amount of adipokines, pro-inflammatory factors, and chemokines (Ou et al., 2022). Research has shown that the chronic inflammatory state in mice with obesity can impair the reproductive system by inducing neuroinflammatory effects and synaptic modifications in glial cells, which damage Gonadotropin-releasing hormone (GnRH) neurons and lead to reduced testosterone levels through effects on the HPG axis (Lainez & Coss, 2019). In another animal study, it was reported that obesity induced by a high-fat diet increased testicular inflammation levels and activated inflammation-related signaling pathways, which may directly inhibit testosterone synthase activity or induce testicular cell apoptosis (Fan et al., 2017). For example, activation of NF-κB downregulates the expression of key enzymes involved in testosterone synthesis (such as StAR, P450scc, and 3β-HSD), thereby reducing the conversion of cholesterol to testosterone (Yi et al., 2020). Moreover, obesity can lead to the polarization of M1 macrophages in adipose tissue, which secrete proinflammatory factors such as TNF-α, exacerbating both local and systemic inflammation (Lumeng et al., 2007). These factors indirectly affect the energy metabolism and steroidogenic function of Leydig cells by interfering with insulin signaling pathways, resulting in decreased serum testosterone levels (El-Shehawi et al., 2020). Clinical studies have also demonstrated an association between obesity and chronic inflammation. A cross-sectional study utilizing the NHANES database, which included 20,011 adult men in the United States, found that obesity in American adults is positively correlated with the SII and SIRI (Y. Z. Zhang et al., 2025). Another cross-sectional analysis based on NHANES data investigating SII levels and abdominal obesity also reported similar conclusions (Qiu et al., 2024). A Chinese study revealed that increased SII levels are related to an elevated risk of people with sarcopenic obesity, particularly among middle-aged and elderly individuals in China (Wan et al., 2024). There are limited clinical studies exploring the relationship between chronic inflammation induced by obesity and male testosterone. Our findings underscore that chronic inflammation may partly explain the inverse relationship between obesity and serum testosterone levels, with a more pronounced effect observed in men with obesity.
Extensive research evidence has confirmed the potential negative association between chronic inflammation and testosterone levels. Our previous cross-sectional study of NHANES data indicated that in middle-aged men, especially among American men aged ≥60, there is a negative association between the SII and both serum testosterone and FT levels (Su et al., 2026). Several similar studies have suggested that SII may independently affect hormone homeostasis (Gao & Liu, 2024), showing a negative correlation with serum testosterone (Wei et al., 2023). A clinical study has demonstrated that testosterone deficiency has been linked to elevated levels of high-sensitivity C-reactive protein, while prolonged testosterone treatment may reduce inflammation in men with hypogonadism (X. Zhang et al., 2021). The impact of chronic inflammation on serum testosterone levels is a complex process involving multiple mechanisms. Chronic inflammation releases pro-inflammatory cytokines (such as IL-6 and TNF-α), which inhibit the HPG axis, leading to a decreased ability of the testes to synthesize testosterone (Wittert & Grossmann, 2022). Inflammatory factors such as TNF-α, IL-1, and IL-6 can also inhibit the testosterone synthesis function of Leydig cells and increase the activity of aromatase, leading to the conversion of testosterone into estrogen (Forsyth, Jiwrajka, Lovell, Toothacre, and Anguera, 2024; Mazloomi et al., 2023). Furthermore, other studies indicate that chronic inflammation promotes oxidative stress, leading to the senescence and dysfunction of Leydig cells, thereby further reducing testosterone secretion (Leisegang et al., 2021).
The mediating effect of inflammatory indices was observed only among individuals with obesity (BMI ≥30 kg/m2, BRI ≥4.5, or WC ≥102 cm), suggesting a potential adiposity-dependent inflammatory threshold. In individuals who are overweight or have lower adiposity, adipose tissue may remain in a relatively compensated metabolic state, and inflammatory activation may not reach a sustained systemic level sufficient to meaningfully influence the HPG axis. However, once adiposity exceeds a certain threshold, adipose tissue expansion is characterized by macrophage infiltration, M1 polarization, and persistent activation of pro-inflammatory pathways such as NF-κB, leading to chronic systemic inflammation (Luo et al., 2024; Souto et al., 2025). This pro-inflammatory milieu may suppress GnRH secretion and impair Leydig cell steroidogenesis, thereby contributing to reduced testosterone levels (Morales et al., 2003; Sonnweber et al., 2022). Although the proportion mediated by inflammatory markers was modest (approximately 2%–5%), this finding is biologically plausible. The relationship between obesity and testosterone is inherently multifactorial, involving parallel mechanisms such as reduced SHBG levels, increased aromatase activity, insulin resistance, and adipokine-mediated disruption of testicular function (Okobi et al., 2024). Chronic inflammation likely represents one contributory pathway rather than the dominant driver. Nevertheless, even modest mediation effects may carry meaningful public health implications, particularly given the high prevalence of obesity among adult men.
As far as we are aware, no prior study has explored the mediating effect of chronic inflammation status in the association between obesity and male serum testosterone. We used multiple metrics assessing obesity and chronic inflammation to preserve the reliability of our conclusions. Our results suggest that SII, SIRI, and AISI mediate the relationship between BMI, BRI, WC, and serum testosterone levels in adult men. This mediating effect is more pronounced in people with obesity. These findings suggest a statistically significant but quantitatively modest mediating role of chronic inflammation in the association between obesity and serum testosterone levels in adult men, providing supportive evidence that chronic inflammation may partially contribute to this relationship. Several limitations of this study should be acknowledged. First, its cross-sectional design precludes any conclusions about causality or the temporal sequence between obesity and testosterone levels in adult men. Second, although we adjusted for several confounding factors, we cannot completely rule out unmeasured or residual confounding, such as variations related to the timing of blood sample collection and other potential covariates. Third, we could not obtain data on participants undergoing testosterone replacement therapy or with a history of orchiectomy from the NHANES database, making it difficult to clearly exclude these factors. Furthermore, although the mediation effects were statistically significant, their magnitude was modest, indicating that additional unmeasured mechanisms may play a more substantial role in the observed associations.
Conclusion
Our study indicates that obesity, as evaluated by BMI, BRI, and WC, is negatively associated with serum testosterone levels in adult men. Chronic inflammation markers SII, SIRI, and AISI were identified as statistically significant but modest mediators of these associations, particularly among men with obesity (BRI ≥4.5, WC ≥102 cm, and BMI ≥30 kg/m2). These findings suggest that chronic inflammation may partially contribute to the inverse relationship between obesity and serum testosterone levels, although the magnitude of mediation was relatively small.
Supplemental Material
sj-docx-1-jmh-10.1177_15579883261436321 – Supplemental material for Associations of Obesity, Inflammatory Indicators, and Serum Testosterone in Adult Males: A Cross-Sectional Study Based on NHANES 2011–2016 and 2021–2023
Supplemental material, sj-docx-1-jmh-10.1177_15579883261436321 for Associations of Obesity, Inflammatory Indicators, and Serum Testosterone in Adult Males: A Cross-Sectional Study Based on NHANES 2011–2016 and 2021–2023 by Si-zheng Zhang, Yu-hang Meng, Zheng-yang Zhou, Jie Wu, Liang Su and Yong-zheng Jiao in American Journal of Men's Health
Footnotes
Acknowledgements
We express our gratitude to the NHANES team and all individuals who took part in this study.
Ethical Considerations
The NHANES is administered by the Centers for Disease Control and Prevention through the National Center for Health Statistics (NCHS). The study protocol received approval from the NCHS Research Ethics Review Board.
Consent to Participate
Written informed consent was obtained from all participants.
Consent for Publication
Not applicable.
Author Contributions
The authors’ responsibilities were as follows: Yong-zheng Jiao and Jie Wu: conception and design; Liang Su and Si-zheng Zhang: acquisition of data and writing initial manuscript; Yu-hang Meng and Zheng-yang Zhou: review and editing. Each author has read the manuscript and approved its final content prior to submission.
Funding
The authors disclosed receipt of the following financial support for the research, authorship, and/or publication of this article: This work was supported by the National Natural Science Foundation of China (No. 82474523), the Postdoctoral Fellowship Program of CPSF (GZC20252632), High-Level Traditional Chinese Medicine Hospital Project of the Eye Hospital, China Academy of Chinese Medical Sciences (No. GSP5-97) and Beijing Natural Science Foundation (No. 7262211).
Declaration of Conflicting Interests
The authors declared no potential conflicts of interest with respect to the research, authorship, and/or publication of this article.
Data Availability
The dataset used in this analysis is publicly accessible via the NHANES website.
Supplemental Material
Supplemental material for this article is available online.
Clinical Trial Number
Not applicable.
References
Supplementary Material
Please find the following supplemental material available below.
For Open Access articles published under a Creative Commons License, all supplemental material carries the same license as the article it is associated with.
For non-Open Access articles published, all supplemental material carries a non-exclusive license, and permission requests for re-use of supplemental material or any part of supplemental material shall be sent directly to the copyright owner as specified in the copyright notice associated with the article.