
Abstract
Testosterone deficiency in men is often attributed to aging or biology, yet hormone levels also reflect social determinants of health (SoDH) and masculinity-related stressors. This study applied the Healthy People 2030 SoDH framework to examine biological, behavioral, and social predictors of testosterone deficiency in U.S. men. Data were analyzed from four National Health and Nutrition Examination Survey (NHANES) cycles (2011–2016 and 2021–2023), including 10,357 men aged ≥18 years with valid total testosterone measurements. Men reporting exogenous testosterone therapy were excluded. Testosterone deficiency was defined as total serum testosterone <300 ng/dL. Survey-weighted, age-adjusted multivariable logistic regression models examined biological, behavioral, and SoDH domains. Testosterone deficiency prevalence was 25.7%, declining from 28.1% in 2011–2012% to 20.3% in 2021–2023 (P-trend < .01). Independent predictors included obesity (AOR = 2.69, 95% CI [2.36–3.06]), impaired fasting glucose (AOR = 1.55, 95% CI [1.27–1.90]), diabetes-range glucose (AOR = 2.92, 95% CI [2.03–4.21]), and prolonged sedentary time ≥ 8 h/day (AOR = 1.39, 95% CI [1.14–1.70]). Men without a usual source of care had higher odds (AOR = 1.27, P < .05). Current smokers (AOR = .79, P < .05) and never-married men (AOR = .70, P < .001) had lower odds. Testosterone deficiency is shaped by metabolic, behavioral, and relational factors rather than socioeconomic markers alone. These findings support framing testosterone deficiency as a biopsychosocial condition and highlight the value of integrating endocrine and social-contextual perspectives in men’s health research and clinical care.
Keywords
Introduction
Testosterone is widely regarded as the biological foundation of male health, shaping muscle mass, libido, energy, mood, and metabolic function (Han et al., 2021; Shyr et al., 2023). Beyond its physiological role, testosterone holds symbolic weight, serving as a hormonal shorthand for dominance, strength, and virility in men (Connell & Messerschmidt, 2005). Low testosterone is often interpreted not only as a biomedical condition but also as a disruption of masculine expectations, how men should feel, behave, and perform (Burris & Knox, 2024). Population-level studies have documented a steady decline in testosterone levels among U.S. men, even after accounting for age and body mass index (Sartorius et al., 2012; Travison et al., 2017). Although clinical research often attributes these patterns to metabolic or environmental factors, they may also reflect broader sociocultural forces that shape men’s health, identity, and self-worth.
The social determinants of health (SoDH) framework, as outlined by the U.S. Department of Health and Human Services’ Healthy People 2030, provides a lens to understand how social and economic conditions influence health outcomes (Braveman et al., 2011). Healthy People 2030 includes the following domains in the definition of SoDH: economic stability, education, access and quality, health care access and quality, neighborhood and built environment, and social and community context (Office of Disease Prevention and Health Promotion, 2023). These domains shape daily life circumstances that affect health behaviors, stress responses, and biological processes, including hormonal regulation. Mesler et al. (2021) found that masculine norms such as stoicism and self-reliance may foster resilience but also contribute to health risks when men feel they cannot fulfill provider roles.
Recent masculinity scholarship emphasizes that gender norms are embodied and stress responsive. Constructs such as masculine discrepancy stress, the psychological strain experienced when men perceive themselves as falling short of internalized masculine ideals (Upenieks et al., 2024), and evidence linking traditional masculinity norms to emotional suppression, chronic psychological stress, and maladaptive coping behaviors (Mokhwelepa & Sumbane, 2025) suggest that gendered social expectations may operate through sustained stress-related pathways. These frameworks provide a theoretical basis for examining whether masculinity-related stressors are associated with downstream physiological processes, including hormonal regulation. For example, economic instability or discrimination may undermine men’s ability to fulfill provider roles, increasing chronic stress and disrupting hormonal balance (Berg & Linander, 2023). Despite these theoretical advances, empirical research has rarely examined testosterone deficiency through an SoDH lens, leaving gaps in understanding how structural factors shape men’s hormonal health.
This study uses applicable data from the National Health and Nutrition Examination Survey, NHANES, 2011 to 2016, and then from 2021 to 2023, to examine trends and predictors of testosterone deficiency among U.S. men. We evaluate how social determinants of health, including economic stability, health care access, social context, and health behaviors, relate to the likelihood of testosterone deficiency. By situating testosterone within biological and sociocultural contexts, we aim to reframe hormone health as an embodied symbol of masculinity, reflecting not only physiological processes but also the pressures of social roles and structural inequalities.
Method
Study Design and Data Source
This cross-sectional study analyzed data from the National Health and Nutrition Examination Survey (NHANES), a nationally representative survey of the non-institutionalized U.S. population conducted by the National Center for Health Statistics (NCHS). Four NHANES cycles were included: 2011–2012, 2013–2014, 2015–2016, and 2021–2023. The 2017–2018, 2019–2020, and combined 2017–March 2020 NHANES cycles were excluded due to changes in testosterone assay methodology and the limited availability of laboratory data during the COVID-19 pandemic, which hindered valid longitudinal comparisons (NCHS, 2024a, 2024b). NHANES uses a complex, multistage probability sampling design to collect nationally representative data through interviews, physical examinations, and laboratory testing (Centers for Disease Control and Prevention, 2023). As this study used publicly available, de-identified data, it was exempt from institutional review board oversight.
Sample Selection
Eligible participants were male, aged 18 years or older, from the 2011–2012, 2013–2014, 2015–2016, and 2021–2023 NHANES cycles. Of 12,357 eligible men, 1,959 were excluded due to missing total serum testosterone measurements or incomplete survey design variables, leaving 10,398 with valid laboratory and design data. Individuals reporting use of exogenous testosterone therapy were further excluded (n = 41) to avoid confounding endogenous hormone levels. Prescription drug data were reviewed to identify testosterone-containing medications, including testosterone, methyltestosterone, Androgel, Androderm, Axiron, Fortesta, Testim, Striant, Natesto, Aveed, Vogelxo, Xyosted, Testopel, Jatenzo, and Kyzatrex, while excluding agents such as ibandronate, estrogen, oxandrolone, nandrolone, and dehydroepiandrosterone. The final analytic sample included 10,357 adult men across the four NHANES cycles. Figure 1 illustrates the sample selection process.

Flowchart of Sample Selection for Male Testosterone Analysis (NHANES 2011–16, 2021-23).
Outcome Variable
The primary outcome was testosterone deficiency, defined as total serum testosterone below 300 ng/dL, consistent with the clinical threshold used in recent endocrinology and sexual medicine guidelines (Khera et al., 2025). In all included cycles, total testosterone was measured in serum using isotope dilution–liquid chromatography tandem mass spectrometry (ID–LC–MS/MS) at the Centers for Disease Control and Prevention (CDC) National Center for Environmental Health. This high-throughput method is certified by the CDC Hormone Standardization (HoSt) Program and traceable to external reference materials, with cycle-specific analytic ranges and limits of detection documented in NHANES laboratory method files (NCHS, 2024a, 2024b). Survey weights were applied to ensure nationally representative estimates, accounting for the complex sampling design (Centers for Disease Control and Prevention, 2023).
Laboratory Methods and Assay Harmonization For each included NHANES cycle (2011–2012, 2013–2014, 2015–2016, and 2021–2023), serum specimens were processed, stored at −20 °C or colder, and shipped to the CDC’s Division of Environmental Health Laboratory Sciences for analysis following standardized NHANES protocols. Total testosterone was quantified using isotope dilution liquid chromatography–tandem mass spectrometry (ID–LC–MS/MS) in all included cycles, ensuring methodologic consistency across study years. This assay demonstrates high accuracy and precision and is certified through the CDC HoSt Program. Calibration is traceable to certified reference materials from the Australian National Measurement Institute (ANMI M914), and NHANES employs comprehensive internal and external quality-control procedures as detailed in the NHANES Laboratory/Medical Technologists Procedures Manual.
To preserve assay comparability for temporal analyses, we restricted the sample to cycles in which total testosterone was measured with the same LC–MS/MS platform and for which complete laboratory documentation was available (2011–2016 and 2021–2023). Intermediate cycles (2017–2018, 2019–2020, and the combined 2017–March 2020 prepandemic file) were excluded due to incomplete hormone data and documented disruptions in NHANES laboratory operations during the COVID-19 pandemic, which prevented reliable harmonization of testosterone assays across these cycles.
Cycle-specific limits of detection and analytic ranges are summarized in Supplementary Appendix A; all cycles exhibited identical analytic sensitivity (LOD = 0.75 ng/dL). No top-coding was applied. Values below the LOD were retained exactly as reported in the public-use files, and all measured values above the LOD were included in the analyses.
Social Determinants of Health Predictor Variables
Predictor variables were selected in alignment with the U.S. Department of Health and Human Services’ Healthy People 2030 social determinants of health (SoDH) framework (Office of Disease Prevention and Health Promotion, 2023). Economic stability was represented by the income-to-poverty ratio, treated as a continuous measure, and by employment status, categorized as working, unemployed, or not in the labor force. Education access and quality was assessed by highest education level, classified as less than high school, high school, some college, or college and above. Health care access and quality included both health insurance coverage (insured versus uninsured) and whether respondents reported a usual source of care (yes versus no). Neighborhood and built environment factors were assessed using housing size, measured as the number of rooms in the household (1–3, 4–5, 6–8, or 9 or more), and sedentary time, categorized into <4, 4–<6, 6–<8, and ≥8 hours per day. Social and community context included race and ethnicity (Non-Hispanic White, Mexican American, Other Hispanic, Non-Hispanic Black, Non-Hispanic Asian, or Other/Multi-Racial) and marital status (Married/Partnered, Widowed/Divorced/Separated, or Never Married).
Biological and behavioral covariates were included to capture health outcomes and risk factors that may influence testosterone regulation. These consisted of body mass index, dichotomized as <30 versus ≥30 kg/m2, fasting glucose categorized as <100 mg/dL, 100–125 mg/dL, or ≥126 mg/dL, average sleep duration classified as ≤6 hours, 6–<7 hours, 7–<9 hours, or ≥9 hours, depressive symptoms as defined by a PHQ-2 score ≥3, and smoking status defined as never, former, or current.
Reference categories were set as College+ education, insured, usual care, 4–5 rooms, working, never smoker, married or partnered, Non-Hispanic White, BMI <30, fasting glucose <100 mg/dL, sleep 7–<9 hours, and sedentary time 4–<6 hours. These variables were selected for their established associations with testosterone and their relevance to masculinity-related stress processes, serving as proxies for both structural disadvantage and psychosocial burden (Upchurch et al., 2021).
Data Preparation and Statistical Analysis
Data from multiple NHANES cycles were harmonized and merged following systematic cleaning and recoding of demographic, laboratory, and questionnaire variables. Missing covariate data were addressed using design-aware multiple imputation by chained equations (MICE) under a missing-at-random assumption, generating five imputed datasets. The imputation models incorporated all analytic covariates and explicitly included NHANES sampling weights, strata, and primary sampling units (PSUs) as predictors to account for the complex survey design. Consistent with recommended practice, the outcome variable, testosterone deficiency, and survey design variables were excluded from imputation.
Imputation performance was evaluated using standard diagnostics, including convergence (trace) plots and comparisons of observed and imputed covariate distributions, which demonstrated stable convergence and plausible imputations. Survey-weighted regression analyses were then performed separately within each imputed dataset, and parameter estimates were combined using Rubin’s rules to obtain final inferential results.
Descriptive statistics, including weighted means, proportions, and 95% confidence intervals, were used to characterize the analytic sample. Prevalence estimates of testosterone deficiency were age-standardized using the direct method to the 2020 U.S. Census population, applying fixed age-specific weights across categories 18–29, 30–39, 40–49, 50–59, 60–69, and ≥70 years to account for differences in population age structure across survey cycles. Age-standardized prevalence estimates incorporated NHANES survey design variables and rescaled Mobile Examination Center (MEC) examination weights.
Age-Standardized Descriptive Contrasts
To contextualize temporal changes in testosterone deficiency prevalence, we estimated age-standardized prevalences of key metabolic, behavioral, and health care-access characteristics that could plausibly contribute to cycle-to-cycle shifts (obesity [BMI ≥30 kg/m2], fasting glucose categories, current smoking, sedentary time ≥8 h/day, and lack of a usual source of care). For comparability, these contrasts were calculated for pooled periods 2011–2016 and 2021–2023 using direct age standardization across the same age categories used for primary prevalence estimates (18–29, 30–39, 40–49, 50–59, 60–69, ≥70 years), accounting for NHANES complex survey design and rescaled MEC examination weights. Estimates were computed within each imputed dataset and combined using Rubin’s rules to obtain pooled prevalence, standard errors, and 95% confidence intervals. Results are presented in Supplementary Table S7.
Multivariable logistic regression was conducted using a quasibinomial family with NHANES survey weights to generate adjusted odds ratios and 95% confidence intervals. Models included all predictors across biological, behavioral, and social determinants of health domains, with age flexibly modeled using natural cubic splines with three degrees of freedom to capture non-linear associations. Temporal trends in testosterone deficiency prevalence were evaluated using survey-weighted regression models with survey cycle treated as a continuous variable, and the persistence of trends after age standardization was confirmed (NCHS, 2024a, 2024b). Potential effect modification by age and race/ethnicity was evaluated using interaction terms between marital status and age, modeled with natural cubic splines, and between marital status and race/ethnicity, with joint Wald tests used to assess statistical significance.
All analyses were performed in R version 4.5.0, with the complex sampling design accounted for via strata, primary sampling units, and adjusted survey weights in accordance with National Center for Health Statistics analytic guidelines (Centers for Disease Control and Prevention, 2023). Survey-weighted logistic regression models were fit using a quasibinomial family. Model diagnostics included assessment of multicollinearity using weighted variance inflation factors (VIFs) and condition indices derived from the weighted predictor correlation matrix, with results reported in Supplementary Table S6.
Sensitivity Analysis Using HbA1c
Since HbA1c is available for a broader MEC analytic sample than fasting glucose, we conducted a sensitivity analysis replacing fasting glucose categories with HbA1c categories (<5.7%, 5.7–<6.5%, ≥6.5%) while retaining the same covariate set and model structure. These models used MEC examination weights, rescaled across pooled cycles, instead of the fasting subsample weights to reflect the larger eligible sample. Results are presented as adjusted odds ratios with 95% confidence intervals in Supplementary Table S1 and visualized in Supplementary Figure S1.
Sensitivity Analysis Using SHBG and Free Androgen Index
Sex hormone binding globulin (SHBG) and derived measures of free or bioavailable testosterone are not available for all NHANES participants. An additional sensitivity analysis was therefore conducted among participants with measured SHBG to evaluate the robustness of the primary findings to alternative approaches for defining androgen status and to assess potential outcome misclassification related to reliance on a single total testosterone threshold.
Within the SHBG available subset, two complementary sensitivity analyses were performed. First, the primary outcome definition of testosterone deficiency based on total serum testosterone was re-estimated within this restricted subsample using the same covariate set and modeling framework as the main analysis. Second, an alternative androgen deficiency outcome was constructed using the Free Androgen Index (FAI), calculated as the ratio of total testosterone to SHBG following unit conversion. The FAI was analyzed as a binary outcome using the same multivariable modeling structure as the primary analysis.
Restriction to the SHBG subsample resulted in limited within sample variability for certain categorical covariates. To ensure numerical stability of survey weighted regression models, categorical predictors with insufficient observed variation were excluded from individual imputed datasets prior to model estimation. All remaining aspects of model specification including covariate definitions reference categories and functional modeling of age were identical to those used in the primary analysis.
Variable Harmonization Across Cycles
Sleep duration and sedentary behavior were harmonized across NHANES cycles using a pre-specified, cycle-invariant mapping plan prior to multiple imputation and regression modeling. For each included cycle, the cycle-specific sleep questionnaire item was mapped to a common continuous variable representing self-reported sleep duration in hours per night. Where variable names or item structure differed across cycles, an a priori coalescing rule was applied to preferentially select the primary nightly sleep-duration measure for that cycle. Missingness codes were handled consistently across cycles. To mitigate the influence of implausible values and reduce sensitivity to questionnaire wording differences, sleep duration was constrained to a biologically plausible range of 3–12 hours/night prior to categorization. Sleep duration was then categorized identically across cycles as ≤6, 6–<7, 7–<9, and ≥9 hours/night, with 7–<9 hours/night specified as the reference category.
Sedentary time was harmonized using the NHANES sedentary behavior item recorded in minutes per day. Reported minutes/day were converted to hours/day, and missingness codes were handled uniformly across cycles. To reduce undue influence of extreme values and potential reporting artifacts, sedentary time was constrained to a plausible range of 0–18 hours/day prior to categorization. Sedentary time was then categorized identically across cycles as <4, 4–<6, 6–<8, and ≥8 hours/day, with 4–<6 hours/day specified as the reference category.
To evaluate robustness to potential cycle-specific measurement differences, all multivariable analyses were repeated after restricting the analytic sample to NHANES cycles with consistent measurement of sleep and sedentary time (2011–2016). These sensitivity analyses retained identical imputation procedures, survey weights, covariate specification, and model structure. Results from restricted-cycle analyses were compared with pooled-cycle estimates and are reported in Supplementary Tables S4 and S5. A detailed cycle-by-cycle mapping of sleep and sedentary variables is provided in Supplementary Table S3.
Results
Descriptive Characteristics
The analytic sample consisted of 10,357 adult men aged 18 years and older, representing a nationally representative cohort across the four NHANES cycles (2011–2012, 2013–2014, 2015–2016, and 2021–2023). All continuous variables are reported as weighted means with standard errors (SE). The mean age was 46.5 ± 0.31 years. The average body mass index (BMI) was 28.9 ± 0.11 kg/m2, and the mean fasting glucose was 110.8 ± 0.38 mg/dL. Participants reported an average of 6.6 ± 0.07 sedentary hours per day and 7.2 ± 0.02 hours of sleep per day. The mean income-to-poverty ratio was 3.05 ± 0.05.
The racial and ethnic distribution of the sample included 65.1% Non-Hispanic White, 9.0% Mexican American, 6.7% Other Hispanic, 9.9% Non-Hispanic Black, 5.3% Non-Hispanic Asian, and 3.9% Other/Multi-Racial. Regarding socioeconomic indicators, 2.2% of participants were unemployed, and 31.2% were not in the labor force. Education levels were distributed as 14.9% less than high school, 22.7% high school graduates, 29.5% with some college, and 32.9% college or higher. Health insurance coverage was reported by 82.7% of participants, while 85.6% reported having routine access to health care.
Health behaviors indicated that 20.4% were current smokers, and 7.6% had PHQ-2 scores ≥3, consistent with possible depressive symptoms. The overall prevalence of testosterone deficiency, defined as total serum testosterone <300 ng/dL, was 25.7% (SE 0.7%) across all included NHANES cycles. Participants reporting exogenous testosterone prescriptions (0.1%, n = 41) were excluded from the analytic dataset to eliminate confounding. Cycle-specific age-standardized prevalence estimates with standard errors are reported in Supplementary Table S2, while adjusted associations for clinically salient exposures, including obesity and sedentary behavior, are visualized in Figure 2.
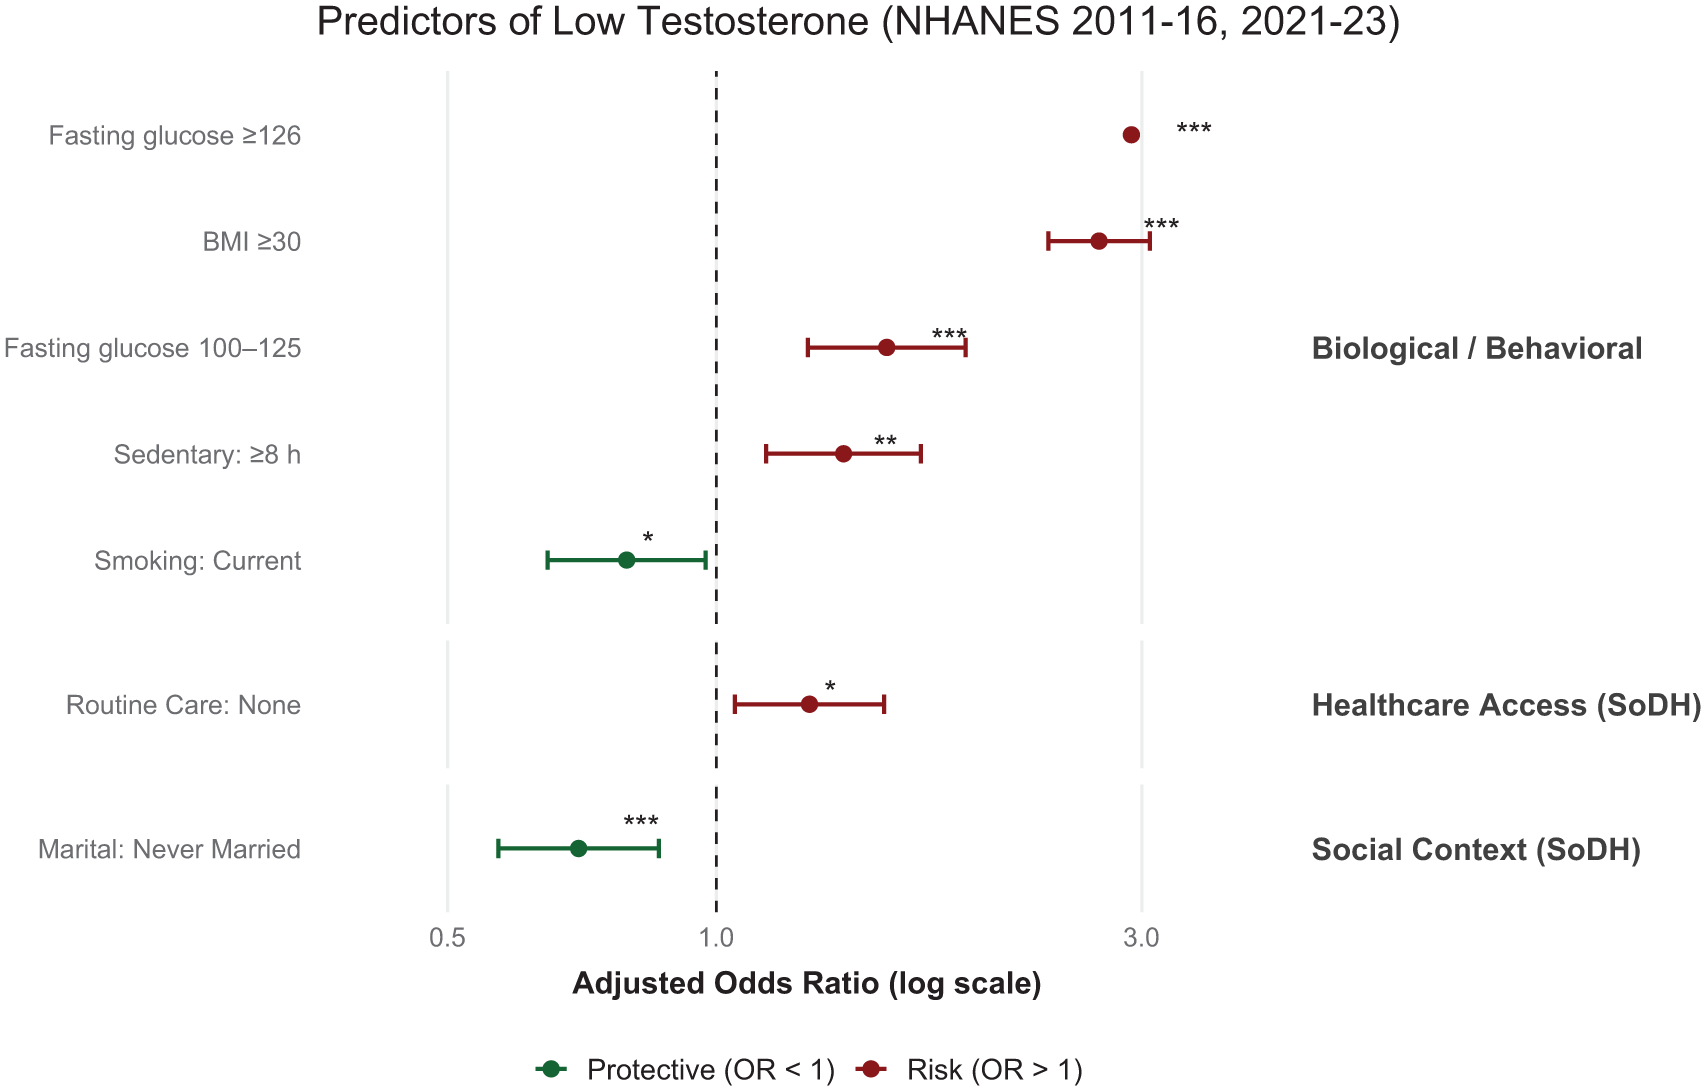
Forest Plot Depicting Statistically Significant Predictors of Testosterone Deficiency (Serum Testosterone <300 ng/dL) Among U.S. Adult Men From NHANES 2011–2023 (N = 10,398).
Regression Analysis: Social Determinants of Testosterone Deficiency
The multivariable logistic regression analysis identified several significant biological, behavioral, and social determinants of testosterone deficiency, as summarized in Table 1. In the Biological and Behavioral domain, men with obesity (BMI ≥30 kg/m2) had substantially higher odds of testosterone deficiency compared with men with BMI <30 (AOR = 2.69, 95% CI [2.36, 3.06], P < .001). Elevated fasting glucose was also strongly associated with testosterone deficiency, with increased odds observed for both impaired fasting glucose (100–125 mg/dL; AOR = 1.55, 95% CI [1.27, 1.90], P < .001) and diabetes-range glucose (≥126 mg/dL; AOR = 2.92, 95% CI [2.03, 4.21], P < .001). Prolonged sedentary behavior was an independent risk factor, with individuals reporting ≥8 sedentary hours per day showing increased odds of low testosterone (AOR = 1.39, 95% CI [1.14, 1.70], P = .0012). Current smoking was associated with lower odds of testosterone deficiency (AOR = .79, 95% CI [0.65, 0.97], P = .026), whereas former smoking was not significantly associated. Neither sleep duration nor PHQ-2 depressive symptoms demonstrated significant associations.
Biological and Behavioral Variables Integrated With Social Determinants of Health Multivariate Regression Model for Low Testosterone (NHANES 2011–16, 2021-23).
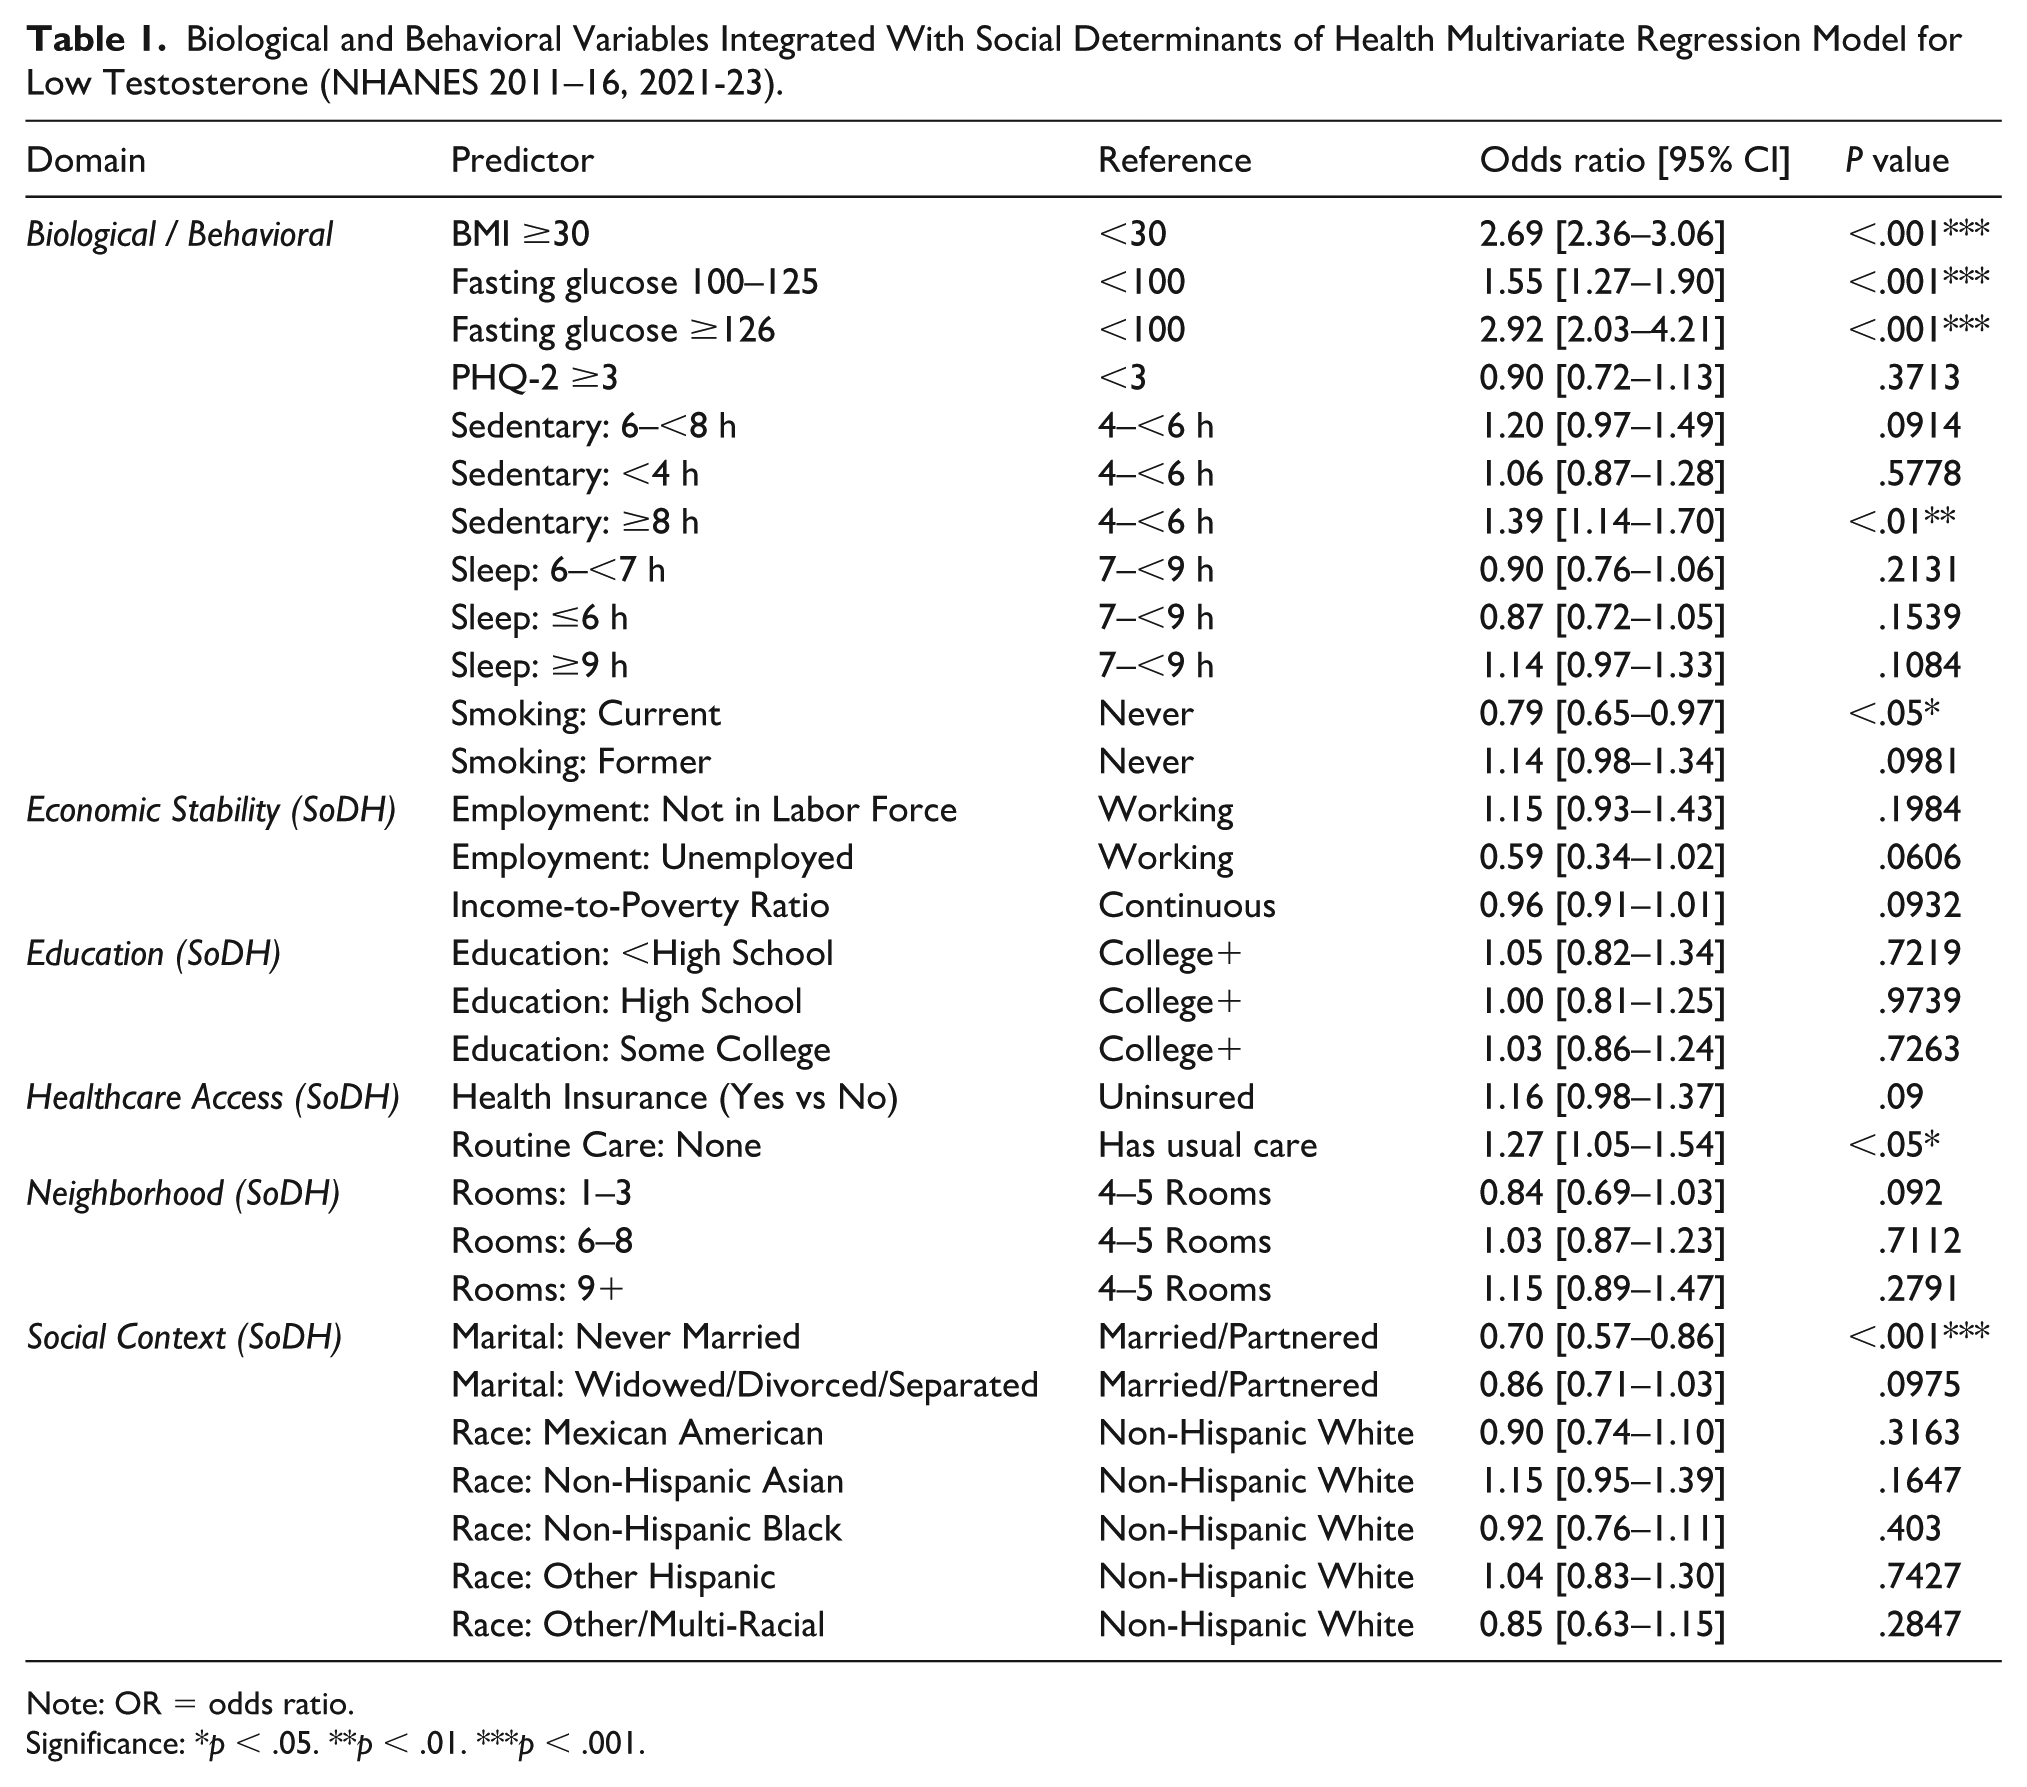
Note: OR = odds ratio.
Significance: *p < .05. **p < .01. ***p < .001.
Within the Health care Access domain, lack of a usual source of care was associated with increased odds of testosterone deficiency (AOR = 1.27, 95% CI [1.05, 1.54], P = .014). Health insurance status was not significantly associated.
In the Social and Community Context domain, marital status emerged as a significant factor. Compared with married or partnered men, those who were never married had significantly lower odds of testosterone deficiency (AOR = 0.70, 95% CI [0.57, 0.86], P < .001). Men who were widowed, divorced, or separated had lower odds as well, though this association did not reach statistical significance (AOR = .86, 95% CI [0.71, 1.03], P = .098). Race and ethnicity were not significantly associated with testosterone deficiency, although estimates suggested nonsignificant trends toward higher odds among Non-Hispanic Asian men and lower odds among Mexican American men.
Economic Stability indicators, including employment status and income-to-poverty ratio, as well as education level and housing conditions, were not significantly associated with testosterone deficiency.
Figure 2 highlights the statistically significant predictors identified in the multivariable regression model, illustrating the magnitude and direction of associations clearly.
In summary, obesity, elevated fasting glucose, prolonged sedentary time, lack of a usual source of care, current smoking, and marital status were the strongest predictors of testosterone deficiency among U.S. men. While most social determinants such as education, income, and race/ethnicity were not significantly associated, the findings underscore the importance of both biological and behavioral risk factors, as well as health care access, in shaping testosterone-related health outcomes. The observed decline in prevalence across survey cycles highlights a shifting epidemiologic landscape that warrants continued investigation.
Age-Standardized Descriptive Contrasts Across Periods
Several population characteristics changed between 2011–2016 and 2021–2023 (Supplementary Table S7). Age-standardized obesity prevalence increased from 35.1% (95% CI [32.6–37.6]) to 38.9% (95% CI [34.6–43.2]). In contrast, age-standardized current smoking declined from 21.4% (95% CI [19.0–23.8]) to 15.2% (95% CI [12.0–18.4]), and the prevalence of sedentary time ≥8 h/day decreased from 40.5% (95% CI [38.0–42.9]) to 36.0% (95% CI [31.7–40.3]). The proportion reporting no usual source of care modestly declined from 15.5% (95% CI [13.8–17.2]) to 13.6% (95% CI [11.4–15.7]). Fasting glucose distributions were comparatively stable across periods (e.g., glucose ≥126 mg/dL: 12.0% to 12.4%).
Temporal Trends in Testosterone Deficiency
Age-standardized prevalence of testosterone deficiency declined from 29.3% (95% CI: 27.3–31.2) in 2011–2012% to 22.4% (95% CI: 19.7–25.1) in 2021–2023. A statistically significant downward trend persisted after age standardization, demonstrating a declining trend over time (P-trend < .01; Figure 3). This decline suggests meaningful temporal shifts in the factors influencing testosterone levels or broader health behaviors among men during this period.

Age-Standardized Prevalence of Testosterone Deficiency (Serum Testosterone <300 ng/dL) Among U.S. Adult Men Across Four NHANES Cycles From 2011 to 2023.
HbA1c-Based Sensitivity Analysis
In sensitivity models that replaced fasting glucose with HbA1c categories and used rescaled MEC examination weights, associations between metabolic dysregulation and testosterone deficiency remained strong. Compared with men with HbA1c <5.7%, those with HbA1c 5.7%–<6.5% and ≥6.5% had higher odds of deficiency, closely paralleling the pattern observed for impaired fasting glucose and diabetes in the main model, noted in Supplementary Table S1; Supplementary Figure S1. Other SoDH and behavioral associations were directionally consistent with the primary analysis, supporting the robustness of findings across alternative glycemic indicators.
Sensitivity Analysis Using SHBG and FAI
Sensitivity analyses using alternative androgen definitions produced results that were consistent with the primary findings based on total serum testosterone. When analyses were conducted among men with available SHBG data, obesity remained strongly associated with testosterone deficiency (AOR = 3.24, 95% CI [2.33, 4.50]). Diabetes-range fasting glucose was also associated with higher odds of testosterone deficiency compared with fasting glucose <100 mg/dL (AOR = 2.65, 95% CI [1.20, 5.85]). Health insurance coverage was associated with increased odds of testosterone deficiency in this sensitivity analysis (AOR = 1.69, 95% CI [1.20, 2.37]). Current smoking remained directionally associated with lower odds of testosterone deficiency, although this association did not reach statistical significance.
When FAI was evaluated as an alternative outcome, obesity was again associated with higher odds of androgen deficiency (AOR = 1.71, 95% CI [1.28, 2.28]). Lower educational attainment was associated with increased odds of low Free Androgen Index, most notably among men with less than a high school education (AOR = 1.70, 95% CI [1.05, 2.73]). Race and ethnicity was associated with low Free Androgen Index for men identifying as Other or Multi-Racial compared with Non-Hispanic White men (AOR = 0.59, 95% CI [0.38, 0.90]). Together, these findings demonstrate that key metabolic and social associations observed in the primary analysis persist when alternative androgen measures are applied.
Discussion
This nationally representative study of U.S. adult men across NHANES cycles from 2011 to 2016 and again from 2021 to 2023 highlights testosterone deficiency as a biopsychosocial phenomenon rather than a purely biological disorder. Nearly one in four men met criteria for low testosterone during the study period, but prevalence declined significantly, suggesting potential shifts in population health, health behaviors, or sociocultural context that warrant further investigation.
The observed decline in age-standardized testosterone deficiency prevalence occurred alongside measurable shifts in several population characteristics seen in Supplementary Table S7. Notably, age-standardized current smoking declined substantially and sedentary time ≥8 h/day decreased, while usual source of care modestly improved; fasting glucose distributions were largely stable. In contrast, obesity prevalence increased over the same period. Taken together, these patterns suggest that the downward prevalence trend is unlikely to be explained by concurrent improvements in adiposity or glycemic status and may instead reflect a combination of behavioral shifts, health care utilization patterns, residual unmeasured factors, and/or changes in the composition of untreated men captured in NHANES. Because these data are cross-sectional and the contrasts are descriptive, they should be interpreted as contextual correlates of the temporal trend rather than causal drivers. Finally, while Supplementary Table S7 documents period-specific shifts in key risk factors, these descriptive contrasts do not constitute a formal decomposition of the prevalence trend; causal attribution of changes over time is not possible with repeated cross-sectional NHANES data.
Consistent with prior research, metabolic indicators such as obesity and impaired glucose regulation were strongly associated with testosterone deficiency (Dhindsa et al., 2021; Khalil et al., 2024). These findings affirm the bidirectional relationship between testosterone and metabolic health: low testosterone can exacerbate adiposity and insulin resistance, while obesity and systemic inflammation may suppress hypothalamic-pituitary-gonadal axis activity (Rao et al., 2013). Prolonged sedentary behavior also emerged as a significant risk factor, supporting evidence that physical inactivity undermines male hormonal health (Cai et al., 2025). Impaired sleep showed directional associations with testosterone deficiency but did not remain independently significant after multivariable adjustment, suggesting that its effects may be mediated through related metabolic and behavioral pathways, consistent with prior evidence that sleep restriction disrupts testosterone regulation (Patel et al., 2019).
Reliance on a single total testosterone threshold may introduce misclassification, particularly in men with altered sex hormone binding globulin levels due to obesity, metabolic disease, or aging. To address this concern, we conducted sensitivity analyses using SHGB–based androgen measures where available. The persistence of strong associations between obesity and androgen deficiency across both total testosterone and FAI definitions suggests that the primary findings are not driven by measurement artifact or threshold effects. The consistency of metabolic associations supports a biological link between adiposity, glycemic dysregulation, and impaired androgen status, regardless of whether total or bioavailable testosterone is considered. These results strengthen inference by demonstrating robustness to alternative androgen definitions and mitigate concerns regarding misclassification bias inherent to total testosterone–based phenotyping in population studies.
Beyond metabolic risk, our findings underscore the importance of relational and social contexts in shaping testosterone regulation. Men who were married or partnered demonstrated higher odds of testosterone deficiency compared with those who had never been married, consistent with evolutionary and psychosocial models suggesting that testosterone levels may decline in the context of pair bonding, caregiving, and emotional investment in long-term relationships (Gettler, 2019). Such adaptive downregulation may facilitate affiliative behaviors and parental investment; however, reverse causation is also plausible. Men with lower baseline testosterone may experience diminished libido, mood, or competitiveness, which could influence their likelihood of entering or maintaining a partnership. Both biological and behavioral mechanisms are likely operative and merit investigation through longitudinal and mechanistic studies (Djalovski et al., 2021).
Interestingly, men who were never married or who were widowed, divorced, or separated exhibited lower odds of testosterone deficiency, emphasizing that relational status interacts with endocrine function in complex, bidirectional ways. From a gender-theoretical perspective, reduced testosterone among partnered men may reflect an adaptive response to decreased masculine competition or mating effort (Zilioli & Bird, 2017). Future research should further examine how social role transitions, such as marriage, divorce, or bereavement, mediate or moderate hormonal trajectories across the lifespan.
Health care access was another important contextual factor. Men without a usual source of care were more likely to experience testosterone deficiency, underscoring the role of routine health care in detection and prevention. After multivariable adjustment, education, income, and employment status were not independently associated with testosterone deficiency. However, these null findings should be interpreted cautiously, as measurement limitations, broad category definitions, and residual confounding may attenuate true underlying associations. More granular measures of socioeconomic position and longitudinal designs may be better suited to detect subtle or cumulative socioeconomic effects on androgen regulation. (Bedgood et al., 2014; Turan et al., 2015).
Smoking revealed a counterintuitive pattern, with current smokers exhibiting lower odds of testosterone deficiency. This inverse association should be interpreted cautiously, as residual confounding by leanness, given lower average BMI among smokers, and smoking-related elevations in SHBG may artifactually inflate total testosterone levels without reflecting true androgenic status. Although the clinical implications remain uncertain, these findings echo prior evidence of complex interactions between nicotine exposure and endocrine function. Nicotine may act through several androgen-relevant pathways, including stimulation of gonadotropin release, reduced aromatization of testosterone to estradiol, and structural similarity to steroid metabolites, which may partially mimic androgenic effects (Wang et al., 2013). However, these associations may also reflect survival bias and unmeasured confounding, such as differential health behaviors or comorbidities among long-term smokers. These mechanisms highlight the need for mechanistic studies disentangling nicotine’s endocrine effects from its well-established health risks.
Taken together, these results suggest that testosterone functions not only as a physiological biomarker but also as a social signal of masculinity in context. Although the study was structured around the Healthy People 2030 SoDH domains, most socioeconomic indicators were not significant, suggesting that testosterone may be more sensitive to behavioral and health care access factors than to structural conditions such as education or income. Alternatively, current SoDH measures may not fully capture psychosocial or cultural dimensions of masculinity that influence hormonal regulation. Overall, testosterone appears responsive to metabolic health, relational roles, and behavioral choices, with sleep likely operating as a contextual or downstream correlate rather than an independent predictor, consistent with emerging frameworks that view testosterone as part of a gendered stress-response system dynamically shaped by biology, behavior, and sociocultural pressures (van Anders, 2013).
Limitations
This study should be interpreted considering several limitations. First, its cross-sectional design precludes causal inference. While excluded 2017–2020 data used a distinct assay, 2011–2016 and 2021–2023 cycles employed isotope dilution LC–MS/MS or harmonized equivalents. Minor differences in calibration or lot standardization could influence comparability across cycles and should be considered when interpreting temporal trends. And with robust associations between testosterone deficiency and behavioral or social variables, the temporal direction of these relationships cannot be determined. For instance, low testosterone may influence social outcomes such as relationship status or employment, rather than the reverse.
Second, testosterone deficiency was defined using total serum testosterone due to the lack of consistent free or bioavailable testosterone measures across all NHANES cycles, which may underestimate deficiency in individuals with altered sex hormone–binding globulin levels (Guzelce et al., 2022). In addition, testosterone exhibits diurnal variation, with concentrations typically declining by approximately 20–35% from morning to afternoon (Pastuszak et al., 2022). Because NHANES blood samples are collected at varying times of day and blood-draw timing is not uniformly standardized across survey cycles, residual measurement variability related to diurnal fluctuation may persist, potentially modestly influencing prevalence estimates and temporal or subgroup comparisons.
Third, important predictors, including masculinity-related constructs such as perceived gender role conflict, social dominance orientation, or internalized norms, were not measured in NHANES. These psychosocial dimensions are critical to understanding how men physiologically respond to stress, identity strain, and societal expectations, and their absence limits the scope of interpretation.
Fourth, several key variables, including sleep duration, sedentary behavior, and depressive symptoms, were self-reported and may be subject to recall or reporting bias. Contrary to prior studies linking depression and testosterone deficiency, PHQ-2 scores were not significantly associated (Vartolomei et al., 2020). The brevity of this two-item screening tool may limit sensitivity to subthreshold depressive symptoms, and low prevalence of positive screens could reduce statistical power to detect associations.
Fifth, men using testosterone therapy were excluded to avoid confounding, but this may limit generalizability to populations with clinically treated hypogonadism. Only 0.1% of men were excluded due to exogenous testosterone use, a figure likely reflecting underreporting, as real-world data suggest that testosterone therapy remains relatively common among older U.S. men despite limited diagnostic testing and frequent off-label prescribing (Zhou et al., 2020). This could bias the analytic sample toward untreated or milder deficiency cases, potentially attenuating associations and underestimating overall prevalence. And although prescription records were used to exclude reported testosterone therapy, under-ascertainment of exogenous testosterone use is possible; however, sensitivity analyses excluding men with implausibly high total testosterone concentrations (>1000 ng/dL) yielded materially unchanged results.
Finally, while NHANES provides a highly generalizable sample of the U.S. non-institutionalized population, it may not reflect testosterone-related experiences among incarcerated, homeless, military, or transgender individuals, groups with distinct sociobiological stressors related to masculinity and identity (DuBois & Juster, 2022; Horn et al., 2014).
Conclusion
Testosterone deficiency is not simply a biomarker of aging or disease but may indicate how men embody health, behavior, and social roles (Sternbach, 1998). In this nationally representative study, obesity, elevated fasting glucose, impaired sleep, and prolonged sedentary behavior emerged as the strongest biological and behavioral predictors of deficiency, consistent with prior evidence linking metabolic dysfunction to suppression of the hypothalamic-pituitary-gonadal axis (Khalil et al., 2024). Current smoking was associated with lower odds of testosterone deficiency, echoing prior evidence that smokers may have higher circulating testosterone due to nicotine’s endocrine effects, although its clinical relevance remains uncertain given the overwhelming health risks of tobacco use (Wang et al., 2013).
Among social determinants of health, lack of a usual source of care significantly increased odds of testosterone deficiency, underscoring the importance of health care engagement for men’s hormonal health. Marital status also mattered: men who were never married or widowed/divorced/separated had lower odds of deficiency compared with married or partnered men, consistent with psychosocial and evolutionary theories suggesting testosterone adapts to relational roles and caretaking responsibilities (Gettler, 2019; Zilioli & Bird, 2017). By contrast, conventional socioeconomic indicators, such as education, income, and employment status, were not independently associated, suggesting that testosterone may be shaped more by men’s lived experiences and relational contexts than by structural resources alone (Yeap et al., 2021).
Although a universal 300 ng/dL threshold was applied for comparability, this criterion may not capture clinically meaningful variation across demographic or metabolic strata. The threshold was retained to align with clinical guidelines, but our findings support calls to contextualize testosterone levels within individual metabolic and psychosocial profiles rather than rely on a single absolute value. As recent expert recommendations emphasize, deficiency should be contextualized within demographic, metabolic, and psychosocial profiles rather than reduced to a single laboratory cutoff (Khera et al., 2025). The observed decline in testosterone deficiency prevalence from 2011–2012 to 2021–2023 further highlights shifting dynamics in men’s health. This trend may reflect changes in health behaviors, health care access, and evolving norms of masculinity, self-care, and emotional expression. Greater awareness, clinical guideline updates, and broader recognition of testosterone therapy have also likely influenced how androgen deficiency is detected and managed (Layton et al., 2017).
Taken together, these findings reinforce that testosterone operates as both a biological and social signal of men’s well-being. It is sensitive to metabolic state, behavioral patterns, health care access, and relational positioning, but less responsive to traditional socioeconomic markers. While cross-sectional data preclude causal inference, these patterns suggest that men’s hormonal profiles are intertwined with their lived social and relational contexts, warranting interdisciplinary approaches to future research.
Supplemental Material
sj-docx-1-jmh-10.1177_15579883261433808 – Supplemental material for Unmasking Masculinity: Biological, Behavioral, and Social Determinants of Testosterone Deficiency in U.S. Men, 2011–2023
Supplemental material, sj-docx-1-jmh-10.1177_15579883261433808 for Unmasking Masculinity: Biological, Behavioral, and Social Determinants of Testosterone Deficiency in U.S. Men, 2011–2023 by Andrew J. Goulian, Atieh Ashkezari, and Sriram V. Eleswarapu in American Journal of Men's Health
Footnotes
Acknowledgements
The authors acknowledge the National Center for Health Statistics (NCHS) and the Centers for Disease Control and Prevention (CDC) for providing access to the NHANES datasets, as well as the survey participants for their contributions. We also thank the faculty and staff at California Northstate University College of Medicine for their support throughout the study.
Authors’ Note
This research was conducted during Andrew J. Goulian’s affiliation with California Northstate University College of Medicine and the United States Navy Graduate Medical Education Program.
Ethical Considerations
This study used publicly available, de-identified data from the U.S. National Health and Nutrition Examination Survey (NHANES), administered by the National Center for Health Statistics (NCHS) of the Centers for Disease Control and Prevention (CDC). NHANES protocols were reviewed and approved by the NCHS Research Ethics Review Board. Because the present study involved secondary analysis of fully de-identified publicly available data, it was exempt from additional institutional review board review.
Informed Consent
Written informed consent was obtained from all NHANES participants at the time of data collection by the National Center for Health Statistics.
Funding
The authors received no financial support for the research, authorship, and/or publication of this article.
Declaration of Conflicting Interests
The authors declared no potential conflicts of interest with respect to the research, authorship, and/or publication of this article.
Data Availability Statement
Supplemental Material
Supplemental material for this article is available online.
Additional Identifying Information
None.