
Abstract
Diabetic erectile dysfunction (DMED) is a complex condition primarily characterized by impaired vasodilation and inadequate blood perfusion. As of 2023, the available techniques for evaluating vascular function are limited. Intracavernous pressure (ICP) measurement is regarded as the gold standard for assessing erectile function in animals, yet this approach struggles to differentiate between vascular endothelial dysfunction and smooth muscle dysfunction. This study assessed erectile function in DMED rats and analyzed the hemorheology of the penile corpus cavernosum in conjunction with laser speckle blood perfusion imaging (LSBPI). The vasomotor function of the internal iliac artery (IIA) was evaluated using ex vivo microvascular tension measurement. Masson staining was applied to investigate structural alterations in the IIA and cavernous arteries, and immunofluorescence was utilized to measure the protein expression levels of vascular cell adhesion molecule (VCAM), vascular endothelial growth factor (VEGF), and endothelial nitric oxide synthase (eNOS), revealing vascular functional status at both tissue and molecular levels. The model group showed lower ICP values, diminished blood flow, and reduced vasoconstrictive capacity compared to the control group. High-potassium stimulation caused a more pronounced decrease in vascular tension in the model group. Sodium nitroprusside produced comparable vasodilatory responses in both groups; following incubation with N-nitro-L-arginine methyl ester, the model group demonstrated decreased vascular tension. The model group exhibited fibrosis in penile tissue, elevated levels of VCAM-1 and VEGF, and decreased expression of eNOS protein. The integration of ICP with LSBPI and vascular tensiometry enables simultaneous in vivo hemodynamic monitoring and ex vivo functional dissection of endothelial-smooth muscle interactions in DMED.
Keywords
Introduction
Vascular lesions and endothelial dysfunction form the fundamental pathological basis of diabetic erectile dysfunction (DMED), highlighting the importance of evaluating vascular function in experimental animals for research on DMED. Existing techniques for evaluating vascular function in experimental animals remain somewhat limited. Since the seminal work of Quinlan et al. (1989), intracavernous pressure (ICP) testing has been widely accepted as the gold standard for evaluating erectile function in experimental animals (Rehman et al., 1998). A previous report has demonstrated that laser speckle blood perfusion imaging (LSBPI) can be used to monitor blood flow changes in the corpus cavernosum before ICP testing to evaluate the erectile function of rats with neurotraumatic erectile dysfunction (ED) (Zhou et al., 2022). Although this method preserves the corpus cavernosum structure’s integrity, it is convenient for subsequent ICP testing or histopathological specimen collection.
Vascular pathologies induced by diabetes constitute a critical pathological foundation of DMED, largely linked to endothelial dysfunction. Endothelial cells are essential in modulating vascular tone, blood flow, and inflammatory reactions. Diabetes-induced hyperglycemia, oxidative stress, and inflammatory responses damage endothelial cell function, resulting in decreased nitric oxide (NO) generation and impaired vasodilatory function. Detecting erectile function in DMED animal models remains challenging because of the complexity of the disease, which is mainly caused by endothelial dysfunction. It is not sufficient to evaluate based solely on the overall vascular response of experimental animals because it is difficult to distinguish between endothelial and smooth muscle dysfunction. A more thorough examination of the function of fresh blood vessels in vitro at the tissue level is needed to fully evaluate the erectile function of DMED rats. The in vitro microvascular tensiometer is utilized to record tension changes in blood vessels, serving as a fundamental experimental tool for studying vascular function. Using vasoactive drugs in a bath, the device accurately detects and distinguishes between vascular endothelial and smooth muscle functions (Lu & Kassab, 2011; Wenceslau et al., 2021). This helps to identify and differentiate dystonia caused by the endothelium or smooth muscle more precisely. As of 2023, this device is extensively used in cardiovascular research (Ahmad et al., 2022; Liao et al., 2021; Xiao et al., 2015). While some researchers have integrated this system with ICP measurements to assess erectile function in aging rats (Alves-Lopes et al., 2017; Hannan et al., 2010), the combined use of myography and LSBPI for evaluating erectile function in rats with DMED has not been explored.
This study aims to validate a hierarchical evaluation strategy by using ICP as a baseline indicator, analyzing hemodynamic characteristics through LSBPI, and combining ex vivo microvascular tension measurements to identify endothelial functional defects to a more refined tool for studying the pathological mechanisms of DMED.
Method
Laboratory Animals
Thirty healthy Sprague Dawley (SD) rats, weighing 250 ± 10 g and aged 3 months, were obtained from Shanghai Slack Laboratory Animal Co., Ltd. (SCXK [Shanghai] 2022 - 0004). The rats were housed and cared for at the Experimental Animal Centre of Zhejiang University of Traditional Chinese Medicine (license number: SYXK [Zhejiang] 2021-0012). The rats were fed a standard pellet diet and had access to drinking water. The temperature was kept at 23 ± 2℃, with a humidity level of 60%, and a 12-h light-dark cycle was maintained.
Establishment of Experimental Grouping and Model
Establishment of Diabetic Rat Model
Thirty specific pathogen-free SD rats underwent adaptive feeding for 1 week. After an overnight fast, 20 SD rats were randomly chosen and intraperitoneally injected with 60 mg/kg streptozotocin (STZ; Sigma-Aldrich Chemical Co, St. Louis, MO, USA). The remaining 10 rats formed the normal control group and received intraperitoneal injections of citrate-phosphate buffer. Tail blood samples were collected 72 h and 1 week post drug injection, and blood glucose levels were measured using the Roche Glucose Meter (ACCU-CHEK Performa; Roche Diagnostics). Rats with blood glucose levels ≥ 16.7 mmol/L on two occasions were considered diabetic.
No deaths occurred during detection. Sixteen rats had high blood glucose levels after 3 days, and one had lower levels after 1 week. Overall, 15 diabetic rats were identified. The control group of rats remained healthy with no deaths. Fifteen diabetic rats were given an 8-week high-fat diet to induce ED. High-fat diet formula D12492 (Research Diets, USA) was used, with a fat energy ratio of 60% (primarily composed of lard and soybean oil), a carbohydrate energy ratio of 20%, and a protein energy ratio of 20%. In addition, 2% cholesterol was added to the feed to enhance the atherosclerosis model. Continuous feeding for 8 weeks was conducted to induce diabetic vascular lesions.
Screening of DMED Rats
Fifteen diabetic rats underwent an 8-week high-fat diet to induce ED. Subsequently, erectile function was measured using apomorphine. The rats were first acclimated to a quiet and dark environment for 15 min. Next, diabetic rats received a single subcutaneous injection of 100 μg/kg apomorphine under the soft skin of the neck, and penile erection state and frequency were observed for 30 min. Diabetic rats not exhibiting penile erection within 30 min were categorized as having DMED. Using this criterion, 10 rats were ultimately selected as DMED models.
Laser Speckle Perfusion Imaging of the Corpus Cavernosum
Laser speckle perfusion imaging was performed on two rat groups while stimulating the erectile nerve. Both groups of rats were intramuscularly injected with atropine at 0.2 ml/100 g and, 5 min later, the rats were anesthetized by intraperitoneal injection of Zoletil at 0.2 ml/100 g. Subsequently, the abdominal hair was removed, and iodine disinfection was performed before the procedure. After successful anesthesia induction, rats were positioned supinely, and a midline longitudinal incision was made in the lower abdomen to expose the prostate tissue. The pelvic ganglia and cavernous nerves on the prostate were identified and dissected using a microscope. The foreskin was cut open to expose the corpus cavernosum.
Laser speckle contrast imaging (MoorO2Flo-1, Moor Instruments Ltd., Devon, England) was used to monitor changes in intracavernosal blood flow during the erectile process in rats. The system is equipped with an infrared laser source and a camera with a resolution of 752 × 580 pixels. Each rat was positioned under the camera lens to allow observation of the entire penis. The cavernous nerve was secured using bipolar electric hooks with rubber glove pads, and the laser speckle imaging device host and support were placed in the hood. During imaging, the lens was maintained at a fixed distance of approximately 280 mm from the tissue surface, yielding a field of view of approximately 49.5 × 38.3 mm. The image acquisition parameters were set as follows: exposure time of 20 ms, sampling frequency of 20 Hz, and camera gain of 136. Laser speckle contrast was computed using a spatial algorithm with a calculation window of 5 × 5 pixels. Raw data were smoothed using a time constant of 1.0 seconds, and a grayscale threshold of 20 AU was applied to eliminate background noise.
After preparation, the shutter closed, and blood perfusion imaging began. Once blood flow stabilized, electrical stimulation was applied using preset voltage and current parameters (2.5 V, 15 Hz, and 5 ms; 5 V, 15 Hz, and 5 ms; 7.5 V, 15 Hz, and 5 ms) for 1 min, with a 5-min break between stimulations. A region of interest (ROI) was delineated over the target penile area using MoorO2Floor Review V1.0 (Moor Instruments Ltd., Devon, England), and the time-series data of mean blood perfusion within this ROI were extracted for subsequent statistical analysis. Blood perfusion images of the corpus cavernosum were acquired, with high and low perfusion levels displayed as red and blue, respectively. Cavernous blood flow was automatically analyzed, and the blood flow fluctuation curve was recorded.
ICP Detection of the Corpus Cavernosum
After measuring cavernous perfusion, a three-way tube connected a syringe with 100 U/mL heparin, a disposable 25 G intravenous infusion needle, and an MP160 transducer (BIOPAC MP160). The needle with heparin was inserted into the right side of the penis. Concurrently, the cavernous nerve was re-exposed, and a small separation was made to aid the operation. Bipolar electrical stimulation hooks were used, with specific parameters set. Erectile function was assessed by monitoring changes in ICP.
Mean Arterial Pressure Detection
The carotid artery, adjacent tissues, and nerves were dissected to isolate the right carotid artery. A slipknot was made at the proximal segment of the artery, and the distal end was tied off. A small incision was made at the proximal end of the artery, and a heparin sodium saline-filled PE-50 catheter was inserted using ophthalmic scissors. The proximal slipknot was tied, and the PE-50 tube was connected to a transducer to measure changes in mean arterial pressure (MAP) in rats. ICP and MAP were simultaneously measured to minimize the potential influence of blood pressure on erectile function.
Vascular Tension Testing of Internal Iliac Artery
Rats were euthanized using carbon dioxide (CO2), and the internal iliac artery (IIA), the main vessel of the unilateral cavernous artery, was carefully isolated and clipped under stereoscopic guidance. Subsequently, the excised arteries were transferred to an ice-cold Krebs saline solution containing various components. Next, the loose connective tissue and fat were carefully removed, and the arteries were cut into 2 mm segments to create vascular loops. These loops were then attached to a tungsten filament myograph in a 5 mm metal chamber. To measure changes in vascular loop tension, a Myograph microvascular tonometer (Myograph, DMT620, Denmark) was used under the influence of vasoactive drugs. The chamber, kept at 37°C, contained Krebs buffer and was constantly aerated with a mixture of 95% O2% and 5% CO2. The tissue was tensioned to a resting force of 200 mg (2.0 mN) and allowed to equilibrate for 60 min. Changes in isometric force were recorded using a PowerLab/8SP data acquisition system (charting software, version 5.0; AD Instruments, Colorado Springs, CO, USA).
Post-equilibration, rings were pre-contracted with 60 mM KCl to evaluate the contractility of IIA rings. After establishing a stable contractile tension, we used 10 μmol/L acetylcholine (ACh) to induce relaxation in the vascular rings, repeating the stimulation two times. The rings were washed with Krebs solution at least three times between stimulations. Stability was confirmed if the difference between the contraction and relaxation amplitudes was within 10%, indicating a stable vascular ring reaction and intact tissue structure. After a 30-min stabilization period, the formal experiments began.
Arterial and endothelial integrity were assessed by contracting with phenylephrine (Phe, 1 × 10⁻⁶ mol·L-1) followed by relaxation with ACh (1 × 10⁻⁵ mol·L-1). Endothelium-dependent relaxation was evaluated by measuring the response to ACh (3 × 10⁻⁹ to 1 × 10⁻⁵ mol·L-1) and sodium nitroprusside (SNP, 3 × 10⁻⁹ to 1 × 10⁻⁵ mol·L-1) after vasoconstriction induced by Phe (1 × 10⁻⁵ mol·L-1). The vasodilation percentage was calculated using the following formula:

Here, Contraction 0 represents the initial vessel tension after vasoconstrictor (phenylephrine) treatment, and Contraction 1 represents the tension following vasodilation.
NOS secretion was assessed by measuring the change in vascular tension after N-Nitro-L-arginine methyl ester (L-NAME) incubation. The IIA rings were incubated with 100 mmol/L L-NAME for 30 min, and the contractile tension was recorded upon reaching a stable level.
Pathology of Blood Vessels
Masson Trichrome Staining Procedure
A portion of the penile tissue was removed and cleaned with phosphate-buffered saline (PBS). Subsequently, it was fixed with 4% paraformaldehyde and embedded in paraffin. Thin slices (5 μm) were made and stained with Masson’s trichrome and hematoxylin-eosin. These stains show the smooth muscle cells in red and collagen fibrils in blue. The tissue sections were photographed with a digital camera, and three sections per rat were selected for statistical analysis. Quantitative image analysis was performed using Image-Pro Plus 6.0 software (Media Cybernetics, Rockville, MD, USA).
Vascular Marker Immunofluorescence
To detect the expression of vascular cell adhesion molecule (VCAM), vascular endothelial growth factor (VEGF), and endothelial nitric oxide synthase (eNOS) in rat corpus cavernosum, the slides with tissue wax were dewaxed and rehydrated, followed by the application of 0.03% hydrogen peroxide to remove endogenous peroxidase activity. The slides were incubated at room temperature for 10 min, washed with distilled water, and soaked in PBS for 5 min. The sections were preheated to 37℃ with 0.4% pepsin for 20 min and washed three times with PBS for 5 min each. Next, we added diluted normal goat serum blocking solution dropwise to eliminate non-specific staining, incubated at room temperature for 20 min, and then shook off the liquid.
The primary antibody was added gradually and incubated overnight at 4℃. The sections were then warmed to 37℃ for either 30 min or 1 h. After three 5-min washes with PBS, a fluorescein-labeled secondary antibody was added and incubated at 37℃ for 30 min. The process ended with three final 5-min washes using PBS.
It is important to wash with PBS after incubating both primary and secondary antibodies to remove any unbound fluorescent secondary antibodies. Then, wash with PBS and seal with DAPI solution before capturing images under a fluorescence microscope.
Tissues were processed into 5 μm paraffin slices and stored until utilization. Penis sections were fixed in methyl alcohol for 15 min at 4°C for fluorescence detection. After fixation, sections were washed with PBS and blocked using a mixture of bovine serum albumin and Triton. Antibodies targeting VEGFA (Abcam; 1:200), VCAM-1 (Abcam; 1:250), and eNOS (Abcam; 1:200) were applied during the incubation of penis samples. Following antibody exposure, sections were washed with PBS and incubated with conjugated antibodies for daylight 488 or 555. Nuclei were stained with 4′,6-diamidino-2-phenylindole (Invitrogen) and visualized using a fluorescence microscope. Image-Pro Plus 6.0 software was used to measure fluorescence intensity.
Serum NO and Endothelin-1 Levels
Blood samples were collected from the rats immediately after euthanasia and centrifuged at 3000 rpm for 10 minutes at 25 °C to obtain serum. Serum NO levels were measured using the NO Assay Kit (Microwell Plate Method, A012-1-2, Nanjing Jiancheng Biotech Co., Ltd., China). Endothelin-1
Statistical Analysis
Data normality was assessed using the Shapiro–Wilk test, and the homogeneity of variance across groups was determined by the Levene test. Normally distributed data were presented as mean ± standard deviation (Mean ± SD). Comparisons between groups were conducted using an independent-samples t test (for two groups) or one-way analysis of variance (ANOVA) (for multiple groups), with Tukey’s method for post hoc analysis; non-normal data were evaluated using the Mann–Whitney U test. Statistical analyses and graphical representations were carried out using GraphPad Prism 9.0. A p value < .05 was regarded as statistically significant.
Results
Normal Conditions
Rats with DMED displayed noticeable symptoms, including increased appetite, excessive thirst, frequent urination, slow weight gain, or weight loss. Most rats also showed yellow or discolored fur, a dull appearance, a tendency to close their eyes, reduced activity, and delayed reactions. The control group had reduced water intake and urine output but maintained regular eating patterns, had white and shiny fur, gained weight consistently, and showed increased sensitivity to stimulation.
Body Weight and Blood Glucose Levels in the Two Groups
Body weight and blood glucose level were measured in both groups on days 7, 14, 21, 28, 35, 42, 49, and 56. The control group consistently gained weight, while the weight of the model group remained stable, and the body weight of rats in the model group significantly differed from that of the control group starting on day 14 (p = .001 on day 14; p < .001 on days 21, 28, 35, 42, 49, and 56; Figure 1A). The rats in the model group had significantly higher blood glucose levels than those in the control group 3–7 days after intraperitoneal streptozotocin injection (p < .001; Figure 1B).

Changes in Body Weight, Fasting Blood Glucose, Serum NO, and ET-1 Levels in the Two Groups (N = 10). (A) Weight Changes in the Two Groups, **p < .01 vs. the Model Group. ***p < .001 vs. the Model Group; (B) Changes in Fasting Blood Glucose in the Two Groups, ***p < .001 vs. Model Group; (C) Serum NO Levels in the Two Groups, ***p < .001 vs. Model Group; (D) Serum ET-1 Levels in the Two Groups, ***p < .001 vs. Model Group.
Serological Indexes in the Two Groups
The control group had significantly higher serum NO levels than the model group (4.17 ± 0.80 µmol·L−1 vs. 2.61 ± 0.72 µmol·L−1, p < .001; Figure 1C). The model group had significantly higher endothelin-1 (ET-1) levels than the control group (2310.89 ± 269.62 ng·mL−1 vs. 3395.66 ± 374.75 ng·mL−1, p < .001; Figure 1D).
Anatomical Location of the Cavernous Nerve and LSBPI of the Corpus Cavernosum
Differences in blood perfusion in the corpus cavernosum were observed using cavernous laser speckle flow imaging (Figure 2), which showed distinct variations in blood flow. The basal (868.57 ± 59.56 PU vs. 687.14 ± 122.16 PU, p = .004) and maximum (1242.86 ± 89.39 PU vs. 878.57 ± 75.59 PU, p < .001) mean blood flow in the corpus cavernosum of the model group were significantly lower than those in the control group.

Corpus Cavernosum Perfusion Imaging of the Two Groups of Rats (N = 7). (A) Baseline Blood Flow of the Corpus Cavernosum in the Two Groups Under 0 V, **p < .01 vs. Control Group; (B) Maximum Blood Flow of the Corpus Cavernosum in the Two Groups Under 2.5 V, **p < .001 vs. Control Group; (C–F) Blood Perfusion of the Corpus Cavernosum in the Two Groups Under 0 and 2.5 V Electrical Stimulation.
Blood flow in the corpus cavernosum was measured before and after electrical stimulation of the erectile nerve at various voltages. Significant differences were observed in blood flow between the control and model groups at various voltages (p = .003 in the model group at 2.5 V; p < .001 in the control group at 2.5, 5.0, and 7.5 V in both groups). The maximum average blood flow under different electrical stimulations was markedly lower in the model group than in the control group (p < .001). Detailed information is provided in Figure 3.
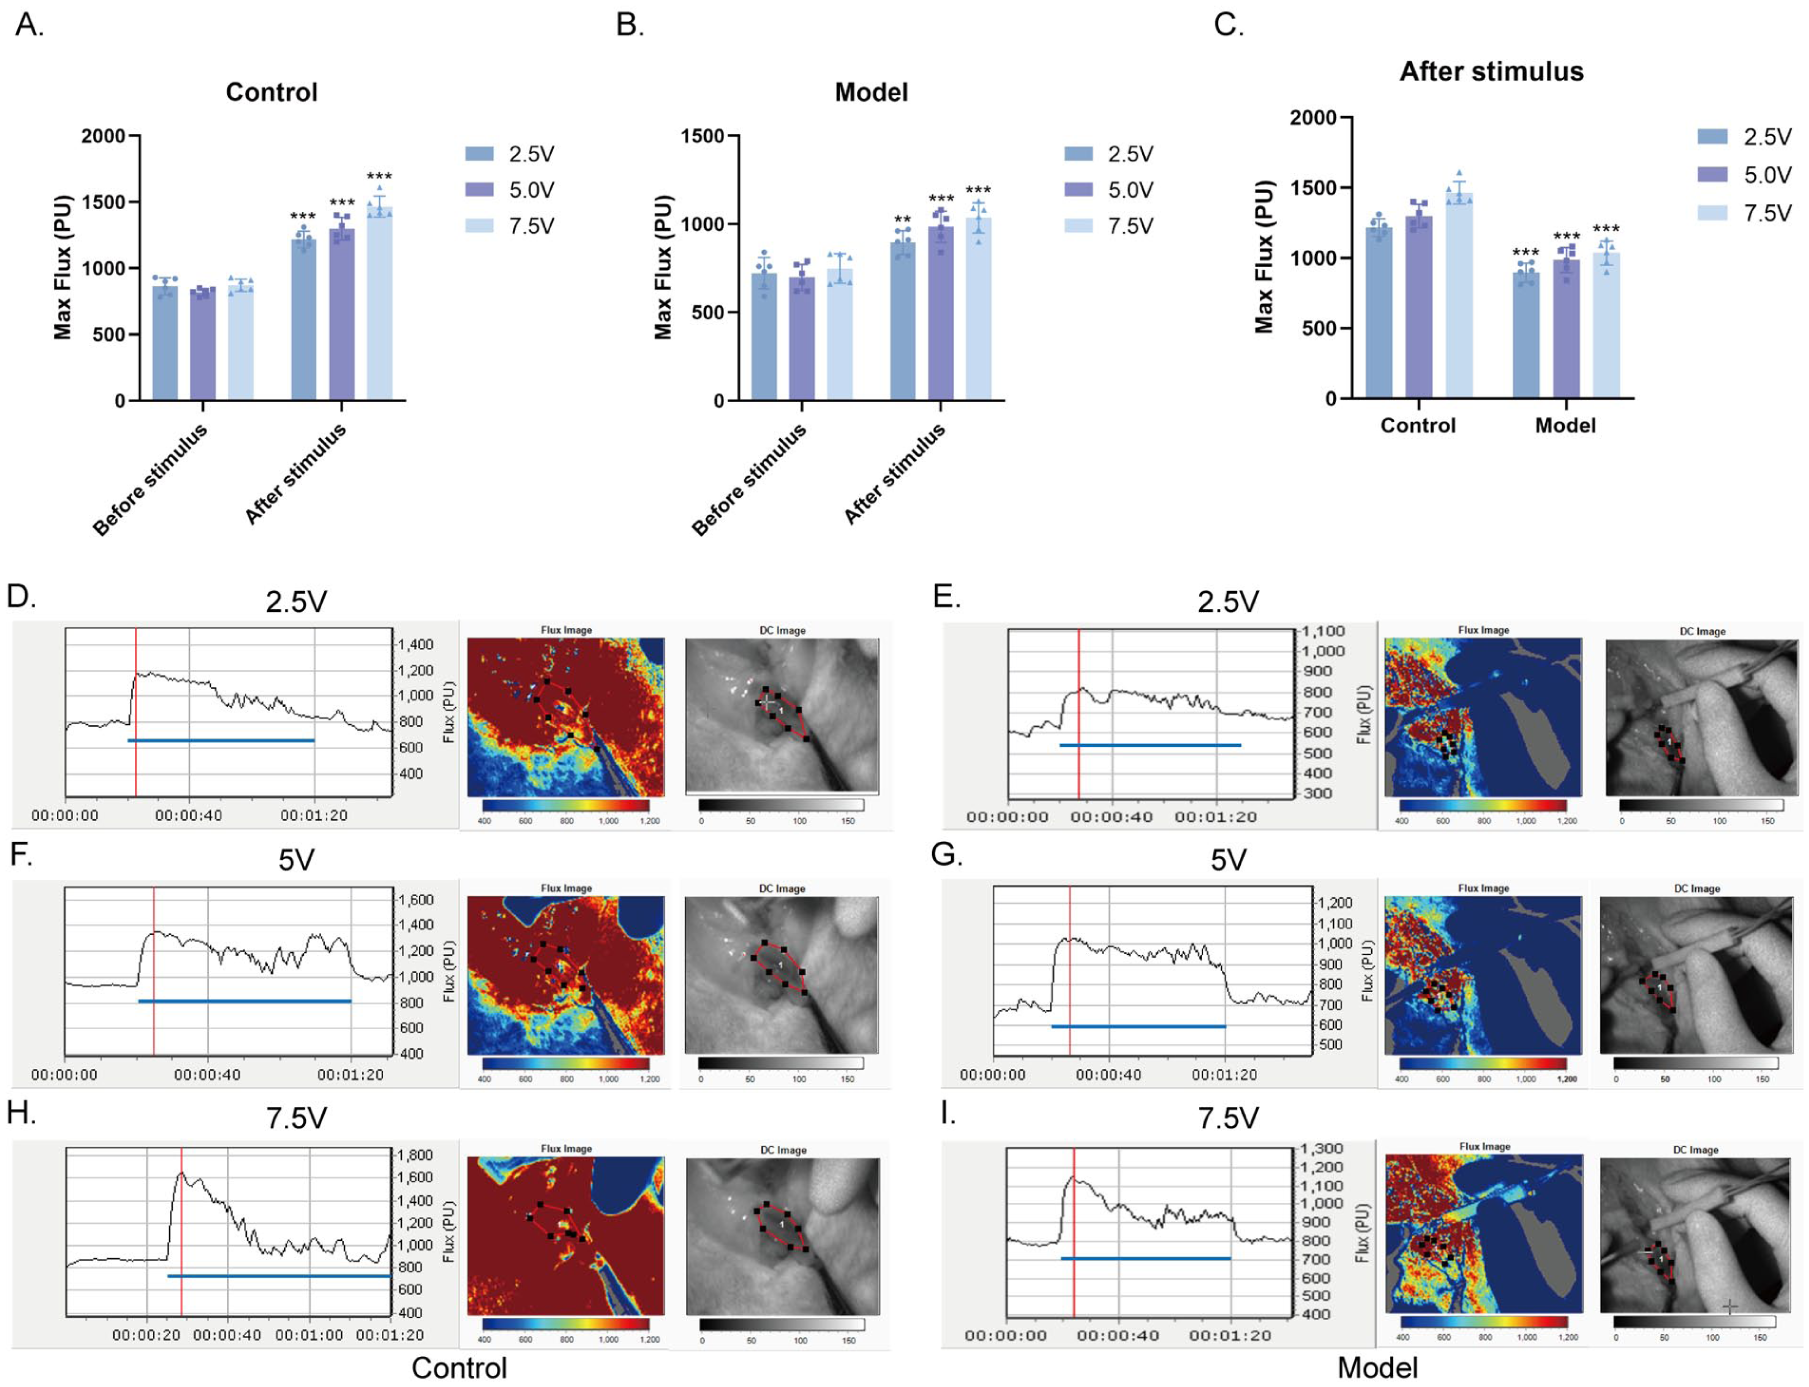
Corpus Cavernosum Perfusion Imaging of the Two Groups of Rats (N = 6). (A) Changes in the Maximum Blood Flow of the Corpus Cavernosum in the Control Group Under 2.5, 5.0, and 7.5 V Electrical Stimulation, ***p < .001 vs. Before Stimulation; (B) Changes in the Maximum Blood Flow of the Corpus Cavernosum in the Model Group Under 2.5, 5.0, and 7.5 V Electrical Stimulation, **p < .01 vs. Before Stimulation, **p < .001 vs. Before Stimulation; (C) Changes in the Maximum Blood Flow of the Corpus Cavernosum After 2.5, 5.0, and 7.5 V Electrical Stimulation, ***p < .001 vs. Control Group; (D–I) Blood Perfusion of the Corpus Cavernosum Under 2.5, 5.0, and 7.5 V Electrical Stimulation.
ICP and MAP Detection
To evaluate erectile function, ICP and MAP curves were recorded at 2.5 V in the two groups (n = 8). This method enabled the objective assessment of erectile function (Figure 4A–D). The results showed a significant decrease in the max ICP (39.19 ± 5.61 mmHg vs. 111.1 ± 6.62 mmHg, p < .001), max ICP/MAP (0.32 ± 0.05 vs. 0.89 ± 0.05, p < .001), and peak slope (2.41 ± 0.33 vs. 6.99 ± 0.34, p < .001) in the model rats compared to controls, indicating severe ED (Figure 4E–G).

Evaluation of Erectile Function Using Intracavernous Pressure Measurement (N = 8). (A–D) The Internal and Arterial Pressures of the Corpus Cavernosum in the Two Groups; (E–G) Maximum ICP, Maximum ICP/MAP, and Peak Slope After Electrical Stimulation. Data Are Expressed as Mean ± Standard Deviation. ***p < .001 vs. Control.
Functional Examination of IIA
A vascular tension tester was used to measure the tension to assess the vasomotor function of the IIA. Changes in tension indicated the effects of vasoactive drugs on contraction and relaxation.
Vasoconstriction Function Test
The maximum tension of the IIA ring was quantitatively analyzed after 60 K stimulation in rats from both groups. The model group had a significantly lower average maximum contraction tension than the control group (16.36 ± 6.38 mN vs. 11.80 ± 1.70 mN, p = .042), as shown in Figure 5A.

Vasoconstriction of the Internal Iliac Artery in the Two Groups. (A) Vasoconstriction at 60 K Stimulation (N = 10), *p < .05 vs. model group; (B) Maximum Vasoconstrictive Tension After L-NAME Incubation (N = 10), *p < .05 vs. model group; (C) Vasoconstriction Under Stimulation With Different Concentrations of Phe (N = 7), *p <.05, **p < .01 vs. Model Group; (D) Vasodilation Percentage Under Different Concentrations of ACh Stimulation (N = 10), *p < .05, **p < .01 vs. Model Group, ***p < .001 vs. model group; (E) Percentage of Vasodilation Stimulated by SNP at Different Concentrations (N = 10).
Different concentrations of Phe solution were added to induce vasoconstriction and assess contractile reactivity. With a concentration of 1 × 10⁻⁶ mol·L−1, vasoconstriction tension in the model group was significantly lower than that in the control group (1.45 ± 0.25 mN vs. 2.39 ± 0.39 mN, p = .003). Similarly, at a concentration of 1 × 10⁻⁵ mol·L−1, vasoconstriction tension in the model group was significantly lower than that in the control group (8.29 ± 1.22 mN vs. 11.34 ± 1.81 mN, p = .030; Figure 5C).
Degree of Endothelium-Dependent Relaxation
The model group showed a significantly lower relaxation response than the control group when stimulated with ACh. The final average vasodilation percentages were 47.6% and 76.2% in the model and control groups, respectively (p < .01; Figure 5D).
The vasodilatory response caused by SNP was used to evaluate vascular smooth muscle function. No significant difference was found in vasodilation between the two groups when treated with SNP at different concentrations (p > .05). The final average vasodilation percentages were 92.5% and 94.4% in the control and model groups, respectively (Figure 5E).
Secretion of NOS in Blood Vessels
Following equilibration of the vascular rings, NOS secretion was evaluated using vasoconstriction induced by L-NAME (N-Nitro-L-arginine methyl ester). The findings revealed that the average maximum contraction tension of the IIA ring in the model group rats was significantly lower than that in the control group (9.34 ± 4.46 mN vs. 17.09 ± 7.27 mN, p = .010; Figure 5B).
Fibrosis of the IIA and Cavernous Artery of the Penis
Compared with the control group, the model group had swollen and disorganized endothelial cells, along with smooth muscle cells and significant collagen buildup. The smooth muscle-to-collagen ratio in the model group was significantly lower than that in the control group (11.10 ± 3.95 % vs. 32.81 ± 4.25 %, p < .001; Figure 6). In addition, penile tissue in the model group displayed endothelial cell swelling and plasma membrane damage. The endothelial and smooth muscle cells in the spongiform tissue of the model group were irregularly arranged. Significant collagen deposition occurred in the cavernous tissue of the model group, signifying severe tissue fibrosis in the penile tissue, with a markedly lower smooth muscle-to-collagen ratio than that in the control group (16.21 ± 1.58 % vs. 37.56 ± 2.64 %, p < .001; Figure 6).

Pathological Sections Showing the Degree of Fibrosis in the Internal Iliac and Cavernous Arteries of the Penis (N = 5). (A) Masson’s Staining of The Cross-Section of the Internal Iliac Artery; (B) Masson’s Staining of the Middle Section of the Corpus Cavernosum, Where Smooth Muscle and Collagen Are Indicated in Red and Blue, Respectively; Bar Graphs Showing the Degree of Fibrosis (Smooth Muscle/Collagen Contents). Data Are Presented as Mean ± Standard Deviation. ***p < .001 vs. control.
Immunofluorescence of Vascular Markers in the Internal Iliac and Cavernous Arteries
To assess endothelial cell injury in the corpus cavernosum caused by DMED, markers, including VCAM, VEGF, and eNOS were used. The protein expression levels and distribution of these markers in the IIA and corpus cavernosum of rats with DMED were analyzed using the tissue immunofluorescence method (Figures 7A and 8A). In the model group, the expression levels of VCAM-1 (0.70 ± 0.06 % vs. 0.49 ± 0.04 %, p = .008) and VEGF (0.72 ± 0.04 % vs. 0.36 ± 0.03 %, p < .001) were significantly upregulated in the IIA, and eNOS protein expression was significantly decreased (0.53 ± 0.03 % vs. 0.74 ± 0.04 %, p = .002) compared with the control group (Figure 7B–D). Similarly, the model group, compared to the control group, demonstrated a notable increase in the expression levels of VCAM-1 (0.60 ± 0.07 % vs. 0.42 ± 0.06 %, p = .029) and VEGF (0.58 ± 0.06 % vs. 0.40 ± 0.04 %, p = .012) within the corpus cavernosum tissue, accompanied by a significant decrease in eNOS protein expression (0.58 ± 0.06 % vs. 0.78 ± 0.05 %, p = .011; Figure 8B–D).

Expression of VEGF, VCAM, and eNOS in the Rat Internal Iliac Artery (N = 3). (A) Fluorescent Staining of VEGF, VCAM, and eNOS in a Cross-Section of the Rat Internal Iliac Artery. The Left and Right Panels Represent the Control and Model Groups, Respectively. Green Staining Indicates Positive Expression of VEGF, VCAM, and eNOS, and Blue Staining Indicates the Nucleus (200×). (B) Area of VEGF Positive Expression; Data Are Expressed as Mean ± Standard Deviation; ***p < .001 vs. Control Group. (C) Area of VCAM Positive Expression, Data Are Expressed as Mean ± Standard Deviation; **p < .01 vs. Control Group. (D) Area of eNOS Positive Expression, Data Are Expressed as Mean ± Standard Deviation; **p < .01 vs. Control Group.
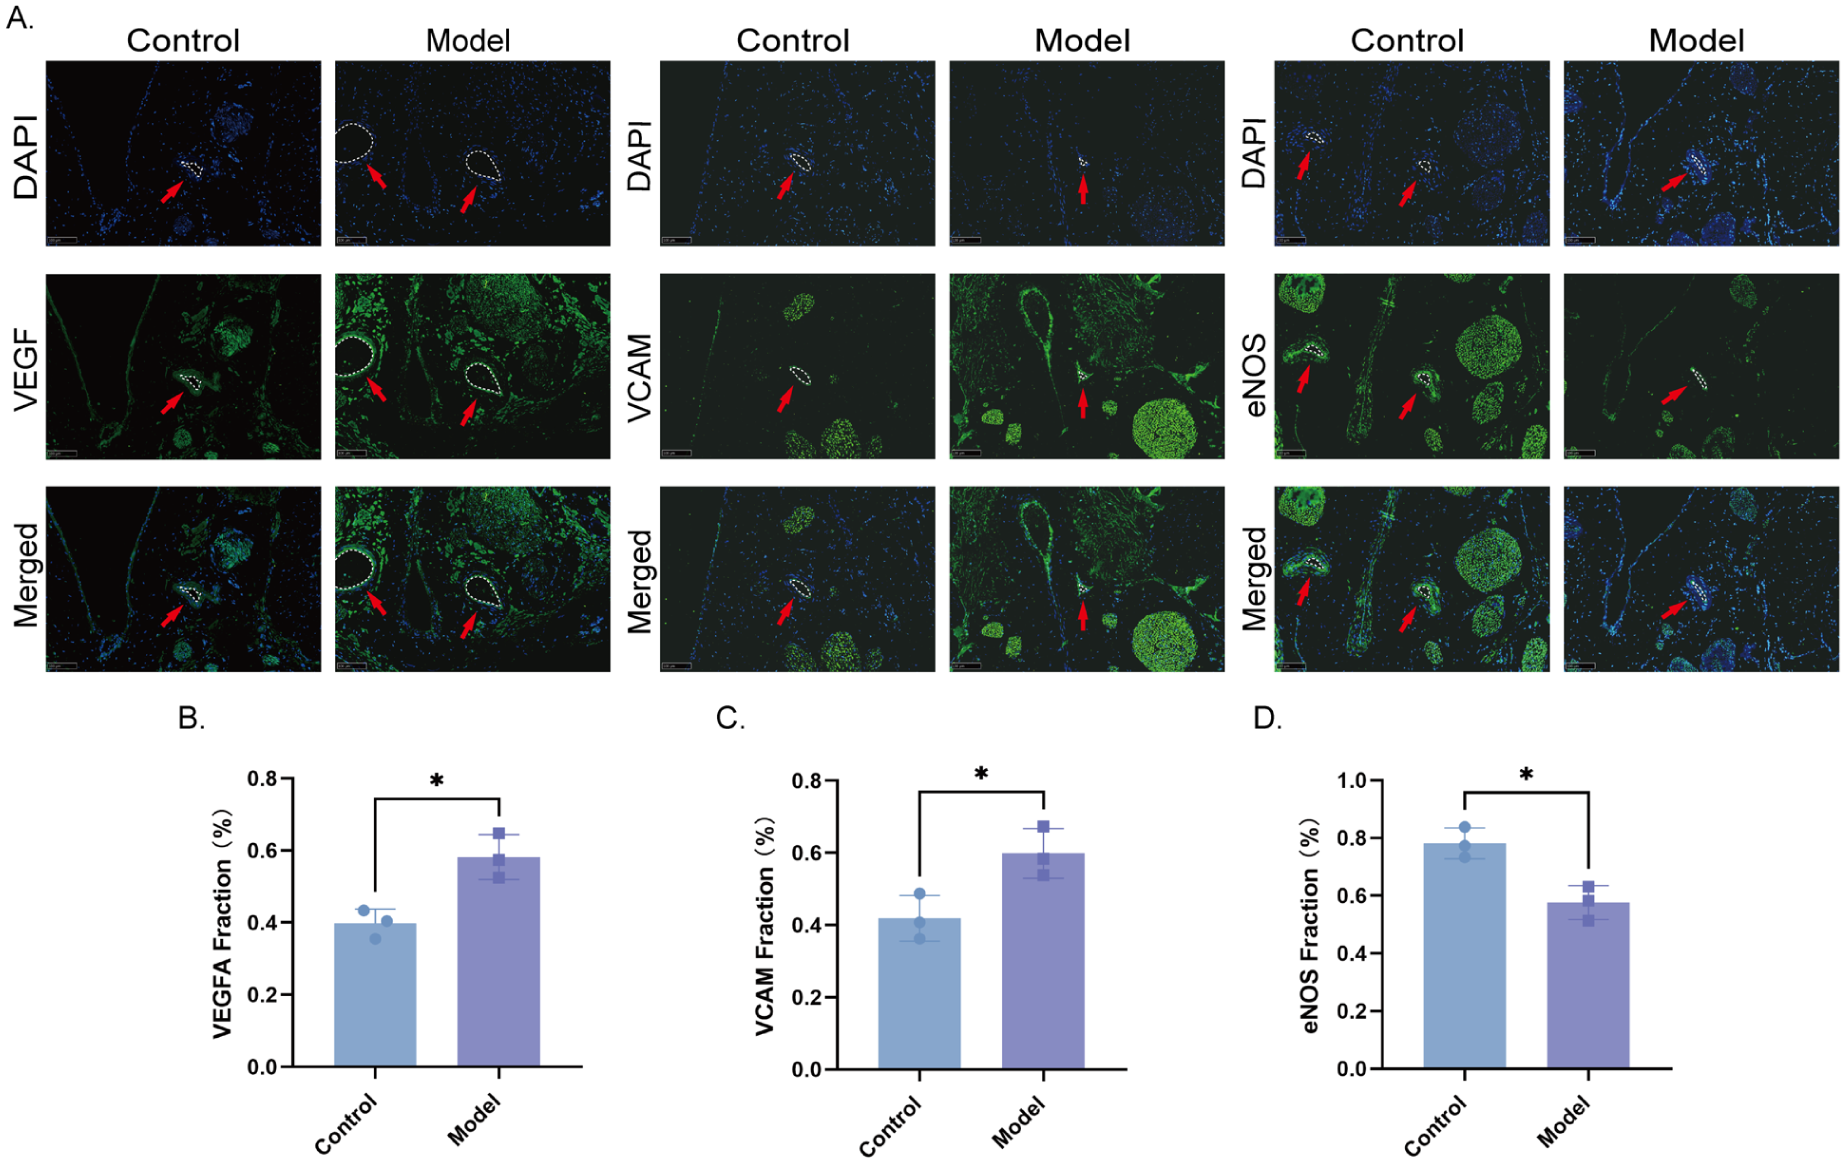
Expression of VEGF, VCAM, and eNOS in the Rat Corpus Cavernosum (N = 3). (A) Fluorescence Staining of VEGF, VCAM, and eNOS in a Cross-Section of the Rat Corpus Cavernosum. The Left and Right Panels Represent the Control and Model Groups, Respectively. Green Staining Indicates positive Expression of VEGF, VCAM, and eNOS, and Blue Staining Indicates the Nucleus (200×). (B) Area of VEGF-Positive Expression; Data Are Expressed as Mean ± Standard Deviation; *p < .05 vs. Control Group. (C) Area of VCAM Positive Expression; Data Are Expressed as Mean ± Standard Deviation; *p < .05 vs. Control Group. (D) Area of eNOS-Positive Expression; Data Are Expressed as Mean ± Standard Deviation; *p < .05 vs. Control Group.
Discussion
The findings of this study revealed a notable reduction in the maximum ICP, basal ICP, and ICP/MAP in the model group, indicating a significant decline in erectile function among diabetic rats compared with the control group. Corpus cavernosum blood perfusion in the model group exhibited a marked decrease relative to that in the control group under varying voltage intensities of erectile nerve stimulation. The maximal contractile force of the IIA ring in the model group was significantly lower than that in the control group when stimulated with high potassium, phenylephrine, or L-NAME. In the model group, the effect of ACh-induced vasodilation was weaker than that in the control group, whereas vasodilation induced by SNP showed no difference, suggesting unchanged smooth muscle function in rats with DMED. Masson’s trichrome staining revealed severe tissue fibrosis in the penile tissues of rats in the model group. Immunofluorescence results showed increased expression of VCAM-1 and VEGF-A in the corpus cavernosum tissue of the model group, along with decreased eNOS protein expression.
By integrating multiple detection methods—ICP to evaluate overall erectile function, LSBPI to assess corpus cavernosum hemodynamics, and ex vivo vascular tension analysis to examine vasomotor activity—this study systematically uncovered the vascular-specific injury pattern in DMED. Endothelial-dependent vasodilation dysfunction is the central defect in DMED, whereas smooth muscle contractile function may be partially retained. This discovery not only confirms the characteristic pathological phenotype of diabetic vascular pathologies but, more significantly, underscores the importance of a “multimodal detection strategy” in investigating the mechanisms of ED.
Hemodynamic Contribution of LSBPI
Through LSBPI, we determined that the hemorheological properties of the corpus cavernosum in diabetic rats under external stimulation are mainly marked by diminished blood flow responsiveness and inadequate baseline perfusion. Under identical electrical stimulation conditions, the peak blood flow in the model group was approximately 70% of that in the control group (Figure 3C), suggesting that diabetes leads to a slow perfusion response of penile blood vessels to neural stimulation. Meanwhile, resting blood flow decreased by 21% (Figure 2A), consistent with the ultrasound characteristics of reduced peak systolic velocity (PSV) in the cavernous arteries of patients clinically diagnosed with DMED (Papadoukakis et al., 2004). This result overcomes the limitation of traditional ICP, which only reflects pressure changes, and visualizes the dynamic blood flow impairment in local organs caused by diabetes in a live model.
Mechanistic Analysis of Vascular Tension Detection
Through the assessment of isolated IIA tension, we discovered that the injury in DMED exhibits a high degree of selectivity. The diabetic milieu specifically impairs the vascular endothelium, demonstrated by the markedly reduced ACh-induced vasodilation in the model group compared to the control group (Figure 5D), whereas SNP stimulation showed no significant difference (Figure 5E). Together with the smaller tension increase in the model group following L-NAME-mediated NOS inhibition (Figure 5B), these results collectively identify eNOS/NO pathway impairment as the central mechanism of the disease. It is noteworthy that the vascular smooth muscle function in the diabetic model seems to be somewhat retained. Despite decreased contractility under high potassium and Phe stimulation (Figures 5A, 5C), the normal response to SNP indicates that the smooth muscle’s sensitivity to NO is not compromised. A potential reason is that prolonged NO deficiency induces hypoxia and oxidative stress in the vascular wall, indirectly damaging the calcium regulatory system of smooth muscle, such as activating voltage-gated calcium channels (VGCC) to trigger Ca2+ influx (Nieves-Cintrón et al., 2021) and the Phe-mediated IP3 pathway to cause intracellular Ca2+ release (Taylor, 2002), without yet impacting the NO-cGMP pathway, resulting in diminished contractile function but retained relaxation capability. This is consistent with the observations of Wei et al. (2012), who documented the retention of smooth muscle phenotype in early diabetes, indicating that the endothelium might be the initial site of injury.
Masson staining demonstrated elevated collagen deposition in the corpus cavernosum of diabetic rats (reduced smooth muscle/collagen ratio, smooth muscle atrophy, Figure 6), as well as decreased eNOS protein expression and heightened levels of VCAM-1 and VEGFA in the corpus cavernosum. These alterations further suggest vascular endothelial damage and dysfunction in the diabetic model, resulting in compromised vascular contraction and relaxation abilities. Research has shown that elevated glucose levels and its metabolites activate vascular endothelial cells, enhancing VEGF secretion, which induces endothelial cell proliferation, heightened permeability, edema, inflammation, and disruption of the endothelial barrier (Morel et al., 2010; Saad et al., 2015; Wongeakin et al., 2014). These observations align with the outcomes of vascular tension assessments in this study. Continuous endothelial cell damage results in elevated VCAM-1 expression, promoting monocyte recruitment and initiating vascular inflammation (D. Y. Li et al., 2013), thereby contributing to diabetic microvascular pathologies such as intimal injury, basement membrane thickening, thrombosis, and platelet and red blood cell aggregation, leading to microcirculatory impairment (Y. Li et al., 2023; Madonna et al., 2017). Advanced glycation end products (AGEs) from high-glucose metabolism directly harm blood vessel walls. This process induces vascular fibrosis and diminishes the elasticity and compliance of cavernous blood vessels, ultimately causing a reduction in cavernous blood perfusion (Cheng et al., 2019; Goldin et al., 2006; Morel et al., 2010). Our findings underscored the significant fibrotic changes in the IIA, cavernous artery, and surrounding tissues in rats with DMED compared with normal rats. In the model group, an increase was found in the ratio of collagen to smooth muscle and VCAM-1 expression in the corpus cavernosum.
The Integrated Value of Multidimensional Assessment
In this study, the integrated use of ICP, LSBPI, and vascular tension to evaluate the neurovascular function of the corpus cavernosum in DMED model rats exhibited notable complementary benefits. ICP, regarded as the “gold standard” for erectile function assessment, delivers a comprehensive functional endpoint; LSBPI captures hemodynamic phenotypes, and vascular tension analysis pinpoints the underlying cause at the cellular signaling level, suggesting potential therapeutic targets. This combined methodology not only deepens mechanistic investigations but also offers experimental support for the clinical development of treatment strategies targeting endothelial repair, such as the combination of PDE5 inhibitors and eNOS activators to enhance therapeutic outcomes.
In this study, we concentrate on the superior vessels of the internal pudendal artery, especially the IIA, due to their ease of manipulation, isolation, and fixation. While the IIA does not directly influence the vascular function of the corpus cavernosum, it plays a direct role in penile blood supply via the internal pudendal artery. Evaluating the vascular function of the IIA offers critical insights into the corpus cavernosum, particularly for diabetic individuals, who face an elevated risk of vascular diseases and damage. Research by Sanad et al. revealed that IIA stenosis is strongly linked to vasculogenic ED, and the extent of IIA system lesions in coronary artery disease patients shows a negative correlation with erectile function scores (five-item version of the International Index of Erectile Function [IIEF-5]; r = −.62, p < .001), indicating that the vascular reactivity of the IIA can be a dependable proxy for penile blood flow impairment in diabetic ED models (Sanad et al., 2020). Using IIA for this assessment is simpler, easier, and less risky, making it a common method. Evaluating erectile function and blood flow in the corpus cavernosum requires careful consideration and may necessitate the additional use of other measurement techniques for a more comprehensive understanding of the physiological processes. Here, we supplemented the investigation with pathological morphological assessments of the cavernous arteries, penile fibrosis, and immunofluorescence analysis of vascular markers in the cavernous arteries.
Limitations
While the results are promising, this study is not without its limitations. First, concerning the selection of blood vessels, while the IIA is readily obtainable and the pudendal artery, a significant branch of the IIA, supplies direct blood flow to the corpus cavernosum, the functional equivalence of the IIA as a substitute for the cavernous artery needs further verification. Second, a fixed resting tension of 2.0 mN was applied to all arterial segments rather than determining an optimal tension for each vessel via a length–tension relationship. This value was chosen because of the markedly reduced body weight and expected vessel diameter of STZ-treated rats compared with larger, healthy animals (Azeez et al., 2021). While appropriate for our model, future studies should establish the length–tension relationship for vessels from diabetic animals to ensure comparability. Third, the effects of varying diabetes durations and other DMED models (e.g., db/db mice, ob/ob mice) on the measured parameters were not investigated. Finally, the precise mechanisms responsible for the decrease in eNOS activity, including AKT phosphorylation inhibition and oxidative stress, warrant more detailed exploration.
Conclusion
The attainment of optimal erectile function relies on the harmonious interaction of the cavernous nerves, blood vessels, and muscles. Our research indicates that the central pathological mechanism in the early to intermediate stages of DMED is predominantly driven by endothelial-dependent NO signaling impairment, rather than a loss of intrinsic smooth muscle function. Furthermore, this study develops a multidimensional and scalable framework for evaluating vascular function in ED: employing ICP as the functional endpoint, LSBPI for dynamic monitoring, and vascular tension assessment as a mechanism analysis tool. This approach not only enhances the comprehension of vascular endothelial dysfunction mechanisms in DMED but, more significantly, offers a methodological framework for the accurate classification and individualized treatment of complex ED.
Supplemental Material
sj-docx-1-jmh-10.1177_15579883251394309 – Supplemental material for Multidimensional Evaluation of Vascular Dysfunction in Diabetic Erectile Dysfunction: Synergistic Application of ICP Measurement, Laser Speckle Blood Perfusion Imaging, and Ex Vivo Microvascular Tension Measurement
Supplemental material, sj-docx-1-jmh-10.1177_15579883251394309 for Multidimensional Evaluation of Vascular Dysfunction in Diabetic Erectile Dysfunction: Synergistic Application of ICP Measurement, Laser Speckle Blood Perfusion Imaging, and Ex Vivo Microvascular Tension Measurement by Siyi Pan, Huangfu Ma, Zhongliao Zeng, Jingwei Wang, Jie Huang and Jianxiong Ma in American Journal of Men's Health
Footnotes
Acknowledgements
We thank the School of Basic Medical Sciences and Public Health, Joint China-US Research Center for Environment and Pulmonary Diseases, and the Academy of Chinese Medical Sciences, Zhejiang Chinese Medical University for providing experimental instruments. We also thank Editage (![]() ) for English language editing.
) for English language editing.
Ethical Considerations
This study followed animal management regulations set by the State Science and Technology Commission of China and received approval from the Animal Experimental Ethics Committee of Zhejiang Chinese Medical University (Ethics Approval Number: IACUC-20220411-12). All experiments were performed in accordance with ARRIVE guidelines.
Informed Consent Statements
Not applicable.
Author Contributions
SYP and JXM conceived and supervised the study; JXM, HFM, and JWW designed and performed the experiments; JXM and SYP analyzed the data and wrote the manuscript; JH and JXM reviewed the manuscript. All the authors reviewed the results and approved the final version of the manuscript.
Funding
The authors disclosed receipt of the following financial support for the research, authorship, and/or publication of this article: This work was financially supported by the Zhejiang Provincial Natural Science Foundation of China (grant number. ZCLMS25H2706), the National Natural Science Foundation of China (grant number 81804092), China Postdoctoral Science Foundation (grant number 2023M743146 and 2025T181077), 2023 National Postdoctoral Research Program (grant number GZC20232373), and China-Japan Friendship Hospital hospital-level project (grant number 2024-ZF-12).
Declaration of Conflicting Interests
The authors declared no potential conflicts of interest with respect to the research, authorship, and/or publication of this article.
Data Availability Statement
Most of the data generated or analyzed during this study are included in this published article. The datasets generated during and analyzed during the current study are available from the corresponding author on reasonable request.
Supplemental Material
Supplemental material for this article is available online.
References
Supplementary Material
Please find the following supplemental material available below.
For Open Access articles published under a Creative Commons License, all supplemental material carries the same license as the article it is associated with.
For non-Open Access articles published, all supplemental material carries a non-exclusive license, and permission requests for re-use of supplemental material or any part of supplemental material shall be sent directly to the copyright owner as specified in the copyright notice associated with the article.