
Abstract
This study is the first to examine the utility of body mass index (BMI) as an indicator of eating disorder (ED) pathology and fitness for employment for professional male fashion models. We assessed the relationship between experimenter-measured BMI, muscle mass, body fat percentage, and ED severity (EDE-Q score) in male models and nonmodels. Except for higher eating concern, the two groups displayed similar EDE-Q scores after controlling for age. Models relative to nonmodels endorsed significantly greater frequency of compulsive exercise and self-induced vomiting as a means of controlling shape or weight. BMI was a poor indicator of body fat percentage in models. Lower BMI in models, and higher BMI in nonmodels, was associated with higher EDE-Q scores. Interestingly, all the male models with clinically significant EDE-Q scores (≥4.0) had >18.5 experimenter-measured BMI. Higher muscle mass in models, and lower muscle mass in nonmodels, was associated with higher EDE-Q scores. Inversely, lower percentage body fat in models, and higher percentage body fat in nonmodels, was associated with higher EDE-Q scores. BMI, muscle mass, and percentage body fat were associated with ED tendencies in male models and nonmodels. Findings also suggest males with clinical ED symptoms would be overlooked if only low BMI (<18.5) was considered. These results may guide the development of more effective mandates to safeguard models’ wellbeing, and men generally.
Eating disorders (EDs) are among the most serious of all psychiatric disorders, taking one life every 52 min (Deloitte, 2020), and may be increasing in prevalence more quickly for men than women (Murray et al., 2017). Body mass index (BMI) below 18.5, in conjunction with assessment of ED symptoms, is often utilized as an indicator of ED onset, relapse, and recovery (e.g., American Psychiatric Association, 2013; Bardone-Cone et al., 2010). While higher BMI at the time of discharge from treatment is related to better prognosis, weight gain trajectory, eating attitudes, and self esteem are also important predictors of relapse and recovery in women (Bardone-Cone et al., 2020; Castro et al., 2004). BMI is also often utilized as an indicator of health, with those who fall in the “overweight” or “obese” ranges (>25) or in the “underweight” ranges (<18.5) being considered unhealthy and denied surgery, life and health insurance, and employment (Arnold et al., 2020; eHealth, 2011; Ferrell et al., 2021; Ponnusamy et al., 2018; Riewald, 2008; U.S. Department of Homeland Security, 2022). However, BMI has been repeatedly demonstrated to be a poor indicator of adiposity and overall health (Mazic et al., 2009; Nuttall, 2015; Provencher et al., 2018; Tomiyama et al., 2016). In fact, the statistician who derived the formula for BMI, Lambert Adolphe Jacques Quetelet, explicitly stated that it should not be used to indicate the level of fatness in an individual (Devlin, 2009; Nuttall, 2015). One study found that nearly half of the individuals classified as overweight or obese by BMI were cardiometabolically healthy (Tomiyama et al., 2016). Thus, using BMI as a proxy for actual health status would misclassify approximately 75 million adults in the United States (Tomiyama et al., 2016).
Prior research has also found that the BMI classification system is not valid in athletic populations (Mazic et al., 2009; Petrie et al., 2008; Provencher et al., 2018). Similarly, BMI has been repeatedly demonstrated to be a poor indicator of body fat in men because it does not account for lean muscle mass and is skewed by height (Nuttall, 2015; Petrie et al., 2008). Despite these limitations, BMI continues to be used as a significant indicator of health. For example, low BMI (<18.5) is used as a single indicator of ED severity in professional fashion models in many countries such as Spain, Italy, and Israel, and has been suggested to be incorporated in the United States as a measure of models’ fitness to work (e.g., Bromberg & Halliwell, 2016; Record & Austin, 2016). Thus, it is important to investigate whether measured BMI is a good primary indicator of ED symptom severity in male models and nonmodels, who are likely to have different body compositions. Also, professional male fashion models represent a high-risk group for EDs due to professional pressure to be both lean and muscular (Preti et al., 2008; Swami & Szmigielska, 2013).
Although eating disorders are observed in individuals across the weight spectrum and not solely in low-weight individuals, some countries have instituted and enforced body laws mandating the body size of fashion models for over a decade (e.g., American Psychiatric Association, 2013; Bardone-Cone et al., 2010; Löwe et al., 2001). First, Spain, Italy, and then Israel passed laws, such as the Weight Restriction Law that requires adult models to have a BMI >18.5, respectively, or risk being fined (e.g., Gladstone, 2016). Similarly, a federal law adopted in France banning those considered to be excessively thin, requires fashion models to acquire a health certificate from a medical provider to work (Damien, 2017; Lavender et al., 2010). While this law does not explicitly require models to reach a minimum BMI, physicians are urged to pay particular attention to models’ BMI in deciding whether or not they are healthy (Damien, 2017). However, the first study to provide normative data for the ED Examination-Questionnaire (EDE-Q) measuring ED severity in 18- to 26-year-old men found that larger male bodies were related to more ED symptoms (Lavender et al., 2010). Notably, it has been demonstrated for over two decades that while males with EDs exhibit significant body dissatisfaction, they are less likely to exhibit a drive for thinness, and more likely to exhibit a drive for muscularity (Carlat et al., 1997; Kelly et al., 2015; Lavender et al., 2017; Pope et al., 1997). Unsurprisingly, men are more likely to engage in atypical weight and shape controlling behaviors such as excessive exercise, consuming food supplements in lieu of food, and maintaining rigid dietary rules related to protein consumption (Compte, 2021; Compte et al., 2015; Strother et al., 2012). As males are more likely to manifest ED behaviors to increase muscle mass, the relationship between BMI and ED pathology in males is likely to be complex.
Advocates for regulation of the fashion industry argue that lack of weight/BMI requirements creates a hazardous work environment (Record & Austin, 2016). However, this argument is not supported by the limited research with professional fashion models. In a review of the literature, Zancu and Enea (2017) found that while models’ BMIs are typically lower than average, there is not a higher incidence of full ED syndrome (Zancu & Enea, 2017). Their results suggest models have greater body satisfaction than nonmodels and this may prove to be an important resilience factor against the development of an ED. Notably, of the six studies evaluated by Zancu and Enea (2017), only one utilized male professional model participants (Brenner & Cunningham, 1992; Zancu & Enea, 2017). Similarly, Zancu et al. (2019) compared professional female fashion models with a matched control group in Romania and found that the two groups had similar levels of body image and eating disturbances. While the fashion models had significantly lower BMIs than the controls, the incidences of disordered eating behaviors across the two groups were similar (Zancu et al., 2019). Furthermore, in a recent study with women, utilization of low BMI (<18.5) to predict ED severity largely miscategorized female fashion models and nonmodels. Most female models and nonmodels with more severe levels of ED symptoms were within the “healthy” BMI range (≥18.5–<25) and would not be identified as needing support according to the proposed BMI threshold (<18.5; Ralph-Nearman et al., 2020).
Collectively, these studies highlight the importance of evaluating these relationships, especially in males. Thus, the current research aims to examine the relationship between BMI and ED symptoms in male professional fashion models. This relationship is particularly relevant given that men are more likely to manifest eating-disordered behavior that maintains lean muscle mass, a pathological picture that may not be well captured by a single health statistic such as BMI.
Predictions
This is the first study to evaluate ED symptomatology in professional male models using experimenter-measured BMI. Consistent with a prior normative male study that found BMI was positively related to ED symptoms on the EDE-Q (Lavender et al., 2010), we predicted that higher BMI would be related to more ED symptoms in males, but that these relationships would vary among groups. Given that BMI has consistently been found to be a poor indicator of adiposity in physically active individuals and men, we predicted that the correlation between BMI and percent body fat would be low, especially in male models (Mazic et al., 2009; Nuttall, 2015; Provencher et al., 2018). In line with two previous studies, which found that males underestimated their BMI, one by underestimating their weight and overestimating their height (Gorber et al., 2007), the other by overestimating their height (Wilson et al., 2019), we predicted that self-reported BMI and experimenter-measured BMI would differ significantly for both male models and nonmodels. Finally, based on emerging work suggesting a drive for a muscular and lean body in males (Compte, 2021; Ralph-Nearman & Filik, 2018), we explored the relationship between measured muscle mass and fat percentage and ED symptom severity and compared these relationships between the model and nonmodel groups.
Method
Participants
Professional male fashion models (n = 62; 18–34 years) and male nonmodels (n = 148; 18–38 years) were recruited in the United Kingdom, through professional modeling agencies and the general population, respectively. The appropriate Ethics Review Board approved the study (Ref: S952).
Procedure
Each participant first gave written informed consent, and then was given a participant code. Then, participants were seated at a computer to complete the ED Examination Questionnaire (EDE-Q 6.0; Fairburn & Beglin, 2008), and asked to complete this as honestly as possible. In addition, models were reminded that their data would not be shared with their modeling agencies. Next, each participant removed any heavy clothing, their height and weight were measured to calculate BMI, and bioimpedance fat percentage and muscle mass were also measured.
Measures
Participants’ height was assessed with a stadiometer, and weight, fat percentage, and muscle mass were assessed with an Innerscan Segmental Body Composition Scale (Tanita, Inc.). In addition, BMI of models and nonmodels was calculated from self-reported height and weight. The Diagnostic and Statistical Manual of Mental Disorders (5th ed.; DSM-5; American Psychiatric Association, 2013) categorizes the low-weight component for an anorexia nervosa diagnosis as extreme (<15 BMI), severe (15–15.99 BMI), moderate (16–16.99 BMI), or mild (≥17 BMI).
The EDE-Q 6.0 (Fairburn & Beglin, 2008) is a validated and reliable 28-item scale that assesses ED symptom severity and frequency over the past 28 days on a 7-point Likert-type scale. The global EDE-Q score is calculated by the average of the four facets measuring ED symptoms (i.e., restraint, weight, eating, and shape concern) and is comparable to the EDE clinical screener (Berg et al., 2012). A more conservative ≥4 cutoff has been used in previous normative studies to indicate clinical levels of ED (e.g., Lavender et al., 2010). EDE-Q Global scores demonstrated high internal consistency with Cronbach’s α for models (.94) and nonmodels (.90).
Statistical Analysis
Continuous variables (group characteristics and EDE-Q scores) were described by the mean and standard deviation or by the median and interquartile range (IQR). Categorical variables (ED behaviors) were summarized by frequency and proportion. Between-group differences on continuous variables were examined using the Mann–Whitney U test, Welch’s t-test, or Welch’s t-test on ranks depending on whether the assumptions of normality and homogeneity of variance were satisfied, as indicated by the Shapiro–Wilk test and Levene’s test (Tomarken & Serlin, 1986; Zimmerman, 1987; Zimmerman & Zumbo, 1993). While nonparametric procedures, such as the Mann–Whitney U test, are better able to control Type I error rates and are generally more powerful than parametric procedures, such as the t-test, when the assumption of normality is violated and the distribution is characterized by excessive kurtosis, nonparametric procedures do not protect against unequal variances, especially when combined with unequal sample sizes (Zimmerman, 1987; Zimmerman & Zumbo, 1993). Simulation studies have found that Welch’s t-test in conjunction with the rank transformation is able to simultaneously counteract violations of normality and homogeneity of variance (Zimmerman & Zumbo, 1993). Thus, nonnormal distributions with equal variances were compared using the Mann–Whitney U test, normal distributions with unequal variances were compared using Welch’s t-test, and nonnormal distributions with unequal variances were compared using Welch’s t-test on ranks. Effect size was estimated using either Cohen’s d with the Welch approximation to the degrees of freedom or
Categorical data were analyzed using Pearson’s Chi-square test and Fisher’s exact test when appropriate. Logistic regression models were used to estimate the odds ratios (ORs) and 95% confidence intervals for associations of eating-related pathology outcomes with the group, before and after adjusting for age. Differences between self-reported and experimenter-measured BMI, height, and weight in models and nonmodels were examined using the Wilcoxon-rank-sum test or the paired Welch’s t-test on ranks. Pearson’s correlations between BMI and body fat percentage (BF%) in male fashion models and nonmodels were calculated and compared to assess the validity of BMI as an indicator of body fat in male fashion models and nonmodels.
Finally, given that the distribution of EDE-Q scores was positively skewed, generalized linear models (GLMs) with the gamma distribution and log link were used to examine the relationship between experimenter-measured BMI and ED symptomatology in models and nonmodels while controlling for age (Nelder & Wedderburn, 1972). The association between muscle mass and ED symptoms and the association between percent body fat and ED symptoms in models and nonmodels were also explored. In the first step, moderated regression analyses were conducted to determine whether group membership affected the relationships between BMI, muscle mass, percent body fat, and ED symptomatology while controlling for age. Next, given that male models and nonmodels are likely to experience different appearance concerns, stratified regression analyses were run to further examine the nature of these relationships in each group (Swami & Szmigielska, 2013).
All statistical analyses were conducted in R (R Core Team, 2021). The rstatix package (Kassambara, 2021) was used to calculate measures of effect size.
Results
There were significant differences between models and nonmodels in age, height, experimenter-measured BMI, and muscle mass (Table 1). Models were significantly older and taller than nonmodels. Models also had lower experimenter-measured BMI and higher muscle mass than nonmodels. The differences between models and nonmodels on height, experimenter-measured BMI, and muscle mass remained significant after regressing out age.
Differences in Characteristics and EDE-Q Scores Between Fashion Models and Nonmodels

Mean (SD), two-sample Welch’s t-test on ranks, and Cohen’s d accounting for heterogeneity of variance. b Mean (SD), two-sample Welch’s t-test, and Cohen’s d accounting for heterogeneity of variance. c Median [IQR], Mann–Whitney U test, and Wilcoxon effect size
Regarding ED symptomatology scores on the EDE-Q, models and nonmodels exhibited significant differences in the restraint and eating concern scores (Table 1). After adjusting for age, fashion models had significantly higher eating concern scores than nonmodels. In contrast, the difference in restraint scores between models and nonmodels was no longer significant when controlling for age.
EDE-Q Dietary Restraint, Binge Eating, Compensations, and Purging Frequency
The results from the chi-square and Fisher’s exact tests indicated that fashion models and nonmodels reported significant differences in the overall frequency of compulsive exercise within the prior 28 days (Table 2). Specifically, the logistic regression analyses indicated that models relative to nonmodels had greater odds of engaging in compulsive exercise in the past 28 days (OR = 2.58, 95% CI: 1.36–5.03) and compulsive exercising 20 or more times in the past 28 days (OR = 3.52, 95% CI: 1.46–8.69) when controlling for age (Table 2). Also, after controlling for age, models also had greater odds of using vomiting as a means of controlling shape or weight in the past 28 days (OR = 6.94, 95% CI: 1.27–52.28) compared to nonmodels (Table 2).
Differences in Eating Disorder Behaviors Within the Prior 28 Days Between Fashion Models and Nonmodels
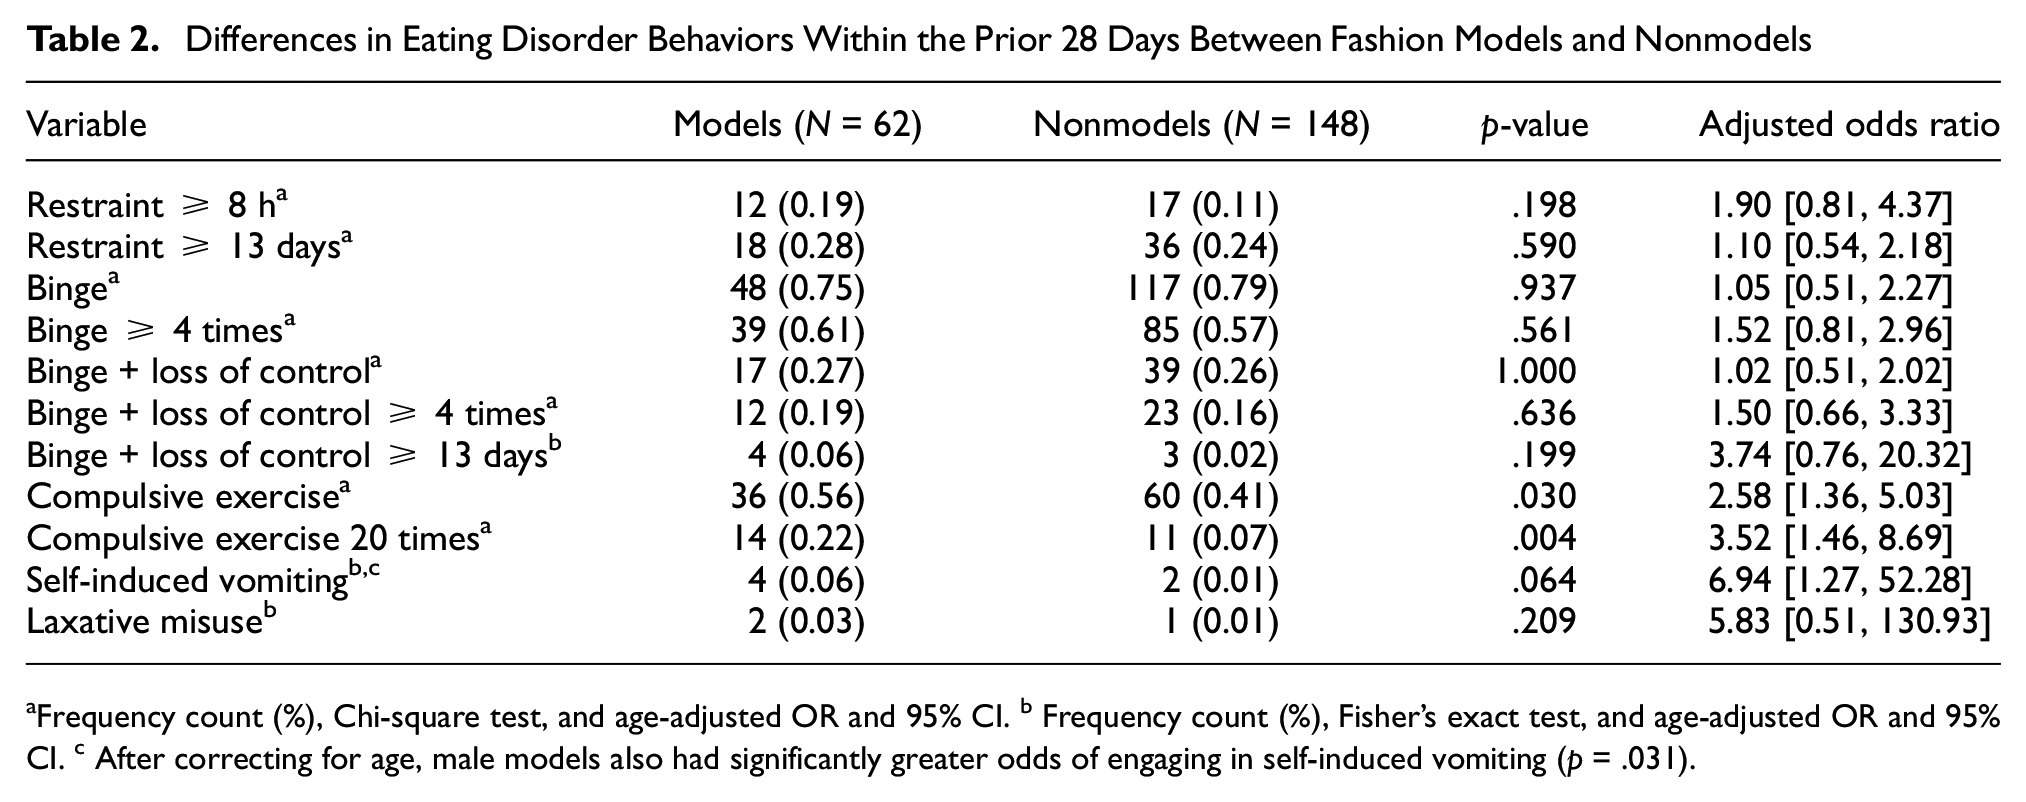
Frequency count (%), Chi-square test, and age-adjusted OR and 95% CI. b Frequency count (%), Fisher’s exact test, and age-adjusted OR and 95% CI. c After correcting for age, male models also had significantly greater odds of engaging in self-induced vomiting (p = .031).
Differences Between Estimated and Experimenter-Measured BMI, Weight, and Height in Models and Nonmodels
Fashion models’ self-reported BMI (median = 21.00, IQR = 2.00) was lower than their experimenter-measured BMI (median = 22.15, IQR = 2.85) with a medium effect size of 0.60 (Wilcoxon signed rank statistic = 1,594.50, p < .001). Fashion models’ self-reported weight (median = 75.00 kg, IQR = 9.00) was lower than their experimenter-measured weight (median = 77.32 kg, IQR = 10.64) with a medium effect size of 0.45 (Wilcoxon signed rank statistic = 1,476.50, p < .001). Models’ self-reported height (median = 187.00 cm, IQR = 4.00) was not significantly different from their experimenter-measured height (median = 186.50 cm, IQR = 5.25) with a small effect size of 0.18 (Wilcoxon signed rank statistic = 633.00, p = .177).
Nonmodels’ self-reported BMI (median = 22.78, IQR = 3.23) was not significantly lower than their experimenter-measured BMI (median = 22.86, IQR = 3.56) with a small effect size of 0.15 (Wilcoxon signed rank statistic = 6,477.50, p = .065). Nonmodels’ self-reported weight (median = 51.30 kg, IQR = 26.53) was lower than their experimenter-measured weight (median = 74.32 kg, IQR = 12.88) with a large effect size of 0.87 (t*= 10.64, p < .001). Nonmodels’ self-reported height (median = 180.32 cm, IQR = 10.14) was higher than their experimenter-measured height (median = 174.20 cm, IQR = 16.65) with a medium effect size of 0.52 (t* = −6.35, p < .001).
Relationship Between BMI and Percent Body Fat
The correlation between BMI and percent body fat in the total sample was r = 0.781 (p < .001). The correlation between BMI and percent body fat was r = 0.961 (p < .001) in nonmodels and r = 0.048 (p = .711) in fashion models. A test of the difference between two correlations based on independent groups confirmed that the correlation between BMI and percent body fat was significantly greater in nonmodels than models (z = 12.23, p < .001).
Relationship Between BMI and EDE-Q Scores
Prior to regression analyses, the data were inspected for outliers. There was a single extreme outlier in the male model group. This individual’s BMI was an outlier with respect to the male model group with a z-score of 3.05 and was removed from subsequent analyses. There was also a single extreme outlier in the nonmodel group. This individual’s percent fat was an outlier with respect to the nonmodel group with a z-score of 6.07 and was removed from subsequent analyses. The GLM analyses revealed that the interaction between group and BMI (β = −0.135, SE = 0.066, p = .042) was significantly associated with ED symptomatology, such that lower BMI was associated with higher EDE-Q scores in fashion models, while higher BMI was associated with higher EDE-Q scores in nonmodels (Figure 1). Stratified analyses indicated that BMI was not significantly associated with ED symptomatology in male fashion models (β = −0.072, SE = 0.067, p = .288). In contrast, BMI was significantly associated with ED symptomatology in nonmodels (β = 0.072, SE = 0.025, p = .005). Of note, there were no models whose measured BMI was below the proposed 18.5 BMI cutoff, and there were only three models whose Global EDE-Q scores were above the clinically significant cutoff on the EDE-Q (

BMI and Eating Disorder Severity Relationships in Models and Nonmodels
Relationship Between Muscle Mass and EDE-Q Scores
The interaction between group and muscle mass (

Muscle Mass and Eating Disorder Severity Relationships in Models and Nonmodels
Given that the distributions of muscle mass in male fashion models (range = 53.50–69.80 kg) and nonmodels (range = 32.00–51.90 kg) did not overlap, we conducted two additional analyses to further examine the relationship between muscle mass and ED symptomatology in male models and nonmodels. First, we tested a piecewise regression model that specified unique intercepts and slopes for each group. The results revealed that the piecewise model was equivalent to the interaction model, suggesting that the interaction model sufficiently explains the relationship between muscle mass and ED symptomatology in models and nonmodels. We also conducted a change point analysis to determine the muscle mass score at which the slope characterizing the relationship between muscle mass and EDE-Q total scores changed. Model estimation was conducted with a Bayesian Monte Carlo Markov Chain approach implemented in R using the mcp package (Lindeløv, 2020). The estimated change-point was 52.52 kg of muscle mass. While the 95% confidence interval was quite large (range = 34.36–69.76 kg), this finding is interesting given that the estimate of the change point lies between the maximum of the distribution of muscle in mass in male nonmodels (51.90 kg) and the minimum of the distribution of muscle mass in male fashion models (53.50 kg).
Relationship Between Percent Body Fat and EDE-Q Scores
The interaction between group and percent body fat (

Fat Percentage and Eating Disorder Severity Relationships in Models and Nonmodels
Discussion
The current study is the first to test whether actual BMI or muscularity or fat percentage is an indicator of ED symptomatology in professional male fashion models and nonmodels. Given that BMI is frequently used as an indicator of body fat percentage, we examined the validity of BMI as a measure of body fat percentage in male fashion models and nonmodels. We also assessed males’ level of accuracy between BMI based on measured height and weight and BMI based on self-reported height and weight. These investigations are important as self-reported or measured BMI is often used in clinical and nonclinical settings as a measure of health, and BMI cutoff (<18.5) laws have been established as fitness for work in models. Although EDs may be rising more quickly in men than women, men are still rarely studied, and there are limited applicable tools related to differing behaviors and body image goals (e.g., drive for muscularity).
Interestingly, in the present study, there was a significant relationship between experimenter-measured BMI and ED symptoms in nonmodels, such that higher experimenter-measured BMI was associated with higher levels of ED symptomatology. Furthermore, the stratified analysis revealed that lower experimenter-measured BMI was associated with higher levels of ED symptomatology in male fashion models; however, the relationship was not statistically significant. Previous studies found a positive relationship between BMI and EDE-Q scores in males (Compte et al., 2015; Lavender et al., 2010), and in professional female fashion models and nonmodels (Ralph-Nearman et al., 2020). The negative relationship between BMI and EDE-Q scores in professional male models may be related to male models’ tendency to overexercise with the goal of decreasing body fat and muscle mass, perhaps to fit into clothing sample sizes provided by fashion designers. Contrastingly, male nonmodels’ positive relationship between BMI and EDE-Q scores may be related to goals of decreasing body fat and increasing muscle mass. After controlling for age, models and nonmodels demonstrated similar ED symptoms on the global EDE-Q, as well as each subscale (restraint, weight, and shape concern), except for eating concerns, which were significantly higher in models than nonmodels. It is important to note that while results pointed to eating concerns being significantly higher in models than nonmodels after controlling for age, all mean EDE-Q subscales and mean EDE-Q global scores for both groups were lower than what has been reported previously as male norms (e.g., Lavender et al., 2010). Interestingly, male models endorsed significantly greater frequency (≥20 times per the past 28 days) of compulsive exercise, as well as self-induced vomiting frequency than nonmodels.
Notably, of the four males with lower BMI (< 18.5), all were well under the EDE-Q clinical threshold (≥4). Furthermore, one model with a BMI >25 (i.e., overweight) achieved an EDE-Q score of 4.3, exceeding the clinical threshold. These observations collectively suggest that fitness-for-work laws focusing on low BMI (<18.5) do not adequately identify males with ED symptoms. Recent research has shown that males who are focused on muscularity have higher BMIs (Compte et al., 2018), and some men engage in ED behaviors that preserve muscle but reduce fat. As muscularity ideals may be related to ED severity in males (e.g., Ralph-Nearman et al., 2020), we explored the relationship between muscle mass, percentage of body fat, and ED symptomatology in both groups. There was a striking divergence in results between male models and nonmodels. That is, male models’ ED symptoms were highest for those models with the larger measured muscle mass. In addition, male models with lower percentage body fat also evidenced more ED symptoms. This patterning was reversed in nonmodels such that lower muscle mass and greater body fat percentage were both associated with higher levels of ED symptoms in nonmodel males. Collectively, these results suggest that both body fat percentage and muscle mass are related to ED symptoms, but this relationship is different for male models and nonmodels. This supports previous work that posits that muscularity-related attitudes and behaviors are associated with negative psychological variables, including depression and ED symptoms; however, the nature of these relationships may vary across different groups of men (Parent & Bradstreet, 2017). It may be that while most men desire increased muscle mass (Bottamini & Ste-Marie, 2006), male models pursue greater musculature at the expense of their overall health. Alternatively, these results may indicate that male models perceive too much muscle mass to be problematic as bulkier muscles may limit their ability to fit into sample size clothing. While these relationships and motivations need to be further examined, they strongly indicate that BMI is a poor single indicator of ED symptoms in male models and nonmodels.
As expected, and similar to female fashion models, male models’ and nonmodels’ self-reported height and weight deviated from experimenter-measured body compositions. In nonmodel males, BMI based on self-reported height and weight was not significantly different from BMI derived via experimenter measured height and weight. However, this result was due to nonmodel males underestimating their weight while overestimating their height. In fact, some nonmodel participants quite severely overestimated their height, which points to the importance of measuring these constructs when calculating BMI. In male models, BMI derived from experimenter measured height and weight was significantly different from BMI calculated using self-reported measurements. This difference was driven by models’ underestimation of their weight but accurate reporting of their height. While both groups misrepresented their weight, nonmodels overestimated their height, which would be expected according to literature that demonstrates that shorter men are more likely to overestimate their height and may misperceive their appearance due to a desire for a more masculine identity (e.g., Bogaert & McCreary, 2011). However, results suggest that male models were generally accurate with their actual height, which may be due to body-size dimensions, rather than weight, being more consequential for a fashion model’s profession.
This is the first study to examine measured BMI and ED symptomatology in professional male models compared with nonmodel males. However, limitations need to be taken into consideration. As this was a cross-sectional study, predictive relationships may not be established, and point to the need for longitudinal examination to understand these relationships and changes over time. Also, perhaps due to cultural differences, the EDE-Q subscales and global scores were slightly lower than for established male norms for both male model and nonmodel groups in the present study (e.g., Lavender et al., 2010). Limitations of this study provide avenues for further research. Future studies should continue to evaluate male-relevant indicators of EDs with the goal of developing policies or standards that more appropriately address the demands on male models’ minds and bodies. For example, providing mental health services to individuals who have ED symptoms rather than removing their livelihood would likely have a range of benefits including 1) encouraging rather than discouraging disclosure of ED symptoms and 2) providing avenues to reduce rather than increase stress.
Conclusion
This is the first study to evaluate BMI as an appropriate single health indicator in male models and nonmodels. BMI has been used as a measure of fitness for work in the fashion industry and is considered an important marker of health in general. Experimenter-measured BMI was significantly associated with EDE-Q scores; however, the direction of the relationship was different for models and nonmodels. Furthermore, the relationships between muscle mass and fat percentage with EDE-Q scores were significantly different for models and nonmodels. Specifically, there were inverse patterns of relationships between groups. Overall, this study suggests that BMI is an incomplete indicator of health status or fitness for work in both model and nonmodel male populations. Other measures of body composition (e.g., muscle mass and body fat percentage) are likely important markers of ED symptoms. Further investigation into these relationships as well as the treatment implications of these findings is warranted.
Footnotes
Acknowledgements
Thank you to the professional modeling agencies and our research participants for their participation.
Declaration of Conflicting Interests
The author(s) declared no potential conflicts of interest with respect to the research, authorship, and/or publication of this article.
Funding
The author(s) disclosed receipt of the following financial support for the research, authorship, and/or publication of this article: The authors would like to acknowledge the funding support from the University of Nottingham's Vice-Chancellor’s Scholarship for Research Excellence (C.R.N.).
Ethical Approval
Ethical standards were adhered to, including informed consent.
Data Availability Statement
The data are not shared due to privacy or ethical restrictions.