
Abstract
The relationship between hypertriglyceridemic waist (HTGW) phenotype, insulin sensitivity, and pancreatic β-cell function remains still unclear in subjects with normal glucose tolerance (NGT). The objective is to detect whether the disposition index (DI) could be used as a predictive indicator of insulin sensitivity and pancreatic β-cell function in men with HTGW phenotype and NGT. A total of 180 men without diabetes were recruited in this study and underwent an oral glucose tolerance test (OGTT) to calculate DI based on the OGTT. Subjects were put into Group A (normal waist circumference [WC] and triglyceride [TG] concentrations), B (enlarged WC or elevated TG concentrations), and C (HTGW phenotype, both enlarged WC and elevated TG concentrations) (n = 60 for each group) according to WC and TG concentrations. The OGTT plasma glucose concentrations at 0.5 and 1 hr for patients in Groups B and C were higher than those in Group A (both p < .05). Group C patients had significantly lower 1/[fasting insulin] values and DI than those in Group A (p < .05), and the 1/[fasting insulin] values in Group C were significantly lower than those in Group B (p < .05). DI correlated positively with high-density lipoprotein cholesterol (p < .05), which was independently associated with WC (p = .002) and TG (p = .009). The HTGW phenotype is associated with decreased DI among men with NGT, indicating decreased DI is a strong predictor of future impaired glucose tolerance, which can provide guidance and reference for screening patients with potential impaired glucose tolerance in Chinese community population.
Introduction
By 2010, diabetes had become a public health concern in China, and the prevalence of prediabetes was 50.1% (Xu et al., 2013). Approximately 40% of patients had normal fasting plasma glucose (Unwin et al., 2002), but they already have decreased insulin sensitivity, which later causes impaired glucose tolerance and progression to diabetes (Morimoto et al., 2013; Tommerdahl et al., 2021; Utzschneider et al., 2009). The oral disposition index (DI), which is the product of insulin secretion and insulin sensitivity, is a widely used index of insulin secretion with high sensitivity and can be used to effectively assess the overall function of pancreatic β-cells (Kile et al., 2021; Kim et al., 2012).
The concept of hypertriglyceridemic waist (HTGW) phenotype was first proposed in 2000 and was defined as elevated serum triglyceride (TG) levels (TG concentrations ≥1.7 mmol/L) and increased waist circumference (WC) (≥90 cm for men, ≥80 cm for women) (Lemieux et al., 2000). Previous studies had reported that HTGW could be used as a simple screening approach to predict diabetes (He et al., 2013; Lemieux et al., 2000; Zhang et al., 2012). The HTGW phenotype might be easier to measure than other metabolic indicators of diabetes and could be recommended in most clinical practices (Ren et al., 2016a).
The relationship between HTGW phenotype, pancreatic β-cell function, and insulin sensitivity in the healthy population remains unclear (Carlsson et al., 2014). This study attempted to investigate the relationship between pancreatic β-cell function and insulin sensitivity in Chinese men with HTGW phenotype and normal glucose tolerance (NGT), and then further test whether DI can be a predictor of HTGW phenotype and insulin sensitivity and pancreatic B-cell function in male with NGT.
Materials and Methods
Subjects
A total of 180 men with NGT (as defined by a normal glucose value [or the value] at 2-hr post OGTT), aged from 20 to 50 years, participated in this retrospective study. Patients who met the inclusion and exclusion criteria underwent general information acquisition and an OGTT in the wards of our department. Basic information was self-reported by patients, and peripheral venous blood samples were taken after 30 min, 1 hr, 2 hr, and 3 hr.
This study was approved by the ethics committee of our hospital. All patients had signed informed consent.
Inclusion and Exclusion Criteria
Inclusion criteria: (1) male patients, aged 18–65 years; (2) body mass index (BMI) ≥25.0 kg/m2; (3) patients were not on medication that affects glucose or lipid metabolism. Exclusion criteria: (1) fasting plasma glucose ≥7.0 mmol/L and/or 2-hr plasma glucose ≥11.0 mmol/L (American Diabetes Association 2008), with diabetes clinical symptoms and/or the use of insulin or oral hypoglycemic agents and/or a self-reported history of diabetes; (2) patients with type 1 diabetes and other abnormal glucose tolerance; (3) patients with coronary artery disease, hypertension, endocrinopathy, cerebral stroke, and hepatic or renal dysfunction; (4) patients with acute or chronic inflammation; (5) patients who were disabled, mentally disturbed and obese (caused by disease), or had cancer.
Sample Size Calculation
In this study, we performed a sample size calculation based on the minimal clinically relevant differences (MCRDs) detected from expert opinion. The sample size was calculated based on the Raosoft sample size calculator (http://www.raosoft.com/samplesize.html [accessed November 19, 2022]) with an error range of 5%, a confidence level of 95%, and the premise that analysis of variance (ANOVA) and regression model analysis were used (Alshammari et al., 2021). The sample size calculated was at least 50 for each group. Considering a 10% dropout ratio, we aimed to recruit 60 participants per group.
Definition and Grouping Method
According to the new definition of the Chinese population by the International Diabetes Federation, the definition of HTGW phenotype is serum TG concentrations ≥1.7 mmol/l and WC ≥ 90 cm2. Patients were divided into Groups A, B and C: (1) Group A, normal TG (TG ≤150 mg/dL, 1.7 mmol/L) / normal WC (<90 cm for men and <80 cm for women); (2) Group B, increased WC (≥90 cm for men and ≥80 cm for women) or elevated TG concentrations (>150 mg/dL, 1.7 mmol/L); (3) Group C, HTGW phenotype, elevated WC (≥90 cm for men and ≥80 cm for women) and TG level (>150 mg/dL [1.7 mmol/L]).
Body Measurements
Body measurements included height (measured using a Seca 213 portable stadiometer), weight, blood pressure, and WC. With the participants in light clothing and without shoes, the WC was measured midway between the lower rib margin and the iliac-crest at the end of gentle expiration in the standing position using portable stadiometer. BMI was calculated by dividing weight (kg) by height squared (m2) (Janghorbani & Amini, 2016).
Laboratory Examinations
The OGTT was performed after fasting for at least 8 hr. Glucose was administered at a dose of 1.75 g/kg (maximum 75 g), and samples were collected at 0, 30 min, 1 hr, 2 hr, and 3 hr for determination of glucose and insulin levels. NGT was defined as fasting plasma glucose ≥100 mg/dL, 1hG ≥200 mg/dL, and 2hG ≥140 mg/dL in OGTT.
A radioimmunological assay was used to determine the plasma concentrations of insulin. Insulin sensitivity was defined as 1/[fasting insulin]. Following the OGTT, the ratio of the change in insulin to the change in glucose from 0 to 30 min (the insulinogenic index) was calculated and used to detect the early insulin response (ΔI30/ΔG30 = ([insulin] 30 min − [insulin] 0 min) / ([glucose] 30 min − [glucose] 0 min)) (Heni et al., 2010). The DI was used as a composite measure of β-cell function and was calculated as follows: DI = ISI × [AUC 30 min insulin/AUC 30 min glucose], where AUC 30 min is the area under the curve between baseline and 30 min of the OGTT for insulin (pmol/L) and glucose (mmol/L) measurements, respectively (Utzschneider et al., 2009).
The evaluations were performed at the Clinical Laboratory of our hospital. Blood glucose, total cholesterol, high-density lipoprotein cholesterol (HDL-C) and TG, alanine transaminase (ALT), and aspartate transaminase (AST) were assayed using spectophometric methods (Modular P8000, Roche, Italy). Low-density lipoprotein (LDL) cholesterol was calculated using the Friedewald formula.
Statistical Analysis
The SPSS 11.5 statistical software program was used in this study. Continuous data were expressed as mean ±SD. The ANOVA test was used for between-group comparisons. The Pearson correlation coefficient was used to measure the association between two variables. The relationship between DI and other variables was tested using multiple linear regression analysis. A value of p < .05 was considered statistically significant.
Results
Background Information
Compared with Group A patients, BMI (p = .000), WC (p = .000), systolic blood pressure (SBP) (p = .000), diastolic blood pressure (DBP) (p = .004), TG (p = .002), TG/HDL-cholesterol (HDL-C) ratio (p = .000), ALT (p = .032), and AST (p = .015) significantly increased, and HDL-C significantly decreased in Group C patients (p = .000) (Table 1).
Clinical and Laboratory Characteristics of the Subjects in Different Groups

Note. Group A: normal TG AND normal WC; Group B: elevated TG OR elevated WC; Group C: elevated TG AND elevated WC. Values are expressed as mean (SD), and when not normally distributed, they are expressed as medians (IQR) and ln transformed for analysis. IQR = interquartile range; BMI = body mass index; WC = waist circumference; SBP = systolic blood pressure; DBP = diastolic blood pressure; TG = triglycerides; HDL-C = high-density lipoprotein cholesterol; ALT = alanine aminotransferase; AST = aspartate aminotransferase.
Compared with Group A, p < .05. #Compared with Group B, p < .05.
The OGTT Results
Compared with those in Group A, the OGTT results for 0.5- and 1-hr plasma glucose and insulin levels were significantly higher for patients in Groups B and C (p = .007; p = .000; p = .000) (Figures 1 and 2). Disposition indices were significantly lower in Group C than Group A (p = .001) (Table 2). Linear regression analysis was performed using the stepwise method. The DI was independently associated with WC (p = .002) and TG (p = .009) (Table 3).

Comparison of Plasma Glucose Levels Between Participants in Three Groups During Oral Glucose Tolerance Test

Comparison of Insulin Content Between Participants in Three Groups During Oral Glucose Tolerance Test.
Changes in Metabolic Parameters Measured During 75-g OGTT in Different Groups

Note. Group A: normal TG AND normal WC; Group B: elevated TG OR elevated WC; Group C: elevated TG AND elevated WC. Values are expressed as mean (SD), and when not normally distributed, they are expressed as medians (IQR) and ln transformed for analysis. IQR = interquartile range; FPG = fasting plasma glucose; OGTT = oral glucose tolerance test; HOMA-IR = Homeostatic Model Assessment of Insulin Resistance.
Compared with Group A, p < .05. #Compared with Group B, p < .05.
Multiple Linear Regression Analysis for Disposition Index (Stepwise Method)
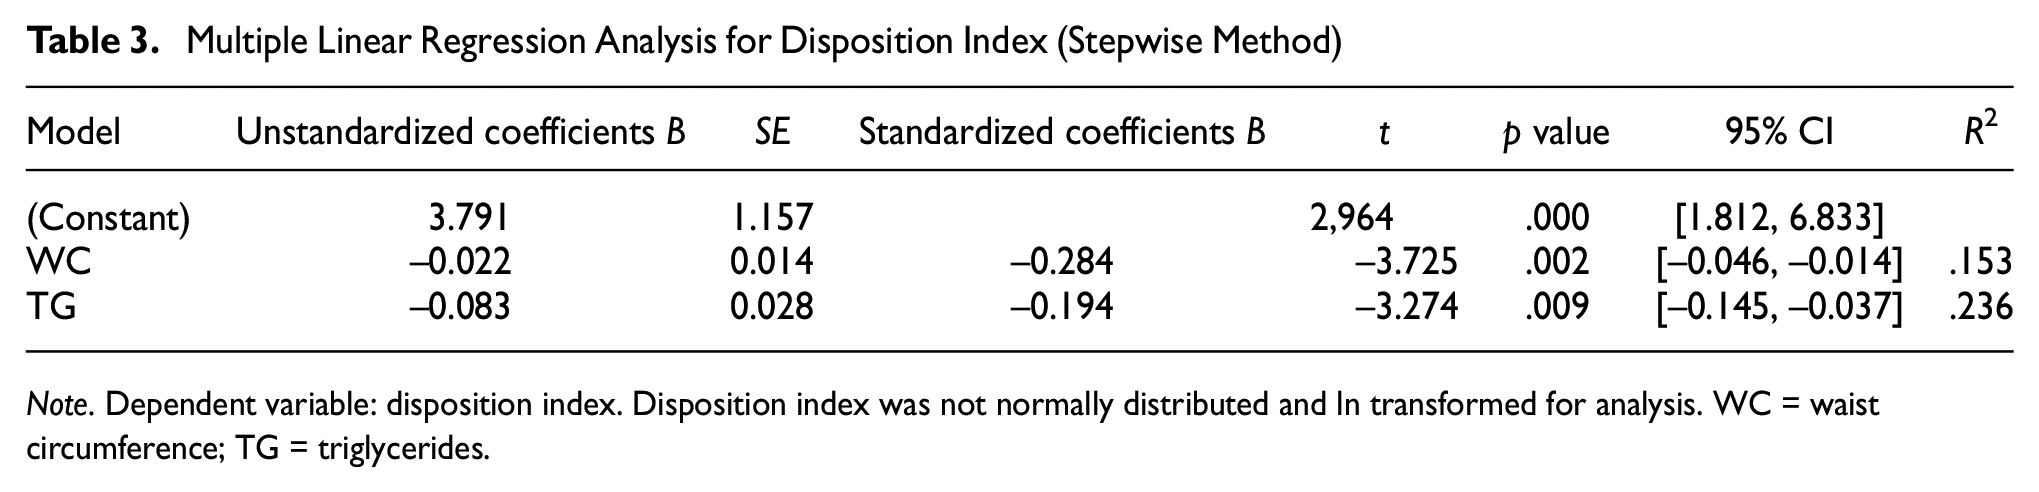
Note. Dependent variable: disposition index. Disposition index was not normally distributed and ln transformed for analysis. WC = waist circumference; TG = triglycerides.
Discussion
The results of this study show that the 30-min and 1-hr post-load plasma glucose levels were elevated in men with the HTGW phenotype and their insulin sensitivity and DI were reduced, but their insulin secretion rate had significantly decreased.
Patients with normal β-cell function demonstrated a hyperbolic relationship between insulin sensitivity and insulin response (Kile et al., 2021). Oral DI was reported to predict the development of future diabetes (Utzschneider et al., 2009). Abdominally obese men with HTGW phenotype were more likely to experience disorders related to glucose metabolism, even with NGT (Abdul-Ghani et al., 2008). The HTGW phenotype identified a greater degree of visceral adiposity (Sam et al., 2009; Tian et al., 2020); higher levels of high-sensitivity C-reactive protein, interleukin-6, and retinol-binding protein 4, and reduced levels of adiponectin (Rogowski et al., 2009; Yu et al., 2012), and the association of the HTGW phenotype with a decreased DI may be related to these pathological mechanisms (González-Chávez et al., 2011; Salazar et al., 2013). Unhealthy food and lack of physical activity significantly increased the risk of HTGW phenotype (Alavian et al., 2008; Fernández-García et al., 2020), suggesting people with the HTGW phenotype should be advised to develop healthier lifestyles to prevent diabetes.
Abdominal obesity, visceral fat deposition, and hypertriglyceridemia can cause insulin resistance (Nguyen-Duy et al., 2003; Rosety-Rodríguez et al., 2013; Usui et al., 2010). The WC measurement is associated with abdominal fat content (Sam et al., 2009), which is the main indicator for the diagnosis of central obesity. WC does not distinguish visceral fat from subcutaneous fat, so only measuring WC cannot accurately measure visceral fat content. Previous studies also presented that the HTGW phenotype was related to diabetes and insulin resistance (Cunha de Oliveira et al., 2014; Ren et al., 2016b). When the TG that can be stored in subcutaneous fat reaches its limit, excess fat will be deposited ectopically around insulin-sensitive target organs, which indicates that high TG is a reliable indicator of excess body fat.
Limitations
Only men were studied. Further studies to advance research into the DI in humans with NGT should include women and use larger numbers of patients. In addition, due to the variability of the OGTT, further research is required to confirm that insulin sensitivity and the responses to insulin are compatible with a hyperbolic association. Also, this study was based on Chinese men. Further research should include different ethnic groups as some measurements, such as normal waist sizes, may vary by race.
Conclusion
The HTGW phenotype correlates with reduced DI in Chinese men with NGT. DI can be used as a sensitive risk predictor for further impaired glucose tolerance and insulin resistance. Individuals with HTGW phenotype and decreased DI have a higher risk of developing impaired glucose tolerance in the future. This study can provide guidance and reference for screening patients with potential impaired glucose tolerance in the Chinese community population.
Footnotes
Acknowledgements
The authors express their gratitude to all helpers of this study.
Author Contributions
L.X.L., M.C.P., and W.R. conceived this study. L.N. and M.C.M. designed this trial. Y.F.Z. and L.Q. helped drafting this article.
Declaration of Conflicting Interests
The author(s) declared no potential conflicts of interest with respect to the research, authorship, and/or publication of this article.
Funding
The author(s) received no financial support for the research, authorship, and/or publication of this article.
Ethics Approval
This study had received ethical approval from the First Hospital of Qinhuangdao and the ethical approval number is 2018D001.