
Abstract
Unrealistic Optimism (UO) appears when comparing participants’ risk estimates for themselves with an average peer, which typically results in lower risk estimates for the self. This article reports nuanced effects when comparison varies in terms of the gender of the peer. In three studies (total N = 2,468, representative sample), we assessed people’s risk estimates for COVID-19 infections for peers with the same or other gender. If a peer’s gender is not taken into account, previous studies were replicated: Compared with others, participants perceived themselves as less likely to get infected with COVID-19. Interestingly, this effect was qualified by gender: Respondents perceived women as less threatened than men because women are perceived as more cautious and compliant with medical guidelines.
It is probable that there is no person on Earth who has not compared herself/himself with others (Festinger, 1954). We do so for a number of reasons, one of which is to feel attached to others, to have the opportunity to evaluate one’s own competence and abilities (Boissicat et al., 2020), to feel better (McCarthy & Morina, 2020), to motivate ourselves (Martin et al., 2016), or even to deceive ourselves (Robinson & Ryff, 1999) so that life becomes easier to bear. We prefer to compare ourselves with people whose situation or state is worse than ours (downward comparison; Wills, 1981), making our situation—in contrast—feel much better without any action justifying such a claim (e.g., Bergagna & Tartaglia, 2018; Jiang & Ngien, 2020; Olivos et al., 2021).
It is almost impossible to find a social psychological textbook without references to social comparisons, and in-depth reading of these may result in two main conclusions. First, many of these comparisons are biased. Second, to the best of our knowledge, comparisons are made with a group, “average peer,” and are not more specified (e.g., with the same/other gender). In this article, we fill this gap by investigating whether biased comparisons with “others” depend on to whom—in terms of gender—we specifically compare. In detail, this article reports research on nuanced biased social comparisons of Unrealistic Optimism (UO); specifically, we explored the role of the gender of the comparison peer, confirming the need for empirical efforts to achieve a more nuanced appraisal of biases in social comparisons.
Biased Social Comparisons
Comparison with others is a frequent activity we engage in, and as such, we might expect to be accurate in it, yet the outcome of the comparison is far from objective. Driven by motives of self-enhancement and self-awareness, such comparisons often result in a favorable self-bias. Congruently, biased outcomes of social comparisons have attracted the interest of several scholars, with the aim to outline the nature of the bias and its mechanics.
One of the prevalent theories about bias in social comparison is the Better-Than-Average Effect (BTAE), described as the tendency to perceive—in comparison with the average peer—oneself as better. This was proven in several domains, with the self emerging as more ethical, intelligent, and even more attractive (Alicke, 1985; Alicke & Govorun, 2005; Brown, 2012; Zell et al., 2020), engaged in saving the natural environment (Leviston & Uren, 2020) and in charity support (Brown, 2012; Epley & Dunning, 2000). On the grounds of health psychology—which is especially important for the scope of this article—it was demonstrated that participants rated their eating behaviors as healthier (Sproesser et al., 2015) and perceived themselves as more “energetic” (Bowen et al., 2020). It was also reported that adult caregivers of children with asthma believed that their child’s asthma was better controlled by them (Shepperd et al., 2018).
The first explanation for the BTAE stems from a cognitive perspective. When thinking about actions, we are biased in a way that we are more aware of our own actions, leading to underestimation of the actions of others (Kruger, 1999). The second explanation is motivational: the desire to produce, enhance, and finally defend one’s self-worth/self-esteem (Alicke & Sedikides, 2011; Brown, 2012).
Interestingly, despite the general positive outcome of the bias (the self is good), the BTAE was also associated with negative consequences. For example, it is positively associated with verbal and physical aggression, anger expression, and risky driving behavior (Măirean & Havârneanu, 2018). A study on financial investors reported that 30% of them presented the BTAE, leading to inaccurate financial decisions (Linder & Sperber, 2020). In conclusion, it is clear that the BTAE, while enhancing self-view, may also—in the long run and from a wider perspective—be harmful, which calls for a more fine-tuned understanding of the conditions defining the payoff.
A parallel effect that attracted the attention of scholars interested in biased social comparisons is the phenomenon of Unrealistic Optimism. UO bias is described by Weinstein—the creator of this term—as a situation where “people believe that negative events are less likely to happen to them than to others, and they believe that positive events are more likely to happen to them than to others” (Weinstein, 1980). For example, while speaking of positive events, students estimate their chances of passing exams in college/university as higher for themselves in comparison with the average peer (Lewine & Sommers, 2016). In the same vein, Shepperd and colleagues (1996) reported that study participants holding the UO bias believed that they—but not “other peers”—received a high salary. Participants also downplayed their own—and overestimated their peers’—risk of divorce (Y. C. Lin & Raghubir, 2005), car accident (Rutter et al., 1998), and falling into addiction (Nezlek & Zebrowski, 2001).
Awareness of a wide range of dangers that could affect our lives may be a source of constant and serious fear and stress. UO bias—a mechanism leading to an assumption of being in less danger—works as a buffer against such threats, as it is responsible for quick and effective reduction of fear (Hoorens, 1995) and the feeling of being in danger (Shepperd et al., 1996). As such, optimism is a very positive state not only for the mind but also for one’s health. Optimists have greater chances of achieving life success due to their very high social skills (Seligman, 2002). Optimism leads to health benefits: Optimists report—in comparison with pessimists—fewer health-related problems (Robbins et al., 1991), and even when they get sick, they recover more quickly (Fitzgerald et al., 1993). Parallel to the argument we have posited for the BTAE, UO also has a dark side.
Hanoch and colleagues (2019) reported that patients’ UO bias led to harmful outcomes. Women were less eager to undergo mammographic screening (McCaul et al., 1996) as they perceived themselves as less at risk. In the same vein, Weinstein and colleagues (2005) and Dillard and colleagues (2006) identified that smokers (both women and men) holding the UO bias not only underrated the probability of getting lung cancer but were also less eager to present behaviors reducing this threat, that is, quit smoking. Dillard and colleagues (2009) identified that more alcohol-related problems were experienced by unrealistically biased participants regardless of the gender. Importantly, in both studies, comparisons were run for an unspecified “average peer,” neglecting the possible role of gender, and filling this gap is the main goal of this article.
Goal of the Article
In most previous studies on biased social comparisons, participants compared themselves with a peer. Only a few studies reported more nuanced comparisons. For example, Watt and Konnert (2020) reported that body satisfaction and self-esteem among older women decreased compared with younger women. Buunk and colleagues (2006) investigated older patients with various age-related diseases (particularly cardiovascular disease and diabetes) assessing their comparison targets. It turned out that the reference groups were people who suffered from the same illness/disease, to a lesser extent other ill people (touched by a different illness/disease), and to an even smaller extent healthy people. These comparisons were made on the grounds of mental states, symptoms, and physical activities (in comparison with, for example, social activity).
To the best of our knowledge, there are no studies reporting nuanced gender comparisons on the grounds of the UO bias. In the following studies, participants compared themselves with a peer of the same/different gender.
Gender is a particularly relevant social dimension in the field of health and health-related decision-making. Gender differences have been observed in risk assessment and consequent behaviors in several domains (for reviews, see Byrnes et al., 1999, or Courtenay, 2000), including smoking (Weiss & Garbanati, 2006), drinking and driving (Linkenbach & Perkins, 2005), and preventive health care (Mahalik et al., 2006). Unsurprisingly, this pattern is confirmed also in the rich literature on COVID-19, where men, compared with women, are less likely to engage in compliant behaviors (e.g., Aranguren, 2022; T. Lin et al., 2021), up to the point that women-led countries were evaluated as being more capable of dealing with the pandemic (Galasso et al., 2020). Such gender differences have been related to gender norms, with men being prompted by patriarchal societies to stress and affirm their masculinity, and as such their strength (for a review on precarious masculinity, see Vandello & Bosson, 2013).
Within this theoretical framework, two possible scenarios are plausible. The stereotype about men being strong may lead respondents to think that men are less likely to be sick, and therefore less at risk of catching the COVID-19 virus. On the other hand, the stereotype describing men as fearless and brave may enhance their risk because of reckless behaviors. Both outcomes could be related to self-anchoring or self-stereotyping behaviors, therefore leading men (vs. women) to self-ascribe higher or lower risk than their average peer according to their view of men as reckless or strong, respectively. Observing the actual pattern is therefore crucial to identifying appropriate intervention and communication strategies to enhance self-protective behaviors in the entire population, above and beyond the specific case study described here, namely, COVID-19.
The launching pad for planned research on gender-nuanced biased social comparison was the UO bias. The main reason for this choice was a naturally occurring global event, that is, the COVID-19 pandemic. Importantly, the UO bias had already been reported under those circumstances in many places around the world proving its robustness: in Italy and Romania (Druică et al., 2020), Kazakhstan and Iran (Kulesza et al., 2021), France, Italy, Switzerland, and the United Kingdom (McColl et al., 2022), and Poland (Dolinski et al., 2021). In all of this research, participants perceived themselves as less threatened by COVID-19 in comparison with similar peers. We were unable to identify any research disconfirming UO bias toward possible COVID-19 infection under COVID-19 threat. Given that—to the best of our knowledge—almost no research was conducted on the BTAE during the COVID-19 pandemic (e.g., Kulesza et al., 2022), we decided to focus on the well-established UO bias. The fact that we could also run our studies in the same circumstances of the already investigated COVID-19 pandemic provided a further reason in favor of targeting UO. The study setting provides solid grounds for comparison with previous studies (e.g., Dolinski et al., 2021) and allows for gender-specific social comparisons, avoiding confounding factors related to different measures or evaluated risks.
Method
Participants
Participants were invited to complete a survey that “aims to learn about people’s opinions about coronavirus (SARS-CoV-2/COVID-19).” All samples were collected using the Qualtrics software for surveys and Prolific, which is an online platform for recruiting respondents. A purposive sampling strategy was tied to a gender balance criterion. Ultimately, we conducted three studies in succession. Below, we describe each of the three studies in detail.
Study 1
In September 2021, 1,198 participants from the United States (the distribution of age, sex, and ethnicity in the sample is similar to the selected national population), aged 18–81years (614 females and 584 males: Mage = 44.57, SDage = 16.01) responded—in exchange for £15.32 per hour—to the invitation. We did not exclude any data from the analysis in this study.
Study 2
In November 2021, 634 participants from the United States, aged 18–62 years (314 females, 314 males, six nonbinary: Mage = 26.51, SDage = 6.97) responded—in exchange for £7.56 per hour—to the invitation. As n for a nonbinary person was 6, we did not include this gender in the analysis as the number of participants was too small. The final sample consisted of 628 participants (314 females, 314 males), aged 18–62 years (Mage = 26.47, SDage = 6.96).
Study 3
In November 2021, 636 participants from the United States, aged 18–76 years (315 females, 314 males, seven nonbinary: Mage = 27.1, SDage = 9.25) responded—in exchange for £7.50 per hour—to the invitation. As n for a nonbinary person was 7, we did not include this gender in the analysis. The final sample consisted of 629 participants (315 females, 314 males), aged 18–76 years (Mage = 27.08, SDage = 9.25).
Procedure
In all studies, participants estimated the risk of COVID-19 infection for themselves, their peers (i.e., the average Prolific user), the average female user of Prolific, and the average male user of Prolific. For details of the question, see Supplemental Material File 1. The respondents rated their answers on an 11-point scale (1 = absolutely impossible; 11= quite certain).
In Study 2 and Study 3, participants received an additional request testing their awareness of the bias. In Study 2, after estimating the risk of COVID-19 infection, the respondents chose the answer that best illustrates (in their opinion) their previous choices. For details of the question, see Supplemental Material File 1. Thus, participants answered two questions by selecting one option in each. After responding, participants were asked for a written justification of the two previous answers. We did this to gain some insight into the process behind the biased risk estimates; see Supplemental Material File 1 for details.
Analogous to Study 2, participants in Study 3 were asked to estimate the risk of COVID-19 infection. Respondents had to choose the answer that best illustrated (in their opinion) their previous choices. However, this time we displayed the answers previously given by the respondents, making them aware of the biases. In other words, when answering the questions (Q5 and Q6—see Supplemental Material File 1), participants were shown the answers they had previously provided (see Supplemental Material File 1). After answering two questions, as in the previous study, participants were asked for a qualitative justification of the two answers.
Data set, data analysis, supplemental material files, and script for plot are accessible at the Open Science Framework (OSF; https://osf.io/cb75v/?view_only=a10914a27e834cc8b8d41a68065d93d3). The study was reviewed and approved by the ethics committee of the SWPS University of Social Sciences and Humanities in Wroclaw. Consent was obtained from all participants before enrollment in the procedures and data collection, and it was digitally recorded as a part of an online questionnaire.
Results
Two thousand four hundred sixty-eight participants (1,198: Study 1, 634: Study 2, 636: Study 3) including 1,243 females, 1,212 males, and 13 nonbinary persons took part in the study. The records for nonbinary participants are preserved in the original data set available at OSF. The final sample in the analysis consisted of 2,455 participants.
Due to the sample size and the analytical strategy used (integrated results from three studies), our results should not be in danger of having too little statistical power. However, we decided to run a simple simulation to prove it. We were interested in the minimum effect size when comparing two groups that we would detect with samples of 1,200 and 600 subjects. We simulated normal distributions for both sample sizes (two groups), with standardized mean differences varying from 0.05 to 0.3 (in 0.05 intervals). For each combination of sample size and effect, the simulation was repeated 1,000 times, and the power (the average probability of a significant t test result for a given combination of conditions) was assessed. It identified that in the case of N = 600, 80% power is obtained at d = 0.23, while for N = 1,200, d = 0.17 is obtained. This indicates that the power should be sufficient with our sample size to detect effects with marginal sizes (d < 0.2). We present the results of the power analysis in Supplemental Material File 2.
Quantitative Analysis
In the section below, we report qualitative analyses regarding questions Q1 to Q4 in Studies 1 to 3. The analyses concern the UO bias and perception of COVID-19 infection risk, depending on the gender of the respondents (male, female) and the person of reference (“me,” “average peer user of Prolific,” “average male user of Prolific,” “average female user of Prolific”).
Statistical analysis was carried out using R 4.1.1 (R Core Team, 2021), with the Emmeans package (v1.7.2; Lenth et al., 2021), Afex package (v1.0-1; Singmann et al., 2016), misty library (Yanagida, 2020), and car library (Fox et al., 2019).
UO—The Main Effect
To test the cluster structure of our studies, we performed an interclass correlations (ICC) analysis on all three studies combined in a single data frame.
We performed two Type 1 analyses with REML estimation. The first analysis specified “risk estimation” as a dependent variable and individual IDs as a cluster variable. The ICC equaled .74, which confirms that individuals’ risk estimations for “self,” “peer,” “average male,” and “average female” are strongly correlated and ID should be treated as a cluster of responses.
The second analysis specified “risk estimation” as a dependent variable and study number as a cluster variable. The ICC equaled .05, which suggests that the study number could be treated as a moderator variable, but ignoring the three studies as clusters of responses is also a possibility.
Judging by the ICC and considering that (1) all studies used identical measures of dependent and independent variables and (2) all studies were conducted on the same population, via the same panel and in the proximal time frame, we decided to analyze them jointly.
To test the basic effects, we conducted a mixed analysis of variance (ANOVA) with one within-subject factor: “person of reference” (four levels: “me,” “peer,” “avg. male,” “avg. female”) and two between-subject factors: gender of the participant (two levels: “male,” “female”) and study (three levels: “Study 1,” “Study 2,” “Study 3”). See the detailed results of this analysis in Table 1.
The Detailed Results of the Analysis.
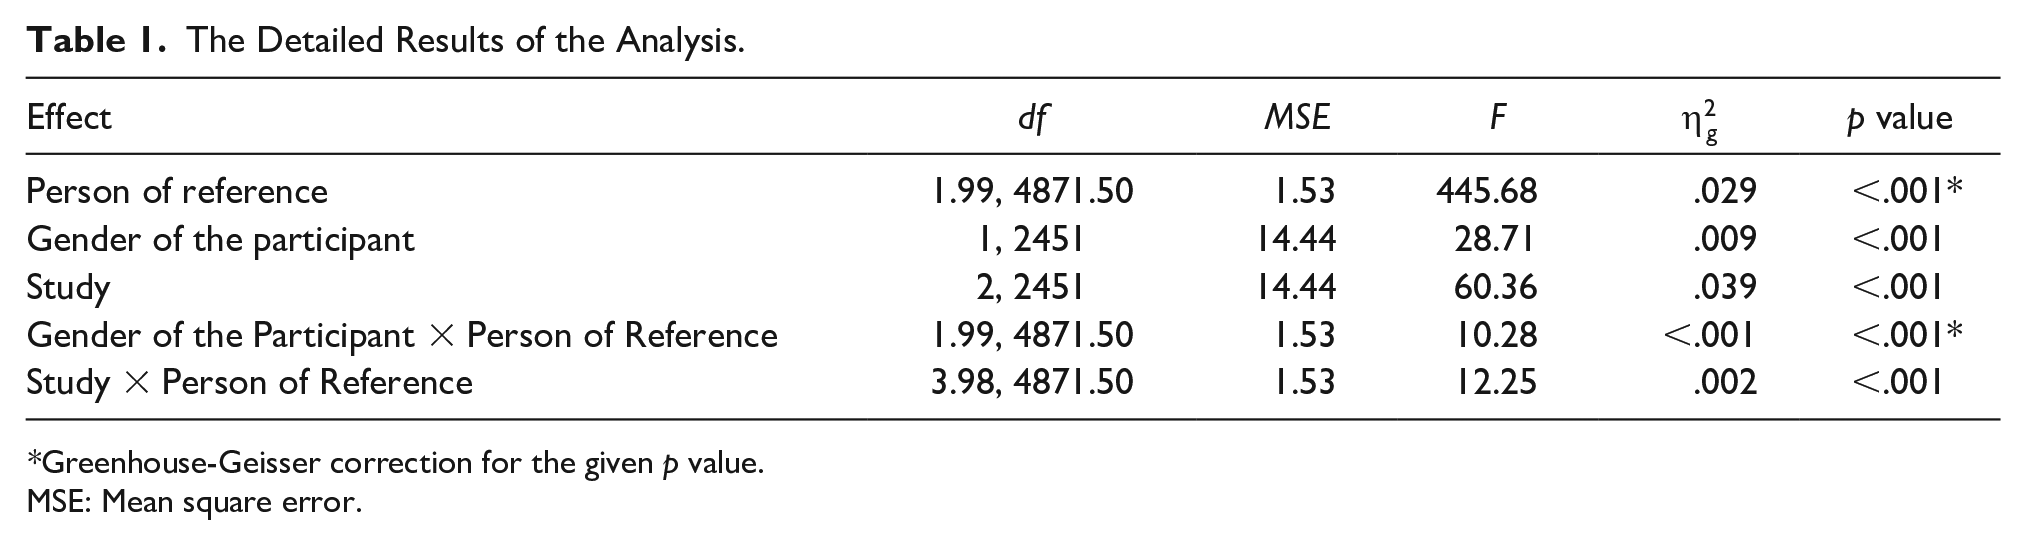
Greenhouse-Geisser correction for the given p value.
MSE: Mean square error.
Evaluation of the distributions of the variables indicated that the assumption of normality of the distributions across groups was met, and only for the “self” condition did we observe a slightly right-skewed distribution. Due to our sample size and the assumed normality of the distributions, we chose not to test for equality of variance in the context of between-person factors. According to the methodological literature, this model should be robust to inequality of variance when the sample is large. The Mauchly’s test also indicated a violation of sphericity assumption, so for the analysis, we report p values with Greenhouse-Geisser correction (it does not change the interpretation of the results in any way, and given our sample size, this correction is of marginal importance). Descriptive statistics for all groups in the three individual studies are available in Table 2.
Detailed Descriptive Statistics for All Groups in the Three Individual Studies.

Note. N = number of participants within condition; M = mean response within group; SD = standard deviation of response within group.
All main effects proved to be significant, along with the interaction between “Study” (number of the study) and “Person of Reference” (different points of reference for risk estimations) as well as between “Gender of the Participant” and “Person of Reference.”
Post hoc analyses revealed that the average risk estimation was the lowest in Study 1 (M = 4.97, SE = 0.06), while Study 2 (M = 5.87, SE = 0.07) and Study 3 (M = 5.87, SE = 0.07) did not differ significantly. Male participants (M = 5.32, SE = 0.06) estimated the risk of COVID-19 infection averaged across all person of reference points as lower than female participants (M = 5.74, SE = 0.06).
To inspect the results further, we computed a planned contrasts analysis, which directly compares certain pairs of means, indicating the presence or absence of the effects we were interested in examining.
The UO bias was noted in our studies: The respondent’s estimation of COVID-19 infection for “me” was on average 0.85 lower than for an average peer (SE = 0.04, df = 2451, t ratio = −23.27, p < .001). Illustration of this effect separately for females and males is reported in Table 3.
The Simple Main Effect Analysis Comparing the Estimated Risk Infection for “Me” and “My Peer” Between Females and Males.

UO Bias and Gender Differences
When gender was taken into account, it turned out that the respondents’ estimations of COVID-19 infection are substantially lower for “me” than for an “average male” and “average female.”
Among female participants, the estimation for “me” is on average 0.86 lower than for an “average female” (SE = 0.05, df = 2451, t ratio = −17.22, p < .001). The majority of female participants (54.5%, n = 678) estimated that their own chance for COVID-19 infection is lower than those for an “average female,” 10.5% (n = 130) of female participants thought the opposite, while 35% (n = 435) of female participants estimated their own chances as the same as an “average female.”
Among male participants, the estimation for “me” is on average 0.85 lower than for an “average male” (SE = 0.05, df = 2451, t ratio = −16.19, p < .001). About half of the male sample (53.7%, n = 651) estimated that their own chance for COVID-19 infection is lower than those for an “average male,” 13% (n = 158) thought the opposite, while 33.3% (n = 403) estimated their own chances as exactly the same as those of an “average male.”
The strength of the UO bias among males and females proved to be almost the same—the gap between how males estimate the risk for “me” and an “average male” is not significantly different from the gap between “me” and an “average female,” when estimated by females (b = 0.00, SE = 0.07, df = 2451, t ratio = 0.06, p = 1).
It turned out that both females and males estimated that the chance of COVID-19 infection is higher for the average male than for the average female.
Females estimated the chances for the average male to be 0.31 higher than those for the average female (SE = 0.03, df = 2451, t ratio = −11.31, p < .001).
Males estimated the chances for the average male to be 0.17 higher than those for the average female (SE = 0.03, df = 2451, t ratio = −6.02, p < .001).
Although both genders agree that males are more at risk, females perceive this difference to be slightly higher than males do (b = −0.14, SE = 0.04, df = 2451, t ratio = −3.77, p = .002).
Another subject that we aimed to investigate was how both genders compare themselves with the opposite gender.
It turned out that the respondents of both genders perceive their own chance of infection as lower than those of the average representative of the opposite gender.
Males estimated their own chance as 0.69 lower (on 1–11 scale) than those of an average female (SE = 0.05, df = 2451, t ratio = −13.69, p < .001). Females estimated their own chance as 1.16 lower than those of an average male (SE = 0.05, df = 2451, t ratio = −22.31, p <.001). The cross-gender risk estimation gap proved to be substantially higher for females than for males (b = −0.48, SE = 0.07, df = 2451, t ratio = −6.73, p < .001).
Generally speaking, both males and females displayed many similarities in their patterns of UO. First, respondents of both genders consequently estimated their chances of contracting COVID-19 as lower for themselves than for the average representative of their own or opposite gender. Second, respondents of both genders agreed that the average female is less prone to COVID-19 infection than the average male.
The most distinct difference between both genders is their general region of risk estimation—males tend to estimate the risk in lower ranges than females do. Smaller differences were observed in the size of the “average male” versus “average female” gap (female’s estimate is bigger) and in the strength of cross-gender UO (it is stronger for females). The pattern of the results for each study is visualized in Figure 1. The distribution of the risk estimation for all studies combined is visualized in Figure 2.
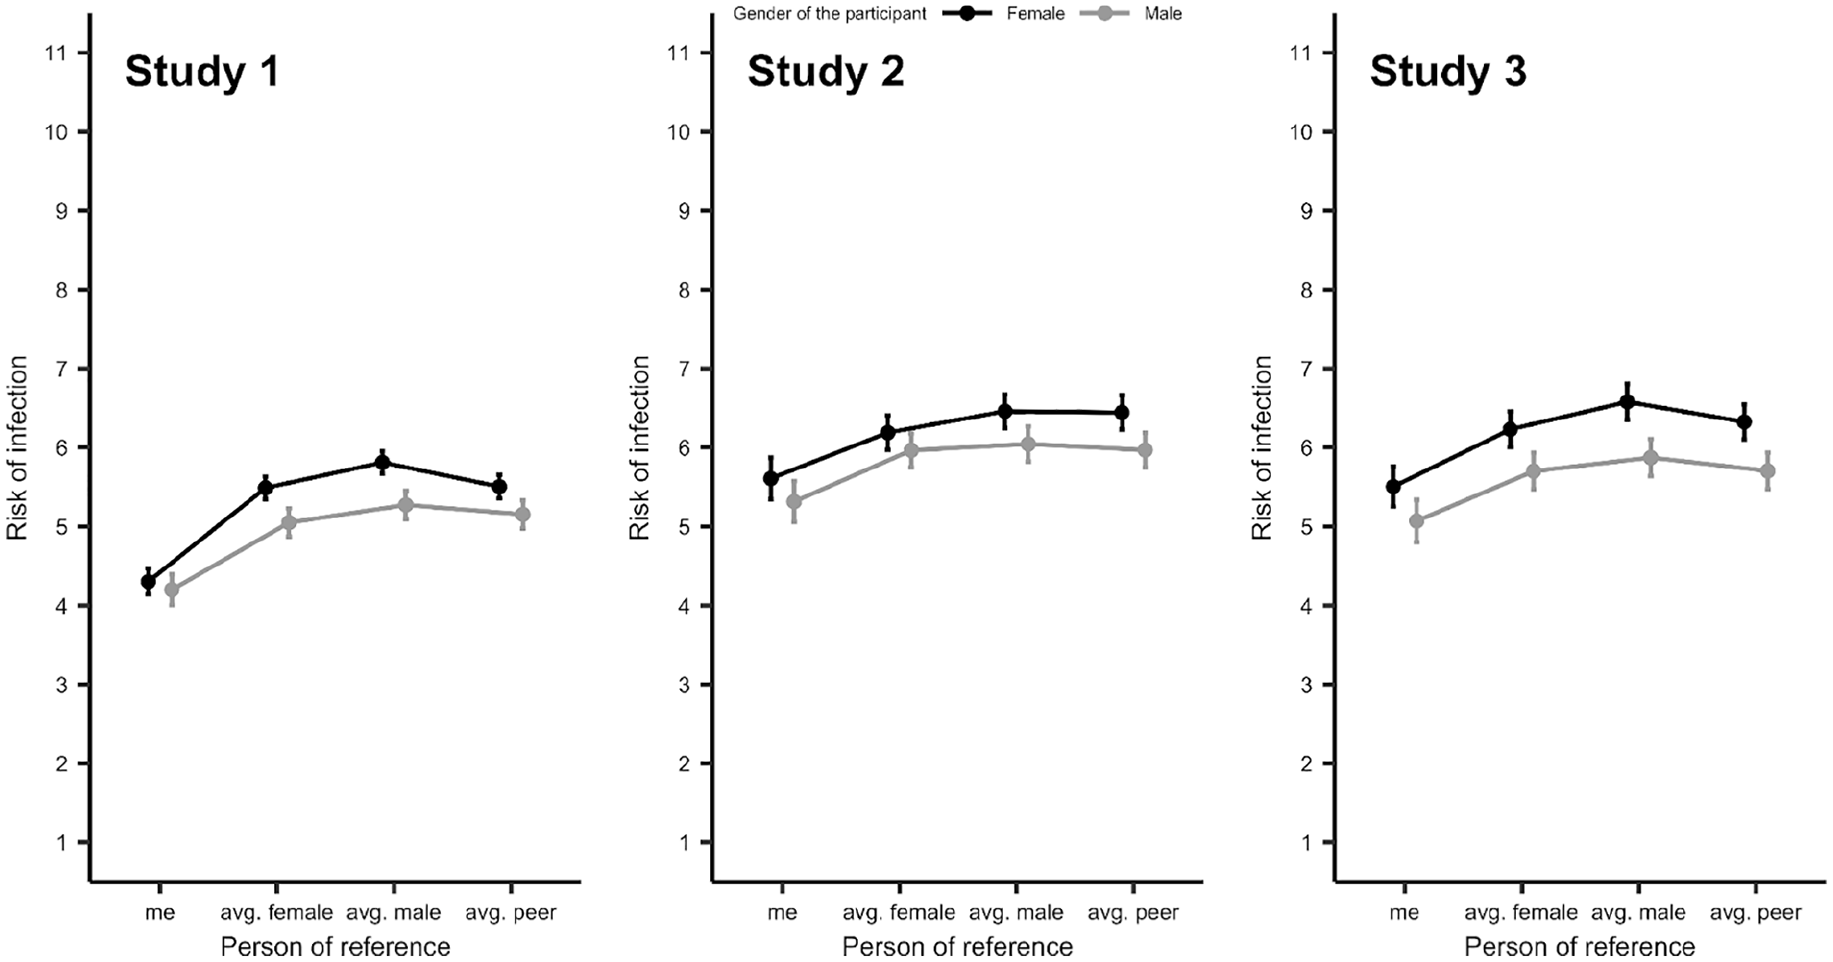
Mean Estimated Risks of Infection as a Function of Various Persons of Reference (Q1–Q4) for Female and Male Participants in Studies 1–3. Black Represents Answers of Female Respondents, and Gray Represents Answers for Male Respondents. Dots and Whiskers Represent Means and 95% Confidence Interval
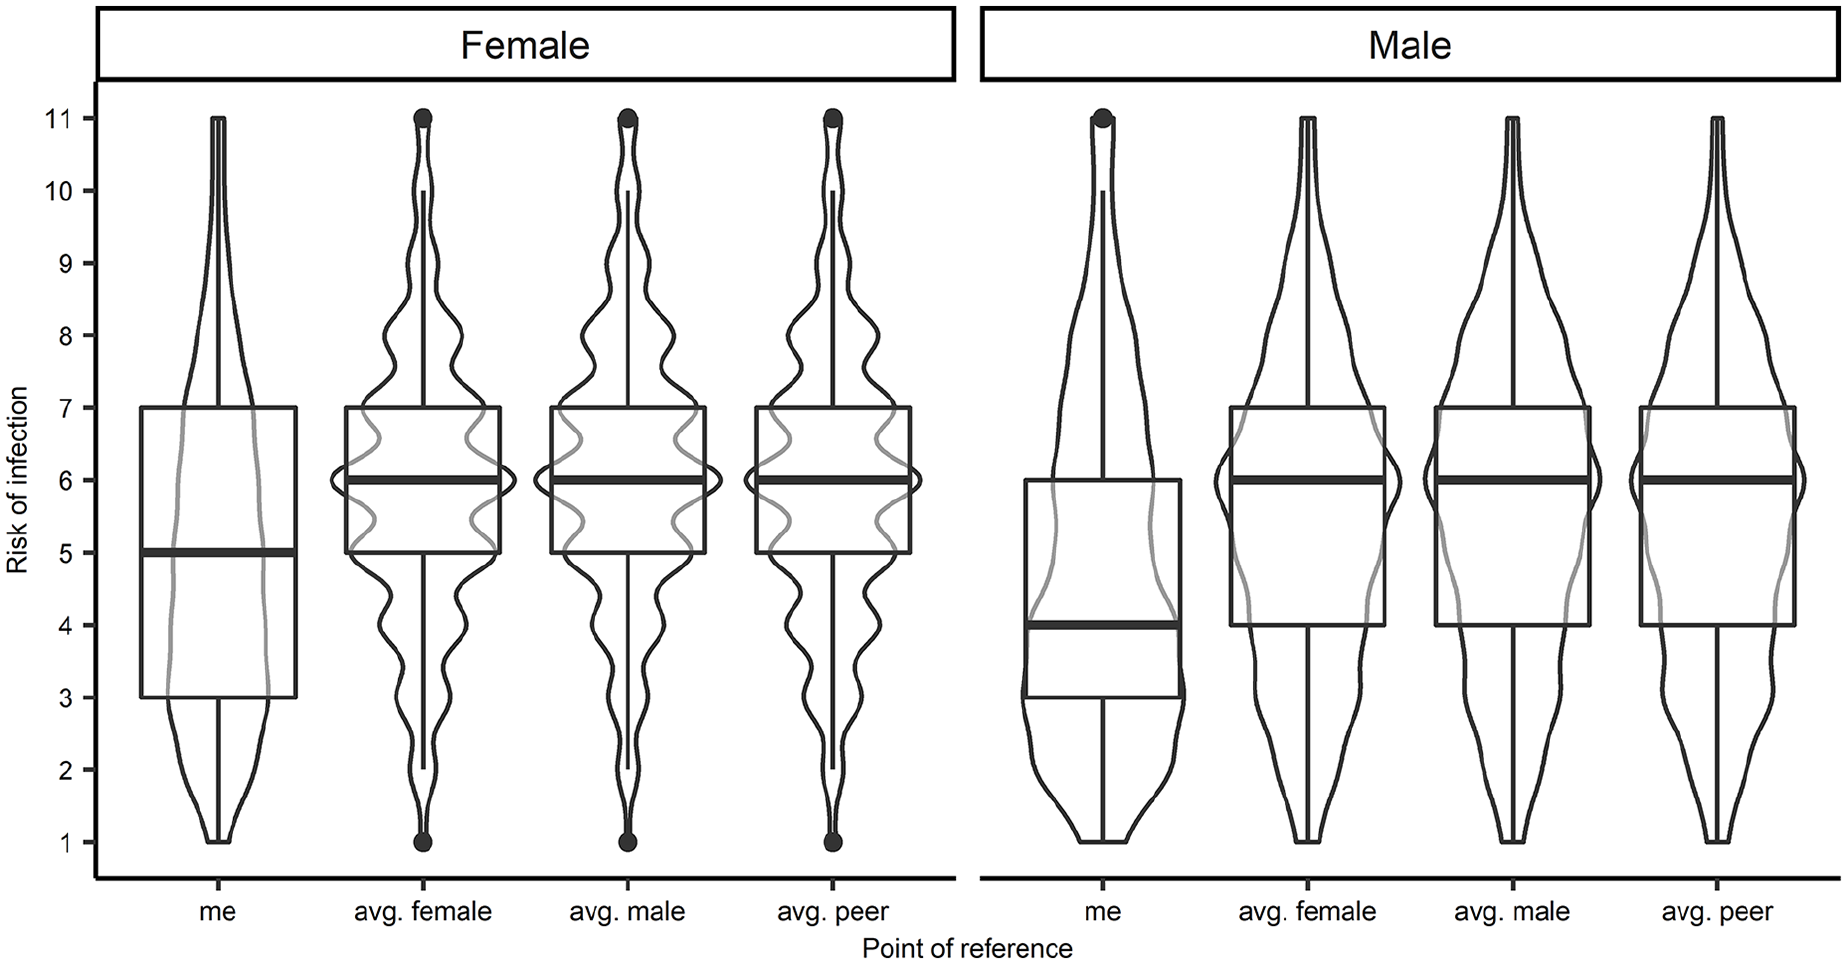
Violin Plots and Box Plots—Distribution of Estimated Risk of Infection for Various Persons of Reference (Q1–Q4) Among Female and Male Participants. Bolded Lines Represent Median Values. The Responses for Studies 1–3 Are Combined
Qualitative Analysis
In this section, we provide qualitative analyses concerning the open questions from Study 2 and Study 3 in which participants were asked to provide justifications for differences in their COVID-19 risk estimations. The participants either were asked to recall whether they perceive the risks as different for males and females (Study 2) or were directly reminded of their similar or dissimilar estimates (Study 3). Afterward, they were asked to justify their views in an open text-box.
Study 2
To analyze participants’ open answers, Structural Topic Models (STMs) were used with the stm package (Roberts et al., 2019) of the software R (R Core Team, 2021). The STM is based on the assumption that documents are produced from a mixture of topics. Topics are then generated from a distribution of words. Based on these assumptions, STM generates topics of correlated words and assigns to each document a proportion of each topic.
To decide the number of topics to extract, 10 model (from 1 to 10 topics) fits were compared. The best solution was chosen based on the highest held-out likelihood (Wallach et al., 2009). The output suggested choosing a model including six topics. We then used the function estimateEffect() to test how gender realism affected the prevalence of each topic. Interestingly, one topic was negatively associated with gender realism, namely, behavioral differences, which specifically refers to gender differences in terms of caution and compliance to medical guidelines (B = −0.20, SE = 0.04, p < .001). Example: “I think females are more careful in everything they do than males.” In other words, participants with bias were more likely to state that women are less vulnerable to COVID-19 infection because they adopt safer behaviors and are more compliant with medical guidelines.
The other two topics were positively associated with realism. In these topics, participants generally claimed that the infection likelihood was the same for both males and females and that sex does not affect the likelihood of infection. In Topic 1, the focus was on the negation of gender differences in the context of COVID-19 infections, whereas the second topic associated with gender realism focused more on highlighting the similar lifestyle of men and women (e.g., “Male and female lifestyles are quietly the same, so there are equal chances for both groups to being infected with SARS-CoV-2”; see Table 4 for the full list of topics). As STMs are based on clusters of words, it is possible that the differences between these topics were related only in the use of specific terms (e.g., “sex” instead of “gender,” “females” instead of “women”).
Topics Identified in the Structural Topic Model Analysis. Each Topic Represents a Cluster of Words (the Most Discriminating Terms a ).

Note. All topics are interpreted in different themes (the topic labels) within documents (i.e., participants’ open answers).
Text cleaning (e.g., punctuation removal, word stemming) was applied to all words before the analysis; thus, the terms showed here are the one used by the software and not typos.
Study 3
We decided the number of topics with the same procedure used in Study 2. In this case, the output with the higher held-out likelihood suggested choosing a model with six topics. Once again, we tested how gender realism affected the prevalence of these topics with the function estimateEffect(). The results replicated what we reported in Study 2: Indeed, gender realism was negatively associated with the topic of behavioral differences (B = −0.14, SE = 0.05, p = .002). Example: “females are more cautious and are seen to be wearing masks more often than males.”
The other three topics were positively associated with realism. In these topics, participants generally claimed that the infection likelihood was the same for both males and females, that sex does not affect the likelihood of infection (e.g., “It depends on the person’s immune system and not gender”; “Each sex has the same chance of being infected, because the virus does not choose sex”; “because they are equally exposed”). Similar to Study 2, we did not manage to infer meaningful semantic differences between these topics, probably because these topics differed for the terms used rather than their meanings. It is also important to note that there are few people who believe that males have a lower likelihood to get infected by COVID-19 (N = 29) and that many of these participants did not answer the open question (N = 19). Overall, the qualitative analysis of Study 3 replicated the results of Study 2.
Discussion
More than 40 years of research has shown the robustness of the UO bias, and our studies provide further evidence with a case study on COVID-19. In the classical literature, comparisons with an “average peer” were employed as a contrast target, while in our three studies we, for the first time, introduced multiple targets, specifically focusing on gender and delivering new insights for the body of literature on the UO bias. When comparing with the “average peer” and with representatives of both genders, participants perceived themselves as less threatened, replicating previous results (Studies 1, 2, and 3). However, when comparisons were featured in terms of gender, a more nuanced pattern of results was reported: Respondents of both genders perceived women as less threatened than men. Study 2 and Study 3 qualitatively explored a question of what stands behind such different risk assessments for men and women. It was reported that women are perceived as more cautious and more compliant with medical guidelines. It was also reported that being aware of bias did not change this perception.
These results bring novelty to the biased social comparisons literature: It is important to whom participants compare themselves, which is of concern from the point of view of extending the literature not only on UO but also on gender-specific comparisons. In the light of these results, the novelty for the existing research on UO is at least twofold.
The first is theoretical/scientific. Comparing the probability of (un)desired events not only with an in-group member (person of the same gender) but also with an out-group member (person of the different gender) allows the assessment of how generalized the notion of “being superior” in comparison with others is. What is more, it is possible that in contexts other than COVID-19 infection, one of the genders may be more in danger of, for example, HIV infection (Arora, 2021) or cancer incidence (Kim et al., 2018).
The second novelty is applied in nature. First, as the launching pad of the above-described studies was the COVID-19 pandemic, the results may be interesting from the point of view of practitioners. Practitioners should take into account the strength of UO and start treating it as a (statistical) norm rather than a deviation from the norm. In the same vein, they should diagnose whether UO stems from health-oriented behaviors (one person thinks that she/he is more involved—in comparison with others—in pro-health behaviors), or a pure bias, without any grounded data to come to such a conclusion. This last notion may be especially dangerous because such a conclusion may lead to neglecting any health-oriented behaviors.
One crucial question that needs to be addressed when interpreting our results pertains to the actual ratio of risk to which males and females are exposed. Considering the epidemiological data from the United States, there are no significant, consistent differences in the COVID-19 infection rates between men and women.
One can find fragmentary evidence for both genders being more at risk, depending on the state, stage of the pandemic, or age group one takes into account (Danielsen et al., 2022). However, on average, the differences in the infection rates are negligible (Elflein, 2020). The gender differences are significant and almost universal when it comes to COVID-19-related death rates. Considering the data from the United States gathered between April 27, 2020, and May 10, 2021, the average ratio of dying from COVID-19 between men and women was 1.14 in favor of men (Danielsen et al., 2022). Therefore, it would be better if men were not optimistic about their risks.
Women holding a view of being less exposed to danger compared with men could be dangerous in other domains. Future studies should explore the presence of such asymmetries in male and female respondents, and the consequences in terms of health-related decision-making.
Judging by the best available data, respondents are wrong when assuming that there are significant differences between men and women in their chances of being infected, but if respondents consider the overall risks related to being ill, they are correct to attribute the greater risk to men. This conclusion needs further deliberation.
The literature on the UO bias clearly highlights the notion of “unrealistic”—when the vast majority of respondents claim to be more exposed to benefits (like being healthy) in comparison with average peers while being less exposed to threats (like being infected with the COVID-19). The aforementioned data on less nuanced comparisons replicate this claim. In the light of big data on COVID-19, nuanced comparisons between genders have become realistic. Finally, it seems impossible that respondents of our studies had medical knowledge of such differences, so this effect may be illusory. More studies on that issue should be conducted. It is necessary to run a study on UO bias in a medical domain in which there are no differences between gender or where the differences are in the opposite direction. If the same pattern of results is identified, this claim of gender differences would be delusional: unrealistic. If, however, the pattern of results is different from that reported above, further research on possible discrepancies would be needed.
Limitations
The above reported studies were run during the COVID-19 pandemic, and this situation offered a unique basis for highly relevant, salient, and ecologically valid social comparisons with others. Thanks to this moment in time our question to participants to compare—while facing great danger—themselves with others was real. This advantage is, however, a double-edged sword. At the same time, the coronavirus context also creates a clear limitation since the question arises: Is this pattern of results replicable in the context of other great dangers as well? With the present data in hand, we are unable to address this issue, and more replication studies are strongly recommended.
Another issue is the online character of our studies. As they were run under curfews, lockdowns, and other restrictions regulating social interactions, one should keep in mind that replication in a non-internet context would be highly recommended. Two advantages would emerge from such a replication of our studies. First, it is possible that an online community, that is, people who use computers/smartphones to participate in studies, is somehow different from a general sample. Reassurance against this limit is, however, provided by the consistent pattern across the three studies, especially considering that Study 1 involved a sample that is representative of the population. Second, it is also possible that the specific situation of a previously unknown great danger affected the pattern of results. In other words, other predictable global (heath) dangers might produce different patterns of results.
A last important limitation rests on the dichotomous appraisal of gender. In our study, we only evaluated male and female targets. The number of nonbinary respondents did not allow us to inspect the specificity of this group. Future studies should overcome this narrow perspective on gender.
Future Directions
In these studies, we tested comparisons with gender-specified or unspecified peers while facing the great danger of COVID-19 infection. We should, however, keep in mind that the UO bias has been reported not only while facing a danger but also when positive outcomes were in play (e.g., a raise at work, Ngan & Tze-Ngai Vong, 2019). It is clear that this second part of the full picture of this specific aspect of biased social comparisons is missing: Future studies might replicate the reported results in a positive context. In this case, we would know how general our effect is, that is, it is important to which gender the participant compares themself.
Other than gender, further nuanced biased social comparisons are recommended. One may think of a study in which comparisons are made with not a “general average peer” but with specific groups, for example, in-group/out-group members like (un)(partially)vaccinated against COVID-19 peers. In this case, one might test more nuanced comparisons in a different aspect than reported above. The present situation—when large amounts of citizens all around the world are still un/partially/vaccinated—makes this replication possible.
A further future direction could be envisaged in the behavioral spillover effect of the identified bias. Do lower estimates among male respondents turn into a dismissal of the symptoms, with the risk of a late reaction and medical intervention? Such a pattern is worth exploring, as it may partially explain the gender asymmetry in serious consequences of a virus that is as likely to infect both men and women.
Finally, as discussed in the introduction, further studies on nuanced biased comparisons in different theoretical and empirical contexts would be very interesting. The question arises: Does the pattern of results of such social comparisons change when not grounded in the UO field? In other words, future studies might address the generalizability of the effects reported above (gender-nuanced biased social comparisons) across other theoretical contexts (e.g., BTAE).
Conclusion
Results consistently indicate that in the case of the UO bias, a nuanced (by gender of the person to whom a comparison was conducted) comparison between the participant and an “average peer” reveals a previously unknown pattern of results. In the case of COVID-19 infection risk, participants perceived women as less threatened than men as men were perceived as less cautious and less compliant with medical guidelines, and awareness of this biased perception did not reduce UO.
Supplemental Material
sj-docx-1-jmh-10.1177_15579883231152154 – Supplemental material for It Matters to Whom You Compare Yourself: The Case of Unrealistic Optimism and Gender-Specific Comparisons
Supplemental material, sj-docx-1-jmh-10.1177_15579883231152154 for It Matters to Whom You Compare Yourself: The Case of Unrealistic Optimism and Gender-Specific Comparisons by Wojciech Kulesza, Dariusz Dolinski, Caterina Suitner, Oliver Genschow, Paweł Muniak, Kamil Izydorczak and Bruno Gabriel Salvador Casara in American Journal of Men's Health
Supplemental Material
sj-docx-2-jmh-10.1177_15579883231152154 – Supplemental material for It Matters to Whom You Compare Yourself: The Case of Unrealistic Optimism and Gender-Specific Comparisons
Supplemental material, sj-docx-2-jmh-10.1177_15579883231152154 for It Matters to Whom You Compare Yourself: The Case of Unrealistic Optimism and Gender-Specific Comparisons by Wojciech Kulesza, Dariusz Dolinski, Caterina Suitner, Oliver Genschow, Paweł Muniak, Kamil Izydorczak and Bruno Gabriel Salvador Casara in American Journal of Men's Health
Supplemental Material
sj-docx-3-jmh-10.1177_15579883231152154 – Supplemental material for It Matters to Whom You Compare Yourself: The Case of Unrealistic Optimism and Gender-Specific Comparisons
Supplemental material, sj-docx-3-jmh-10.1177_15579883231152154 for It Matters to Whom You Compare Yourself: The Case of Unrealistic Optimism and Gender-Specific Comparisons by Wojciech Kulesza, Dariusz Dolinski, Caterina Suitner, Oliver Genschow, Paweł Muniak, Kamil Izydorczak and Bruno Gabriel Salvador Casara in American Journal of Men's Health
Footnotes
Declaration of Conflicting Interests
The author(s) declared no potential conflicts of interest with respect to the research, authorship, and/or publication of this article.
Funding
The author(s) disclosed receipt of the following financial support for the research, authorship, and/or publication of this article: This research was supported by the Polish National Agency for Academic Exchange (NAWA) within the Urgency Grants granted to Wojciech Kulesza (number: PPN/GIN/2020/1/00063/U/00001).
Ethical Approval
The study was reviewed and approved by the ethics committee of the SWPS University of Social Sciences and Humanities in Wroclaw, Poland (protocol number: 03/P/04/2020, title of the study: Psychosocial Consequences of the Coronavirus Pandemic).
Supplemental Material
Supplemental material for this article is available online.
References
Supplementary Material
Please find the following supplemental material available below.
For Open Access articles published under a Creative Commons License, all supplemental material carries the same license as the article it is associated with.
For non-Open Access articles published, all supplemental material carries a non-exclusive license, and permission requests for re-use of supplemental material or any part of supplemental material shall be sent directly to the copyright owner as specified in the copyright notice associated with the article.