
Abstract
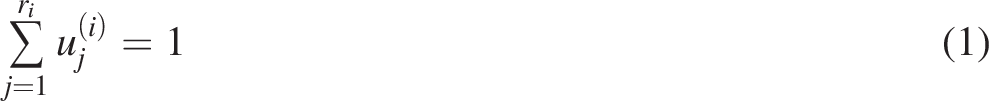
Comparative analysis of sequence similarity distributions reveals evolutionary mechanisms shaping gene families. In Salmonidae, whole-genome duplication (WGD) and rapid speciation pose a challenge for modeling retained homologs and sequence divergence. We introduce a stochastic branching-process framework that models sequence similarity decay over evolutionary time and quantifies fractionation rates across successive duplication events. We derive moment-generating functions of pairwise similarity scores and carry out simulation-based validation. Applying our model to multiple salmonid genomes (Atlantic salmon, rainbow trout, Chinook salmon, …), we not only recapitulate observed bimodal similarity distributions, but we also quantify gene retention across evolutionary branches. Results indicate that the estimated fractionation rates for both WGDs (
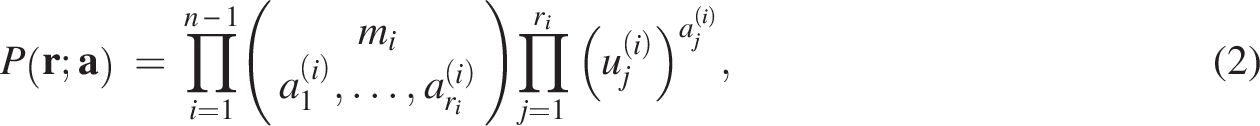
Keywords
INTRODUCTION
Whole-genome duplications (WGDs) have been pivotal in shaping the evolutionary trajectory of teleost fish, providing raw material for functional diversification. Two early rounds of duplication in the vertebrate ancestor (1 R and 2 R) laid the foundation for vertebrate complexity, followed by the teleost-specific duplication (Ts3R) approximately 300 million years ago (Mya) (Jaillon et al., 2004; Near et al., 2012; Glasauer and Neuhauss, 2014; Robertson et al., 2017). A subsequent event, the salmonid-specific autotetraploidization (Ss4R), occurred around 80 Mya, profoundly influencing genome architecture and gene function within salmonids (Macqueen and Johnston, 2014; Lien et al., 2016, 2021). Post-WGD processes in salmonids involve extensive fractionation and subfunctionalization, which have contributed to their ecological and physiological diversity. Beyond salmonids, lineage-specific WGDs such as Cat-4R in Chinese sucker (Myxocyprinus asiaticus, 60 Mya) indicate the diversity of post-duplication trajectories, showing conserved synteny and relatively stable genome structures in contrast to the widespread rearrangements seen in other polyploid fish lineages (Kumar et al., 2017; Bagley et al., 2018; Lecaudey et al., 2018; Krabbenhoft et al., 2021).
Understanding the evolutionary consequences of WGD requires more than identifying duplicate genes. It involves characterizing the processes that govern their retention, divergence, and loss. Previous work, including Yu and Sankoff (2022), showed that fractionation during synteny evolution is not random but influenced by genomic context, dosage balance, and chromosomal rearrangements (Blanc and Wolfe, 2004; Zhang et al., 2021a).
In this study, we analyze coding-sequence similarity among paralogous gene pairs. Our framework applies a discrete-time branching process to model duplicate retention and loss while incorporating stochastic sequence divergence. Two processes dominate this dynamic: (i) WGD-driven duplication, which creates gene pairs, and (ii) fractionation, which eventually removes one gene from most pairs. Together, these processes produce a mixture of similarity distributions, where distinct peaks often reflect different duplication events.
While the branching-process approach has been successfully applied in plant comparative genomics, this study represents its first application to teleost fish. To overcome challenges such as overlapping signals and synteny erosion in older WGDs, we extend the original model with two innovations: (i) a moment-based probabilistic formulation using the moment-generating function (MGF) to derive closed-form expectations and variances; (ii) simulation-based validation with Gaussian mixtures to ensure robust cutoff-based event separation; and (iii) an integrated approach that combines Ks values with sequence similarity to improve resolution in cases where multiple duplication signals overlap.
BRANCHING PROCESS MODEL IN THE WGD CONTEXT
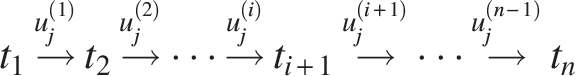
Gene proliferation and loss within genomes can be modeled as a population of genes evolving stochastically (see Eq. 2). Discrete-time branching processes provide a good model for WGDs and gene loss.
Consistent with previous research methodologies (Blanc and Wolfe, 2004; Glasauer and Neuhauss, 2014; Zhang et al., 2021a), the survival or deletion of each gene in subsequent generations is treated as a multinomial event, with the assumption that at least one gene remains. This framework allows for the estimation of
A complete combinatorial formulation of evolutionary histories under this model, including the probability of specific configurations
The observations are made at time
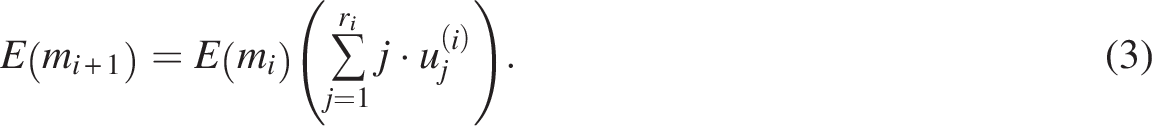
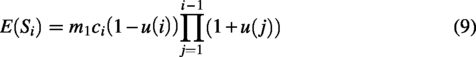
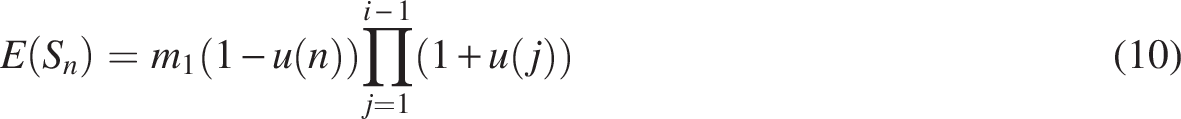
Using expected values allows for straightforward calculation of useful expressions. This feature is pivotal for a comprehensive analysis of gene pair similarity distributions. The expected number of genes at time
Our analysis focuses on the evolution of gene pairs surviving from WGD events. Each pair evolves independently, with sequence similarity declining over time due to the accumulation of random mutations at both nucleotide and amino acid levels. Because simultaneous loss of both copies in a functional pair is assumed to be deleterious, the model excludes concurrent deletion events. Combining these assumptions with the branching process, we compute the expected number of descendant gene pairs

Synteny block
We examined two categories of retained duplicate gene pairs: (i) individual pairs, analyzed without reference to genomic context, and (ii) synteny-block pairs, located within conserved blocks that preserve gene order. Histogram analysis of these two categories (Appendix A1, Fig. A1) showed a bimodal distribution of similarity values. The pattern was more evident for synteny-block pairs, reflecting stronger signals of both ancient and recent duplication events.
We also identified singleton genes, defined as duplicates with no corresponding copy in any synteny block (horizontal markers in Fig. 1). These reflect gene loss or rearrangement and were traced back to conserved regions to infer their origin.
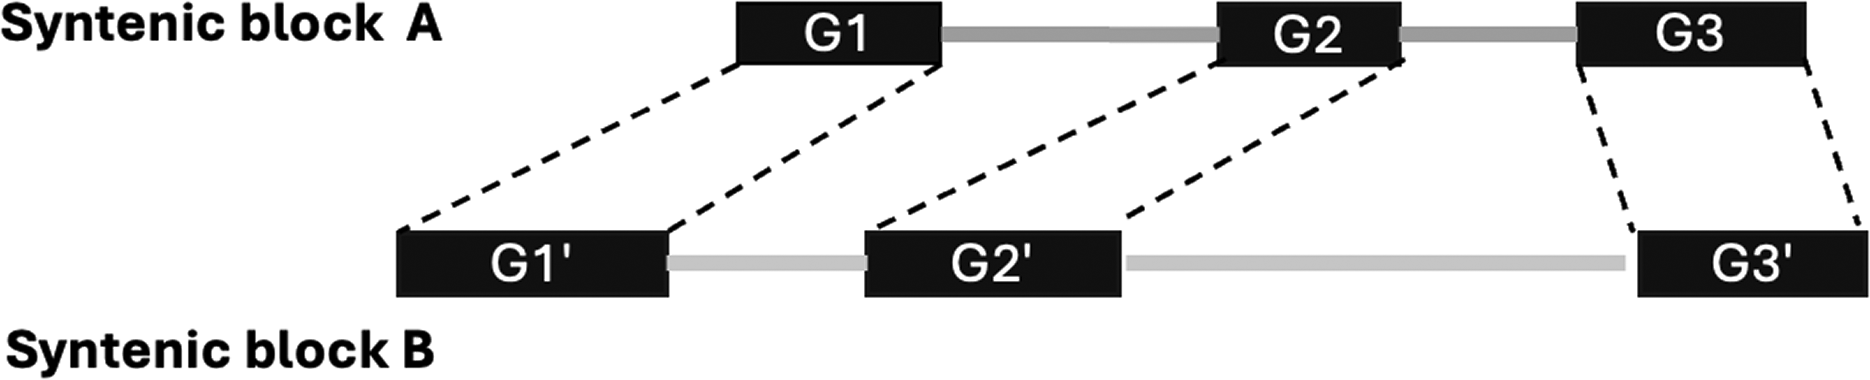
Example of two conserved synteny blocks
To estimate the number of singleton genes, we subtract the count of genes in
Our model assumes uniform fractionation probability across same WGD events, selecting one pair for loss at each step. Although fractionation within blocks introduces local dependencies, our analysis focuses on sums of expected values, avoiding any nonindependence effects in calculations.
Over time, fractionation erodes synteny blocks through processes such as chromosomal rearrangement and gene pair divergence, compounded by technical limitations in block detection, including threshold-based filtering to distinguish true collinearity from background noise. This phenomenon, termed block crumble, complicates the inference of gene retention rates for older WGD events by underestimating the number of gene pairs and singletons originally present in these blocks, thereby biasing retention estimates.
To mitigate this bias, we use the concept of a “syntenic cohort” and employ a set of “crumble coefficients”
A model for synteny blocks
By incorporating these adjustments, we refine our understanding of synteny block erosion across evolutionary intervals. This is particularly relevant for genomes that have experienced multiple rounds of replication (Zhang et al., 2021a).
For example, consider a single gene at

In general, as illustrated in Figure 2, we count gene pairs at time
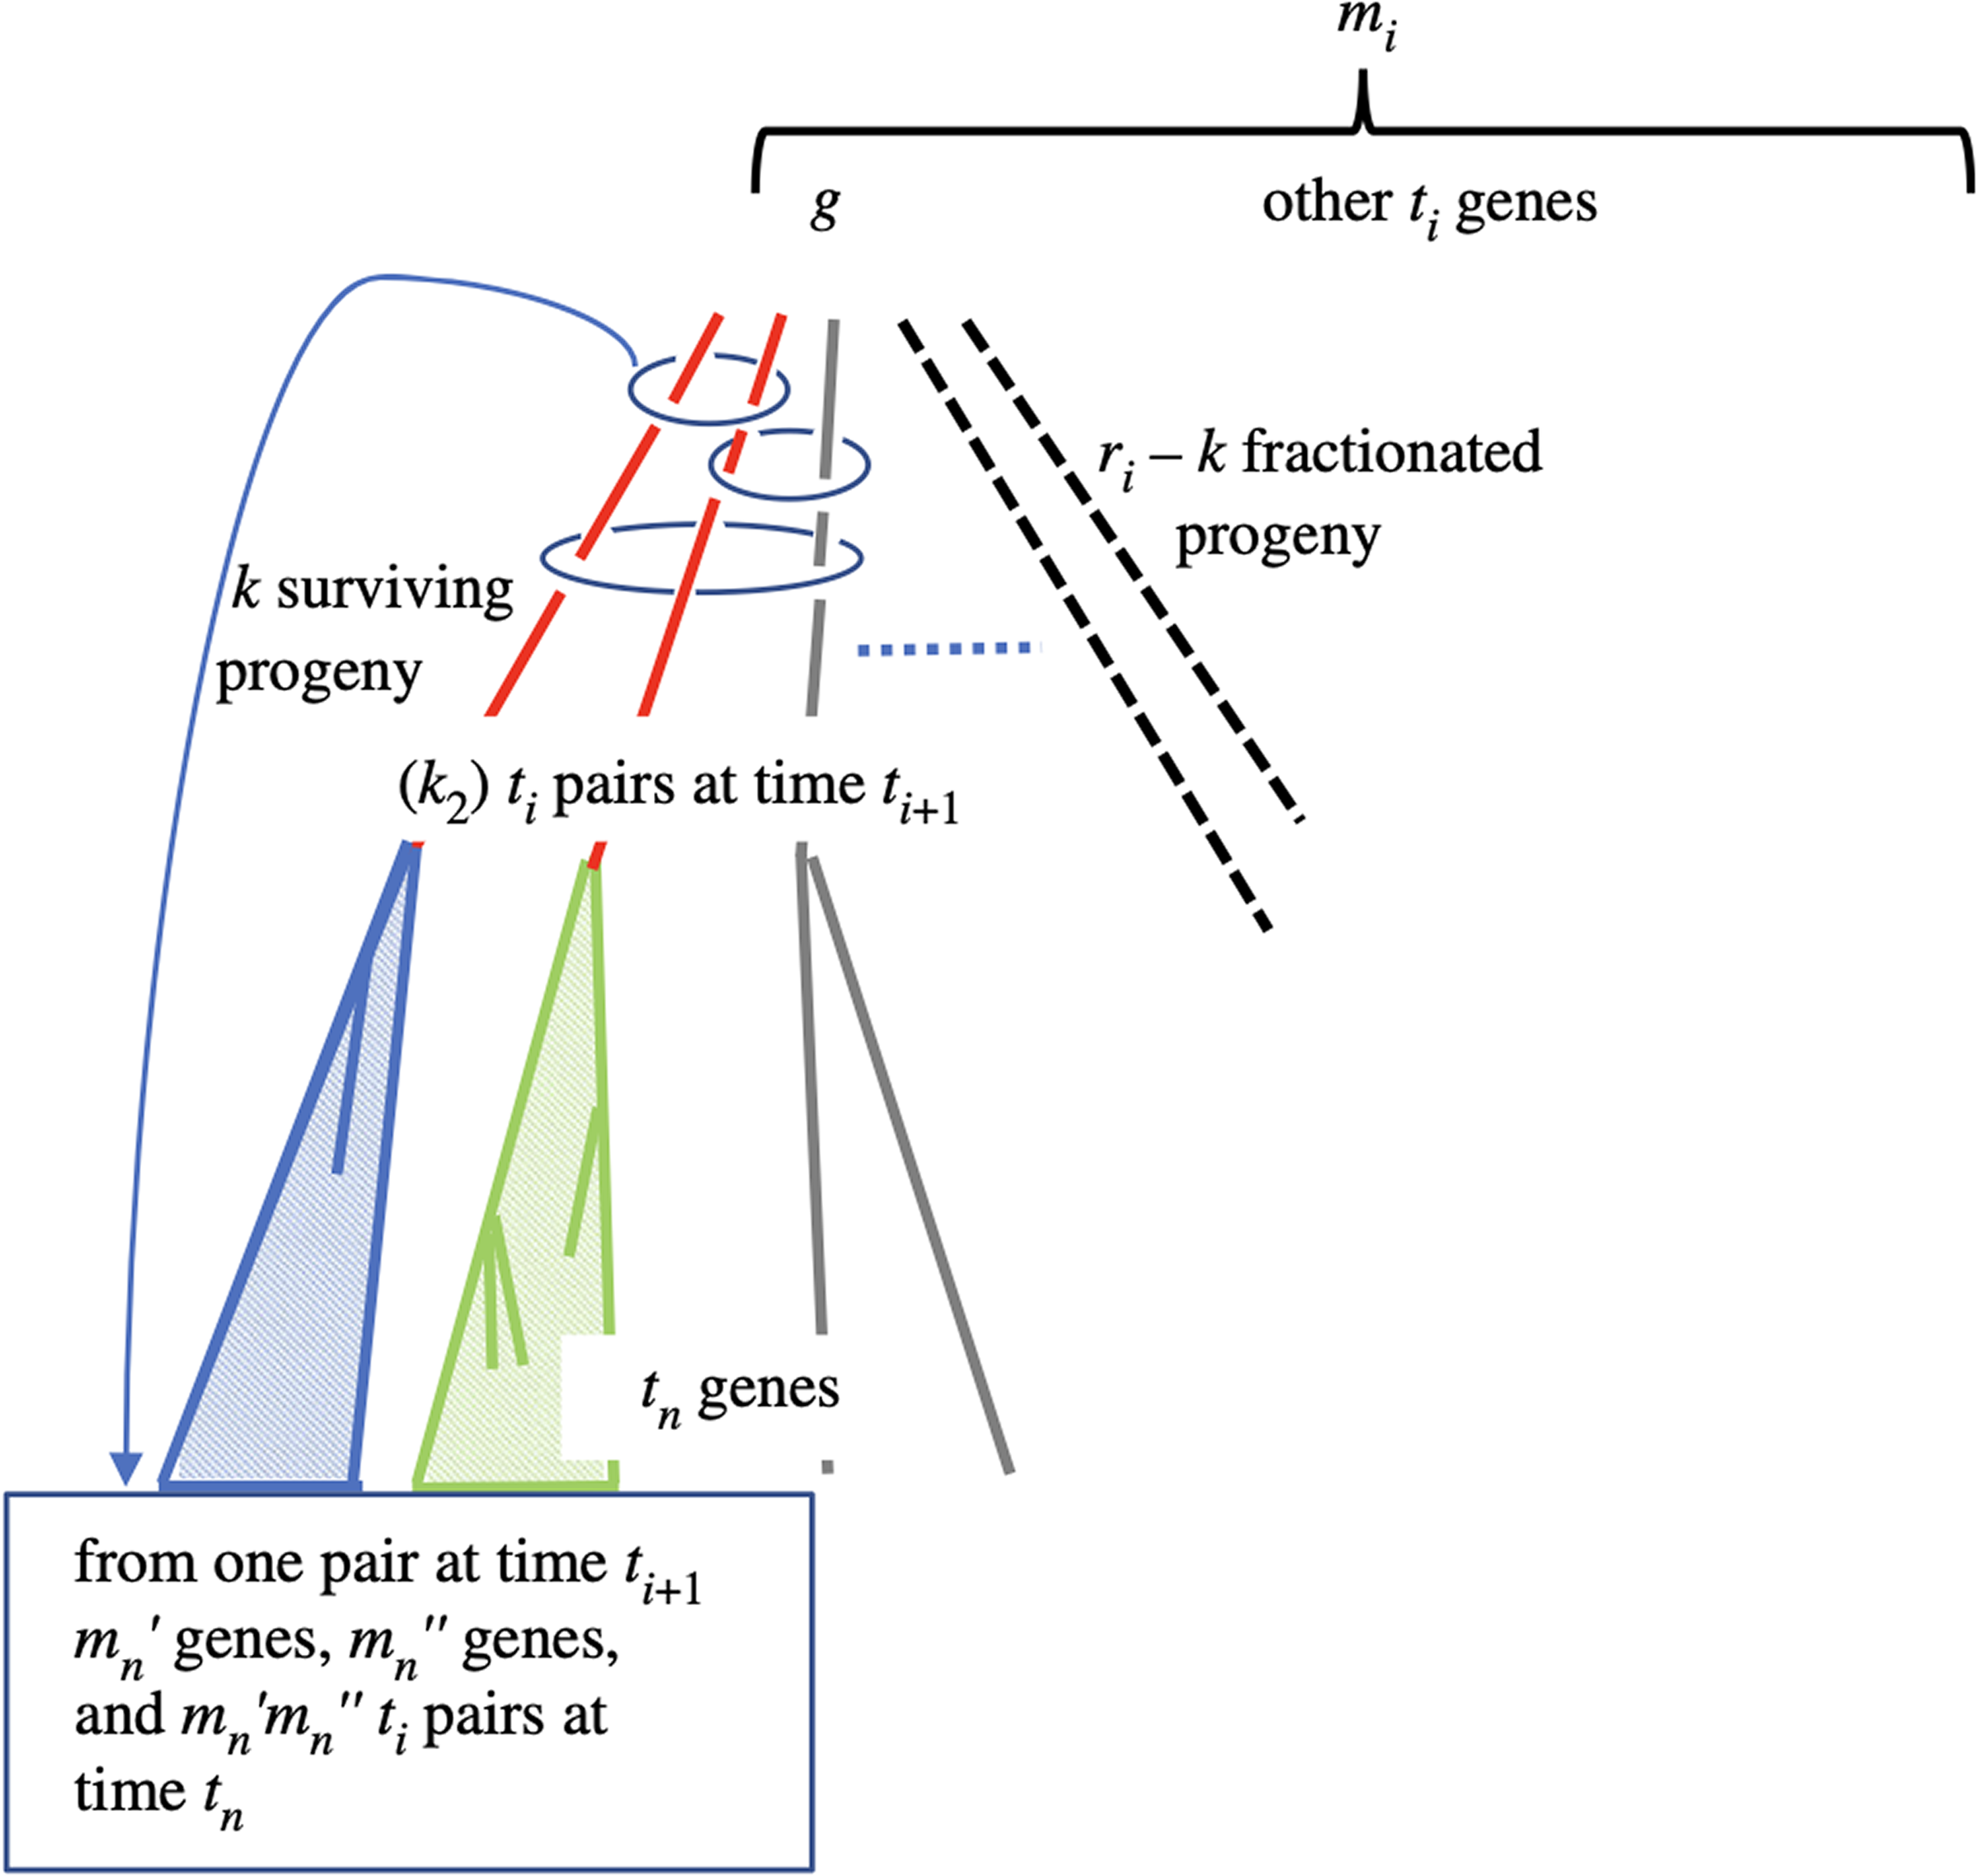
The three unfractionated descendants of gene g at time
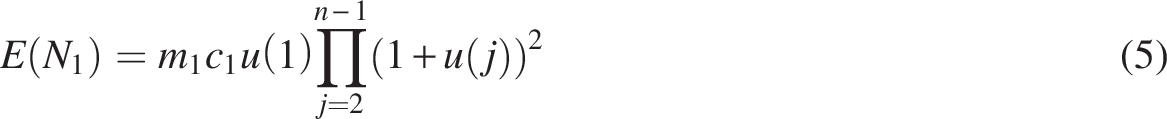
Equation (5) gives the expected number of pairs originating at
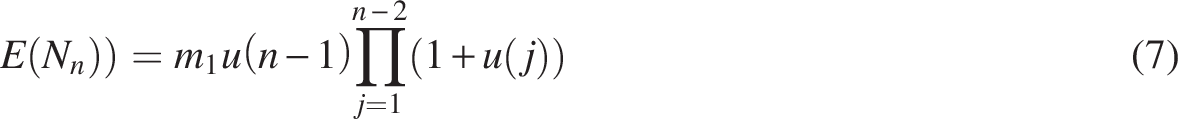
The expected values of singleton are as follows:

The number of gene pairs and singleton genes within the identified components is counted. These observed counts are substituted into evolutionary equations in Table 1, allowing for the estimation of evolutionary rates within the model.
The Expected Number of Pairs and Singletons for Two Successive WGDs
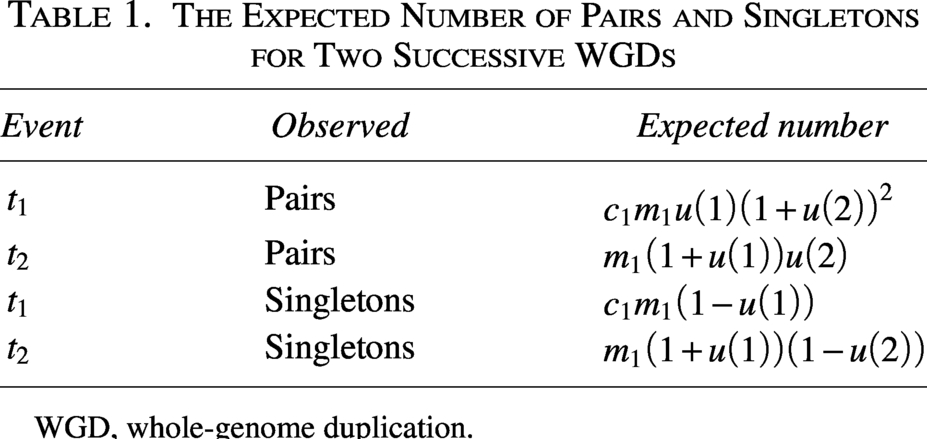
WGD, whole-genome duplication.
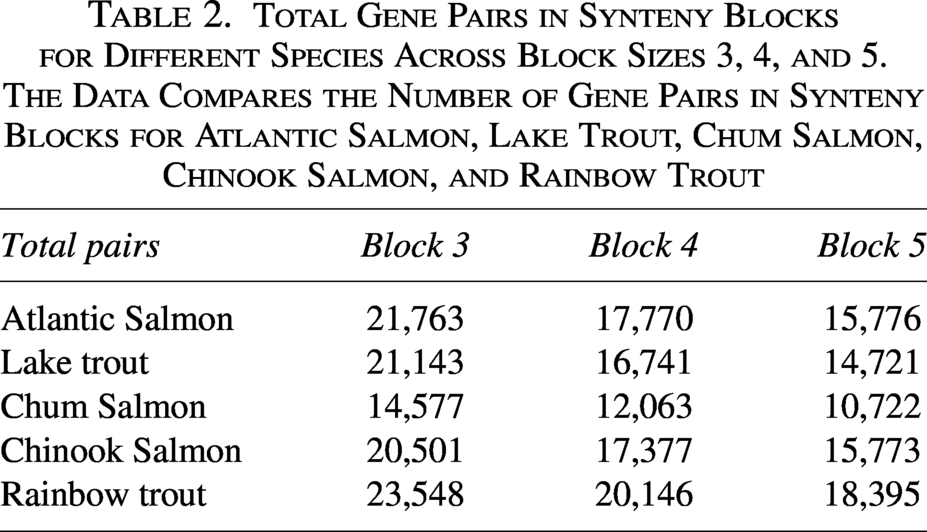
Total Gene Pairs in Synteny Blocks for Different Species Across Block Sizes 3, 4, and 5. The Data Compares the Number of Gene Pairs in Synteny Blocks for Atlantic Salmon, Lake Trout, Chum Salmon, Chinook Salmon, and Rainbow Trout
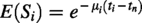
While these equations in Section 2 quantify the number of expected surviving pairs, they do not yet explicitly model how sequence similarity between retained gene pairs decays over time. To incorporate evolutionary divergence, we introduce a similarity decay function:
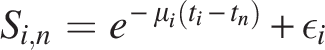
Here,
For comparison, we also evaluated a model for multiple substitutions and back mutations,
To characterize the distribution of S, we derive its MGF:
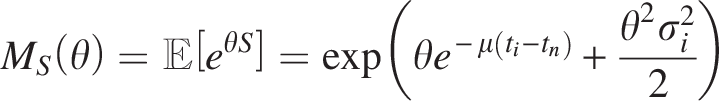
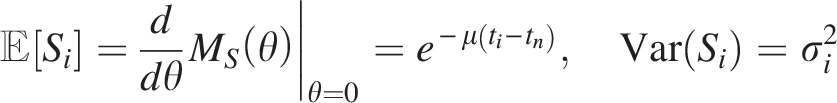
This closed-form expression facilitates the derivation of moments. Specifically, the first moment (expected value) and second central moment (variance) are:
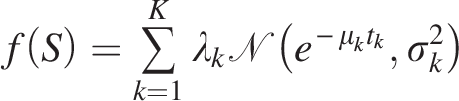
After fitting the similarity distribution with a Gaussian mixture model using mixtools (Benaglia et al., 2009), we estimate the component parameters (
In the Gaussian mixture model,
Differentiating the log-likelihood with respect to h and solving yields:
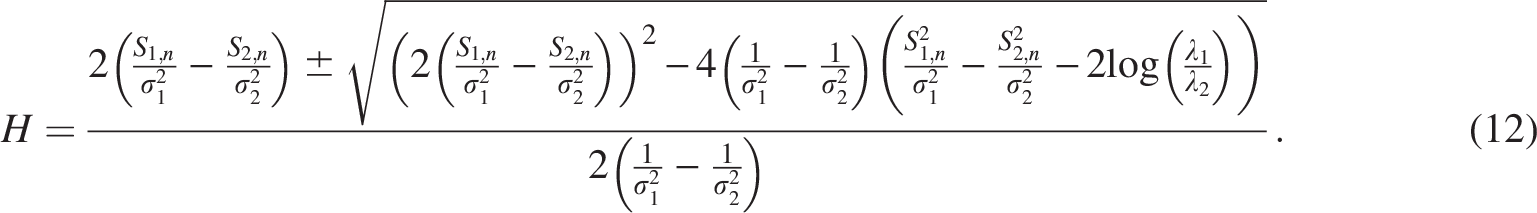
For simplicity, the solution reduces to a weighted average when 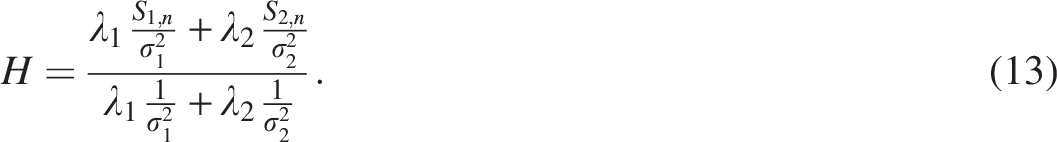
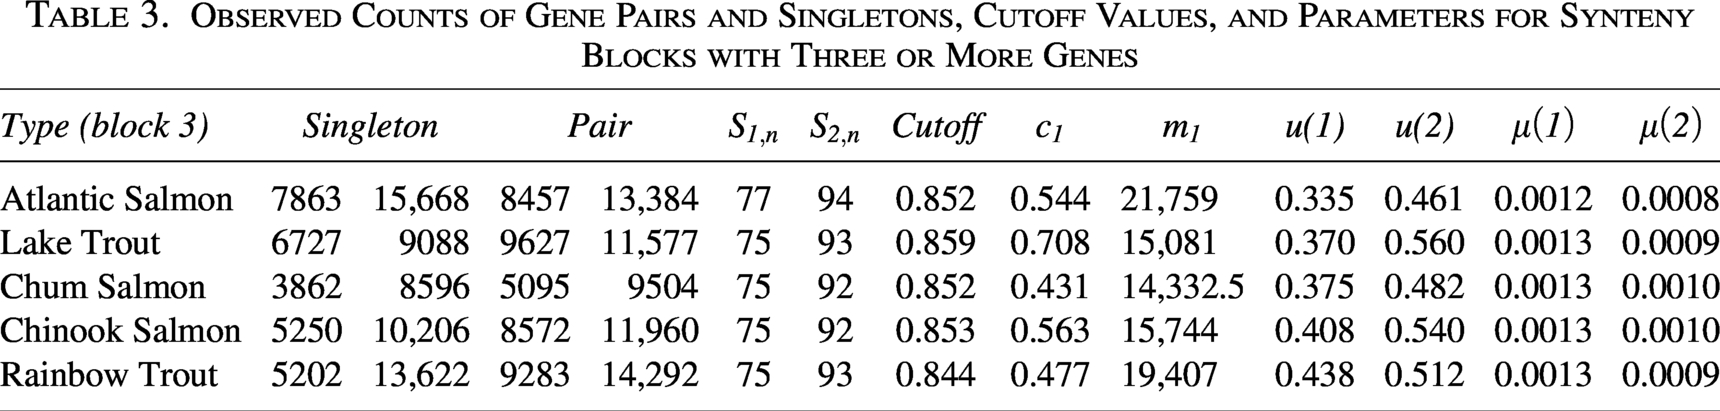
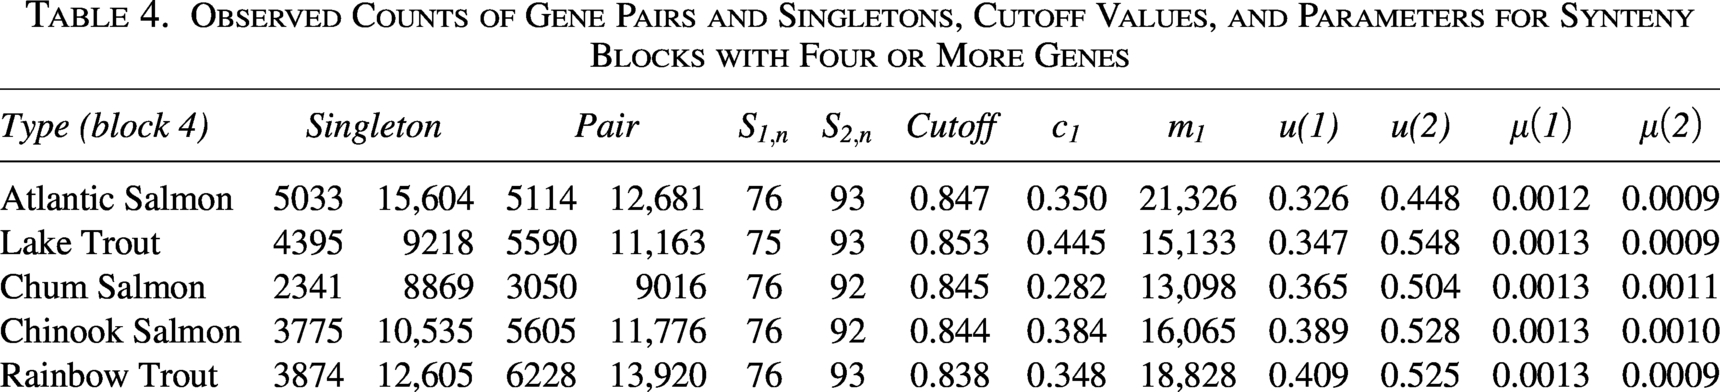
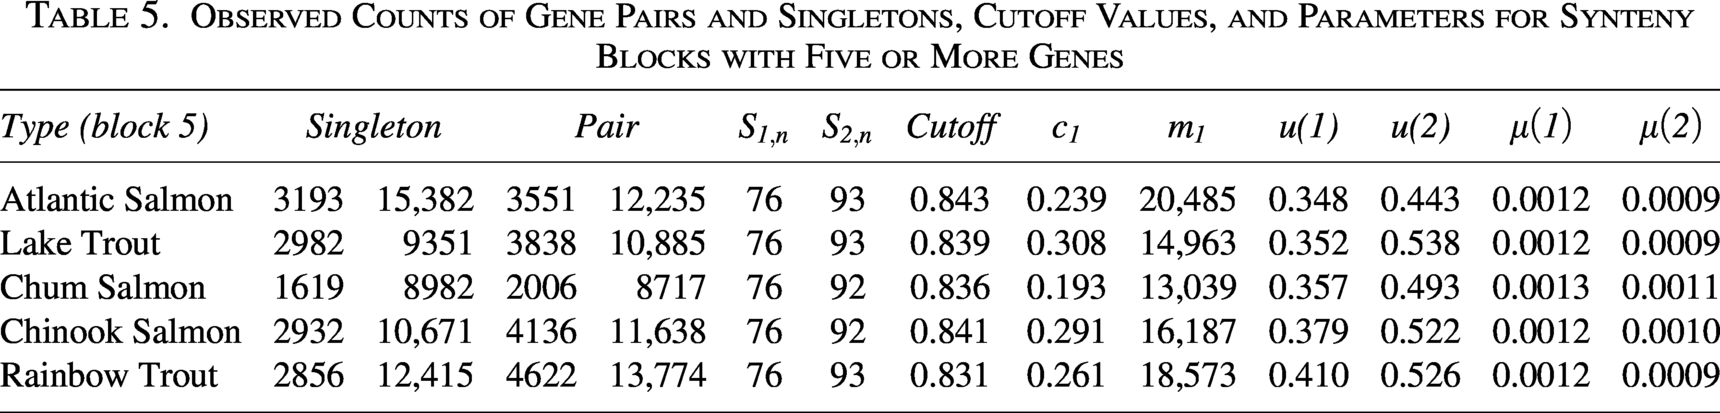
Pairs with similarity above H are assigned to the most recent WGD; those below are inferred as older duplicates. These optimal cutoff values, which separate gene pairs into distinct evolutionary groups, are summarized in Tables 3–5.
Observed Counts of Gene Pairs and Singletons, Cutoff Values, and Parameters for Synteny Blocks with Three or More Genes
Observed Counts of Gene Pairs and Singletons, Cutoff Values, and Parameters for Synteny Blocks with Three or More Genes
Observed Counts of Gene Pairs and Singletons, Cutoff Values, and Parameters for Synteny Blocks with Four or More Genes
Observed Counts of Gene Pairs and Singletons, Cutoff Values, and Parameters for Synteny Blocks with Five or More Genes
The analytical workflow begins with extracting relevant genomic sequences and proceeds through synteny block identification and evolutionary rate estimation (Fig. 3). We use CoGe’s SYNMAP with default settings to perform a genome self-comparison, detecting regions of conserved gene order and orientation (synteny blocks). Block detection depends on parameters such as the number of collinear genes, intergenic distances, and sequence similarity. In practice, we used a maximum gap of 20 genes and a minimum of three to five collinear gene pairs.
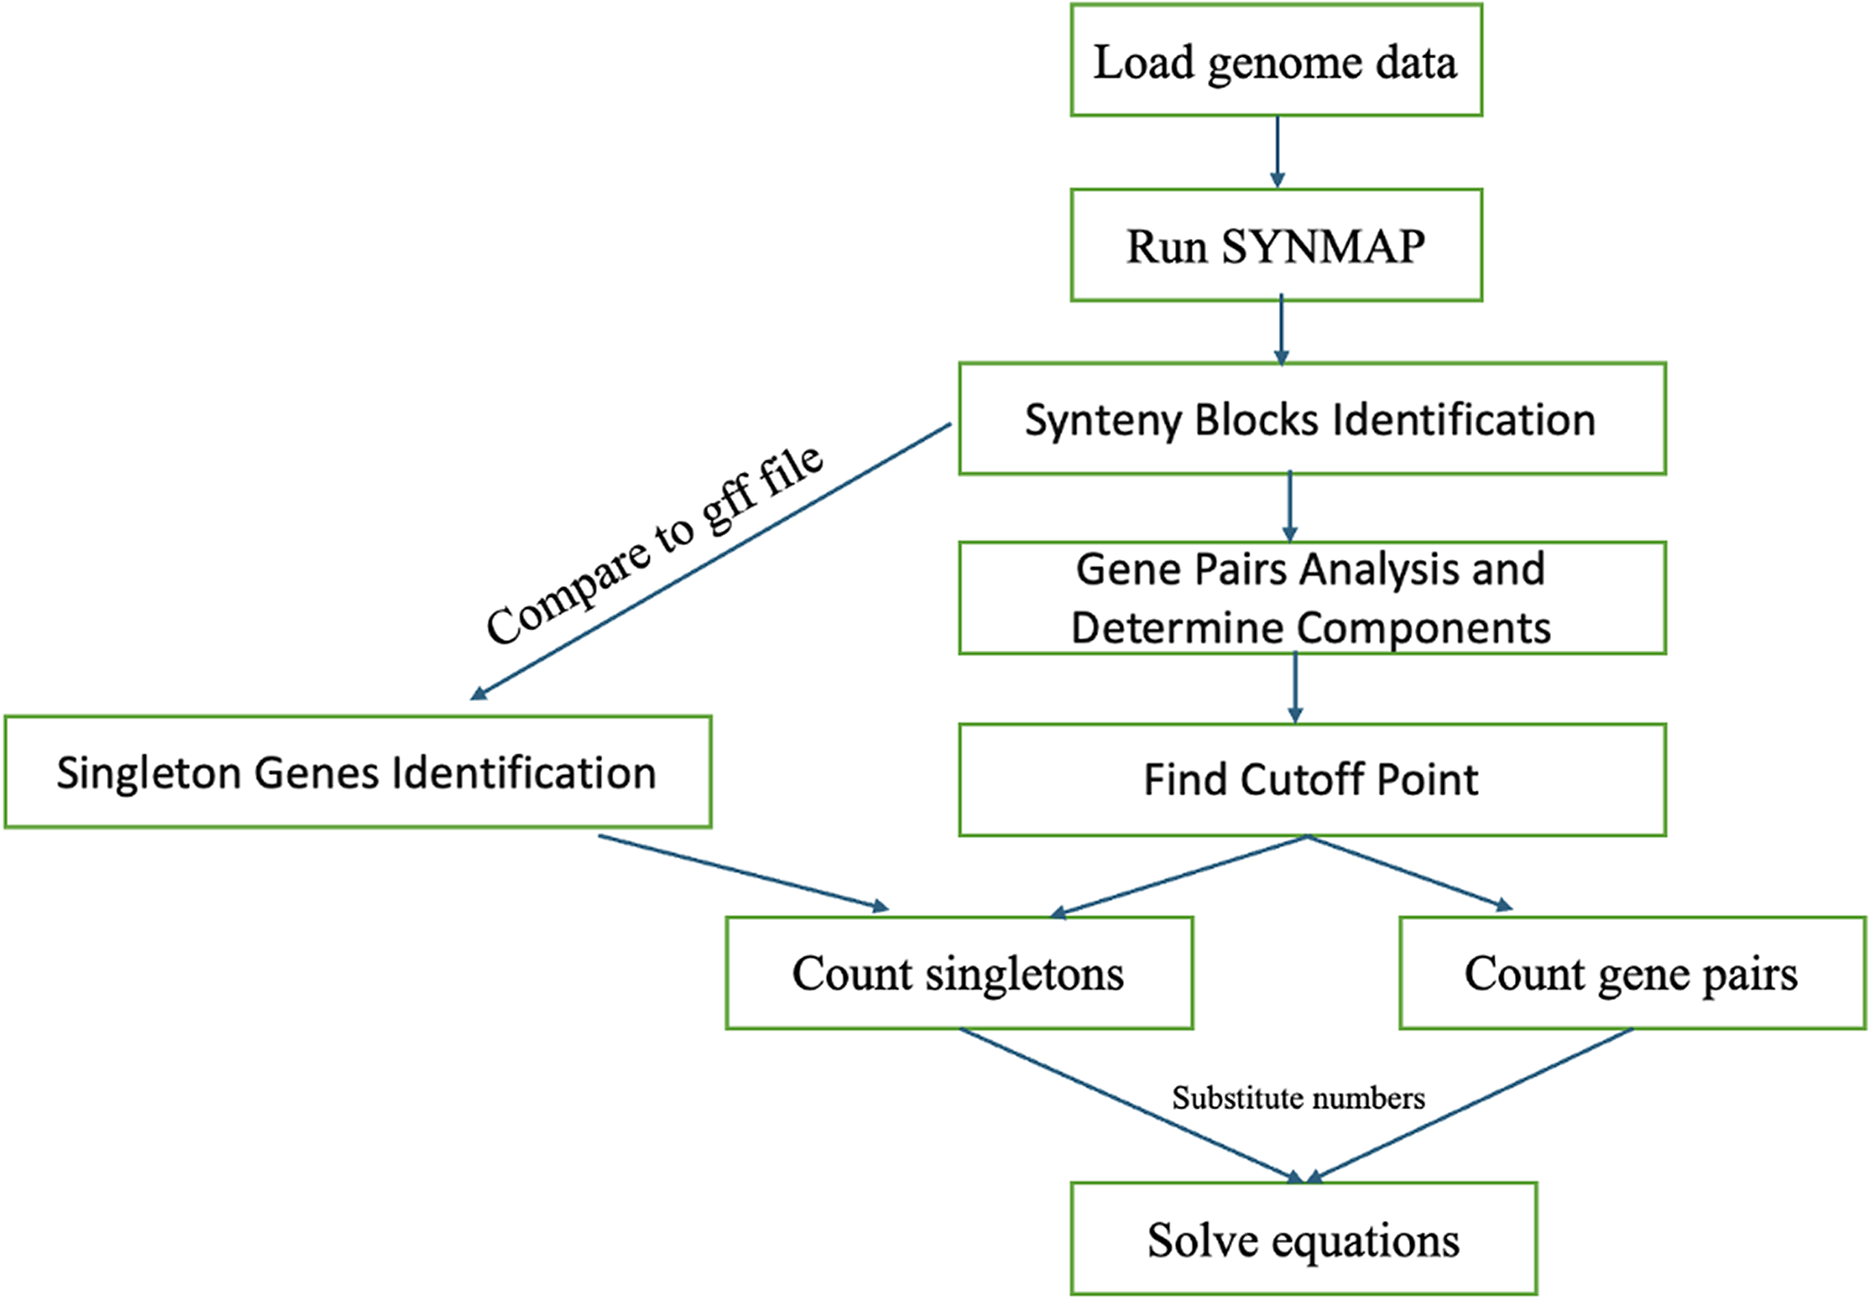
Workflow for counting
We analyzed genomic data from the National Center for Biotechnology Information (NCBI) (National Center for Biotechnology Information, 2023) and the Comparative Genomics (CoGe, n.d.) platform (coge), which provides web-based tools for synteny analysis and genome comparison. Synteny detection was conducted using DAGchainer and SynMap (Haas et al., 2004 ; Lyons et al., 2008; Haug-Baltzell et al., 2017), both integrated within CoGe, to identify sequence-similar gene pairs and collinear regions. DAGchainer was configured with a maximum allowed gap of 20 genes (−D = 20) and a minimum of three to five aligned pairs (−A = 3–5). To ensure data quality, only the highest percent-identity LASTZ hit per query gene was retained. The uniform similarity and collinearity within identified synteny blocks support the assumption of preserved pre-duplication gene order. In contrast, interspersed singletons likely correspond to fractionated pairs from the same evolutionary period.
The analysis included multiple salmonid species (Fig. 4). Publicly available genomes were used for Atlantic salmon [Salmo salar (Lien et al., 2016)] and lake trout [Salvelinus namaycush (Smith et al., 2022)], while privately downloaded NCBI assemblies were utilized for Chinook salmon [Oncorhynchus tshawytscha (Christensen et al., 2018)], rainbow trout [Oncorhynchus mykiss (Berthelot et al., 2014)], and chum salmon [Oncorhynchus keta (Lee and Kim, 2019)].
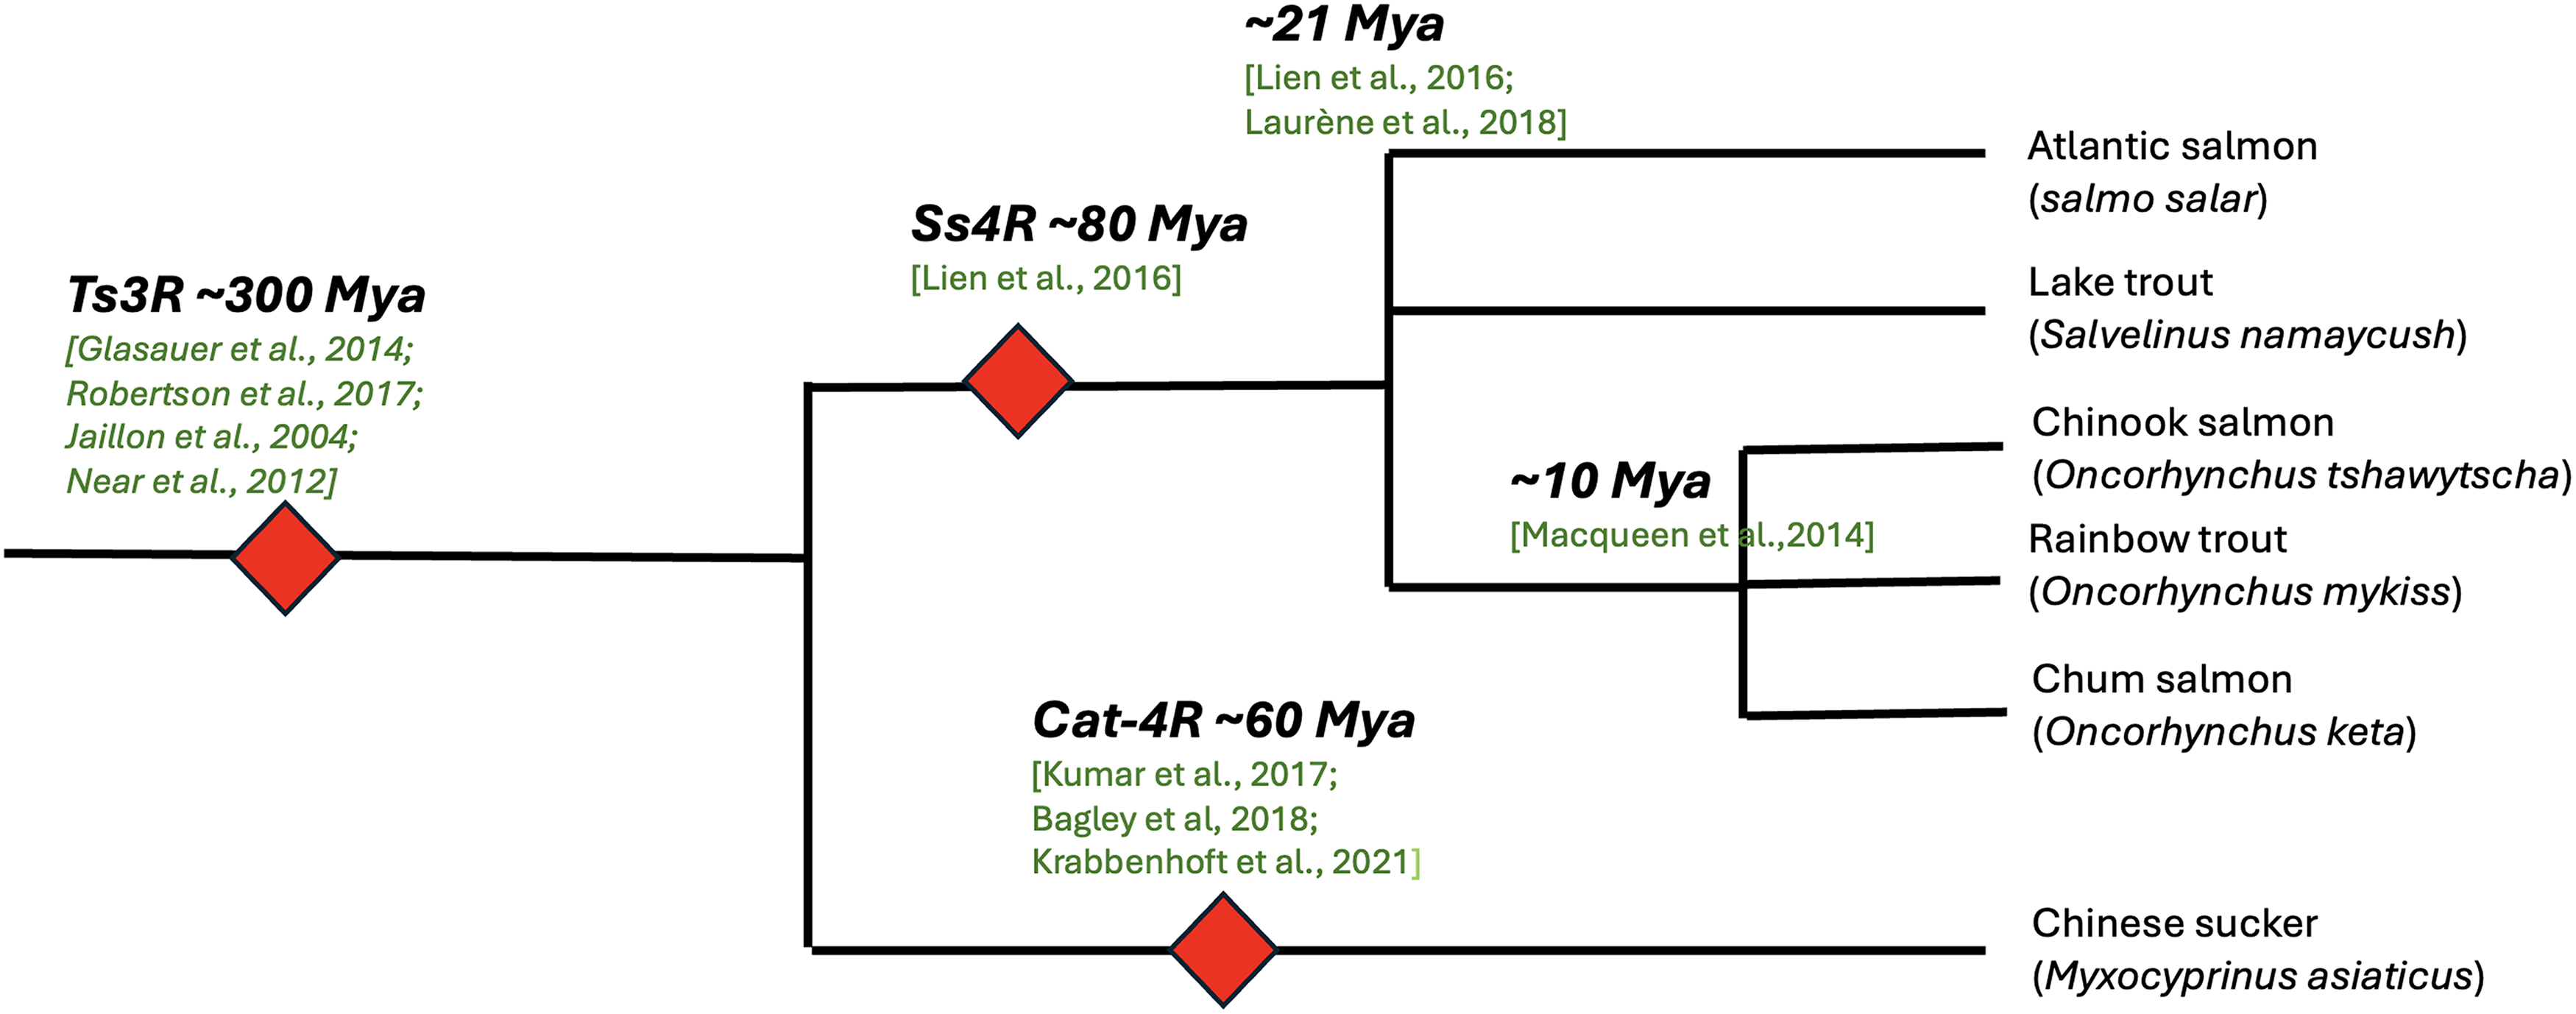
Phylogenetic relationships of selected Salmonidae species and the catostomid fish (Myxocyprinus asiaticus), showing major WGD events (red diamonds) and estimated divergence times. Ts3R occurred
Table 2 reports the total number of gene pairs in synteny blocks across species. Note that these totals may appear smaller than the sum of synteny block pairs shown in Tables 3–5. This discrepancy occurs because the same gene pair can belong to multiple candidate blocks prior to filtering. When applying mean similarity cutoffs at the block level, some blocks (and their pairs) are excluded, and duplicate gene pairs are removed, leading to a reduced final count.
Figure A1 in Appendix A1 illustrates the distribution of similarity scores for individual gene pairs and gene pairs within synteny blocks across the five salmonid species, providing insights into WGD events. The local peaks observed in both distributions reflect the synchronicity of gene duplications associated with WGD. Distinct local peaks in these distributions reflect the synchronicity of gene duplications tied to WGD, corresponding to evolutionary periods marked by significant genomic changes. Analyzing these patterns allows inference of both the timing and ploidy levels of WGD events.
Notably, the two local peaks in the similarity distributions of synteny blocks, around 75% and 90%, specify the differential conservation levels. This distribution pattern is similar to that of individual gene pairs, where two distinct peaks similarly reflect varying degrees of conservation or divergence but may not capture the broader evolutionary context as effectively as synteny blocks.
The presence of an ambiguous peak around 95% in the distribution of synteny blocks points to a subset of highly conserved genomic segments. This observation likely suggests segmental duplications in the conservation of these genomic regions or assembly errors.
We further validated the cutoff inference approach using synthetic data generated under a two-component Gaussian mixture model (parameters chosen based on empirical similarity peaks). The estimated cutoff closely matched the theoretical decision boundary, confirming the robustness of our likelihood-based method (Fig. A2 in Appendix A2).
RESULTS
Synteny block analysis across five Salmoninae genomes reveals distinct post-polyploidization patterns of gene retention and loss. As expected, reducing the block size threshold from 5 to 3 increases both singleton and gene pair counts due to the less stringent requirements for synteny block formation.
Despite variation in block size and species, similarity cutoffs remain stable, ranging from 0.831 to 0.859, indicating consistent criteria for defining synteny blocks based on sequence similarity and gene collinearity.
The crumble constant (c), representing the proportion of conserved syntenic regions, increases as block size decreases (Fig. 5). This pattern indicates that smaller blocks are the outcome of structural erosion—a phenomenon known as block crumble—reflecting accumulated gene loss, duplication, and rearrangement.
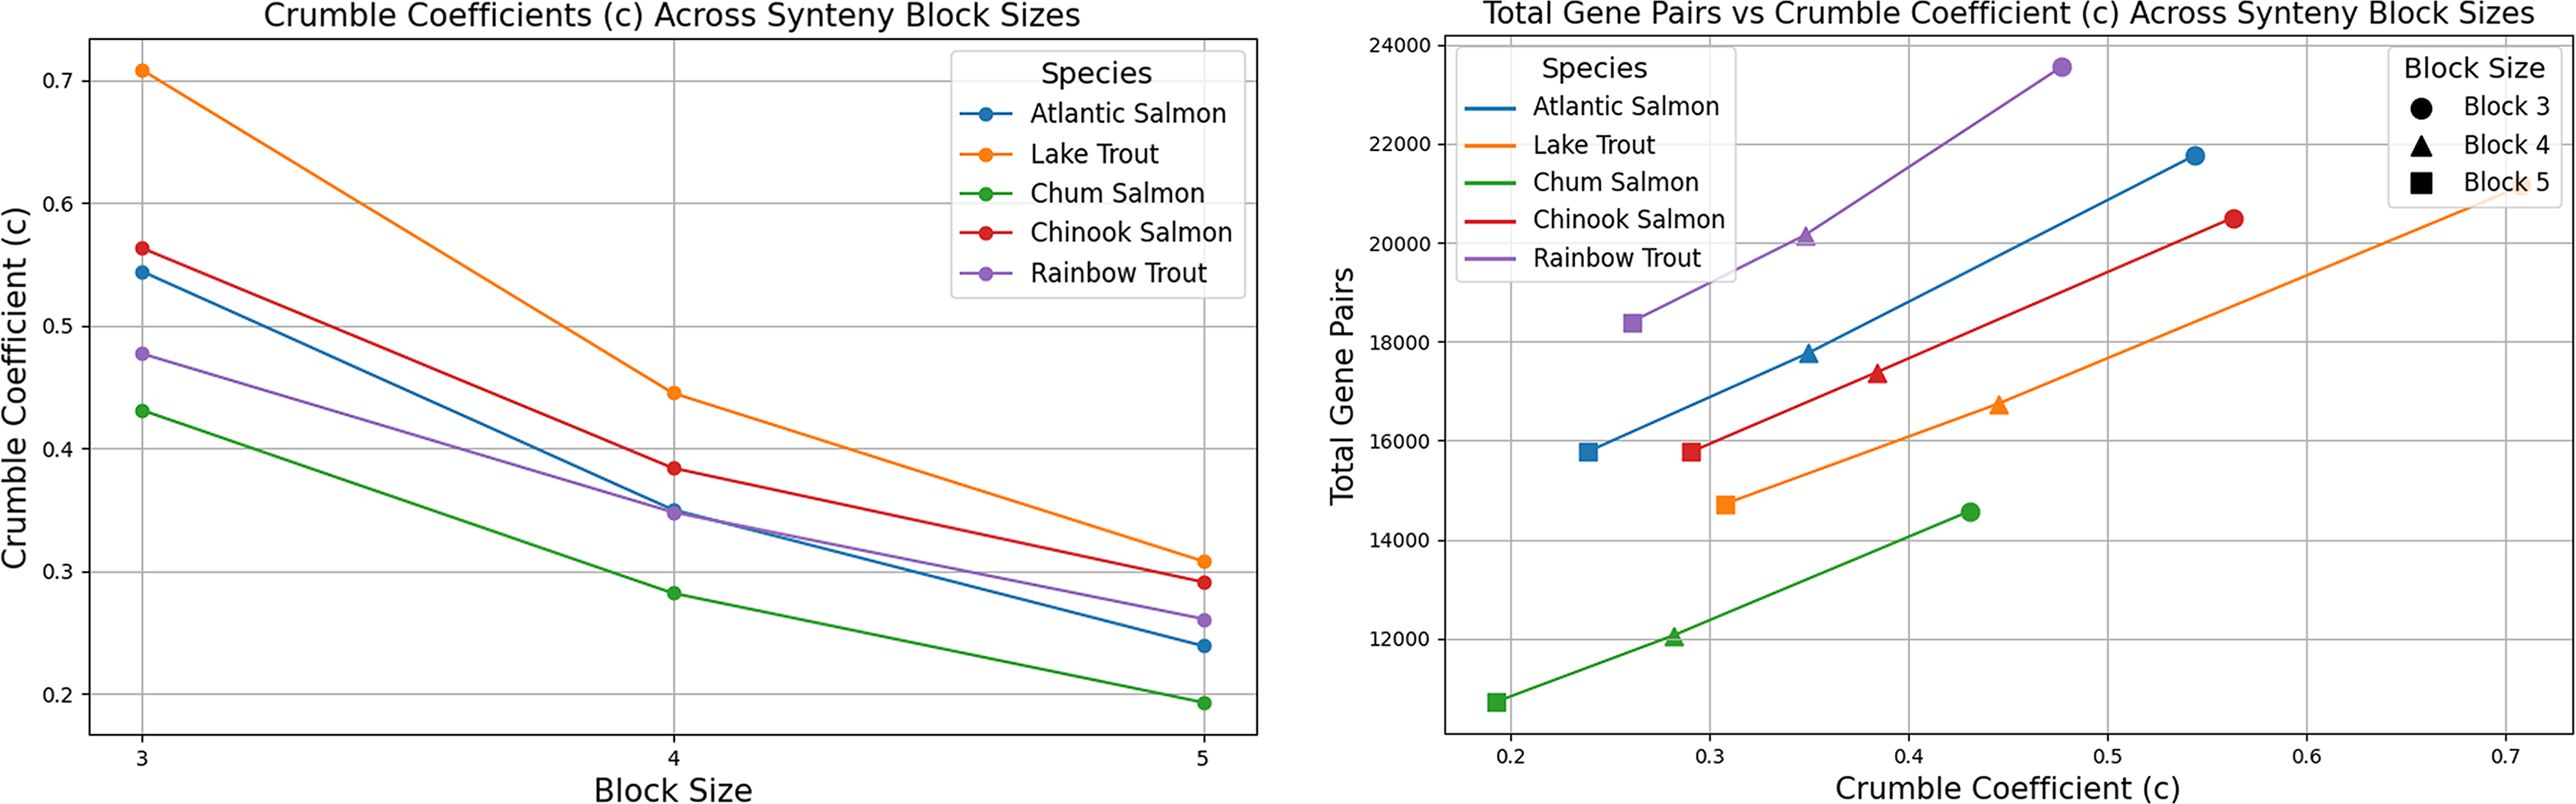
Left plot showing the crumble coefficients (c) for different Salmonidae species across synteny block sizes (
Comparative analysis with plant genomes [poplar, durian (Glasauer and Neuhauss, 2014)] shows that Salmoninae exhibit approximately half the c value observed in plants, indicating a higher rate of genomic rearrangement and fractionation in these fish. The plants appear more tolerant of polyploidization, retaining more duplicated genes.
The apparent increase in the initial gene complement (
Finally, survival probabilities u and v, which represent temporal dynamics of gene retention, provide further insight. Across all datasets,
We applied our branching-process-based framework to the five salmonid genomes to investigate post-duplication divergence patterns. Histogram-based analysis of retained duplicate gene pairs revealed a characteristic bimodal similarity distribution (Fig. A1 in the Appendix A1). The first mode, centered above
To quantify the evolutionary timescale underlying these patterns, we calibrated the similarity decay model:
Applying this transformation across all duplicate pairs yielded retention time distributions for each genome (Tables 3–5 and Fig. 6). This parameterization enabled the conversion of similarity scores into estimated divergence times.
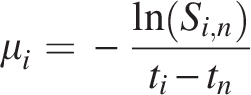
Fractionation rate parameters (
Interestingly, although the branching-process model does not impose equality between the fractionation parameters
The consistent retention rates observed across different WGD events suggest two possible interpretations. First, fractionation dynamics following polyploidization may follow a conserved mechanism across different WGD events, resulting in similar long-term retention probabilities. Alternatively, the similarity of
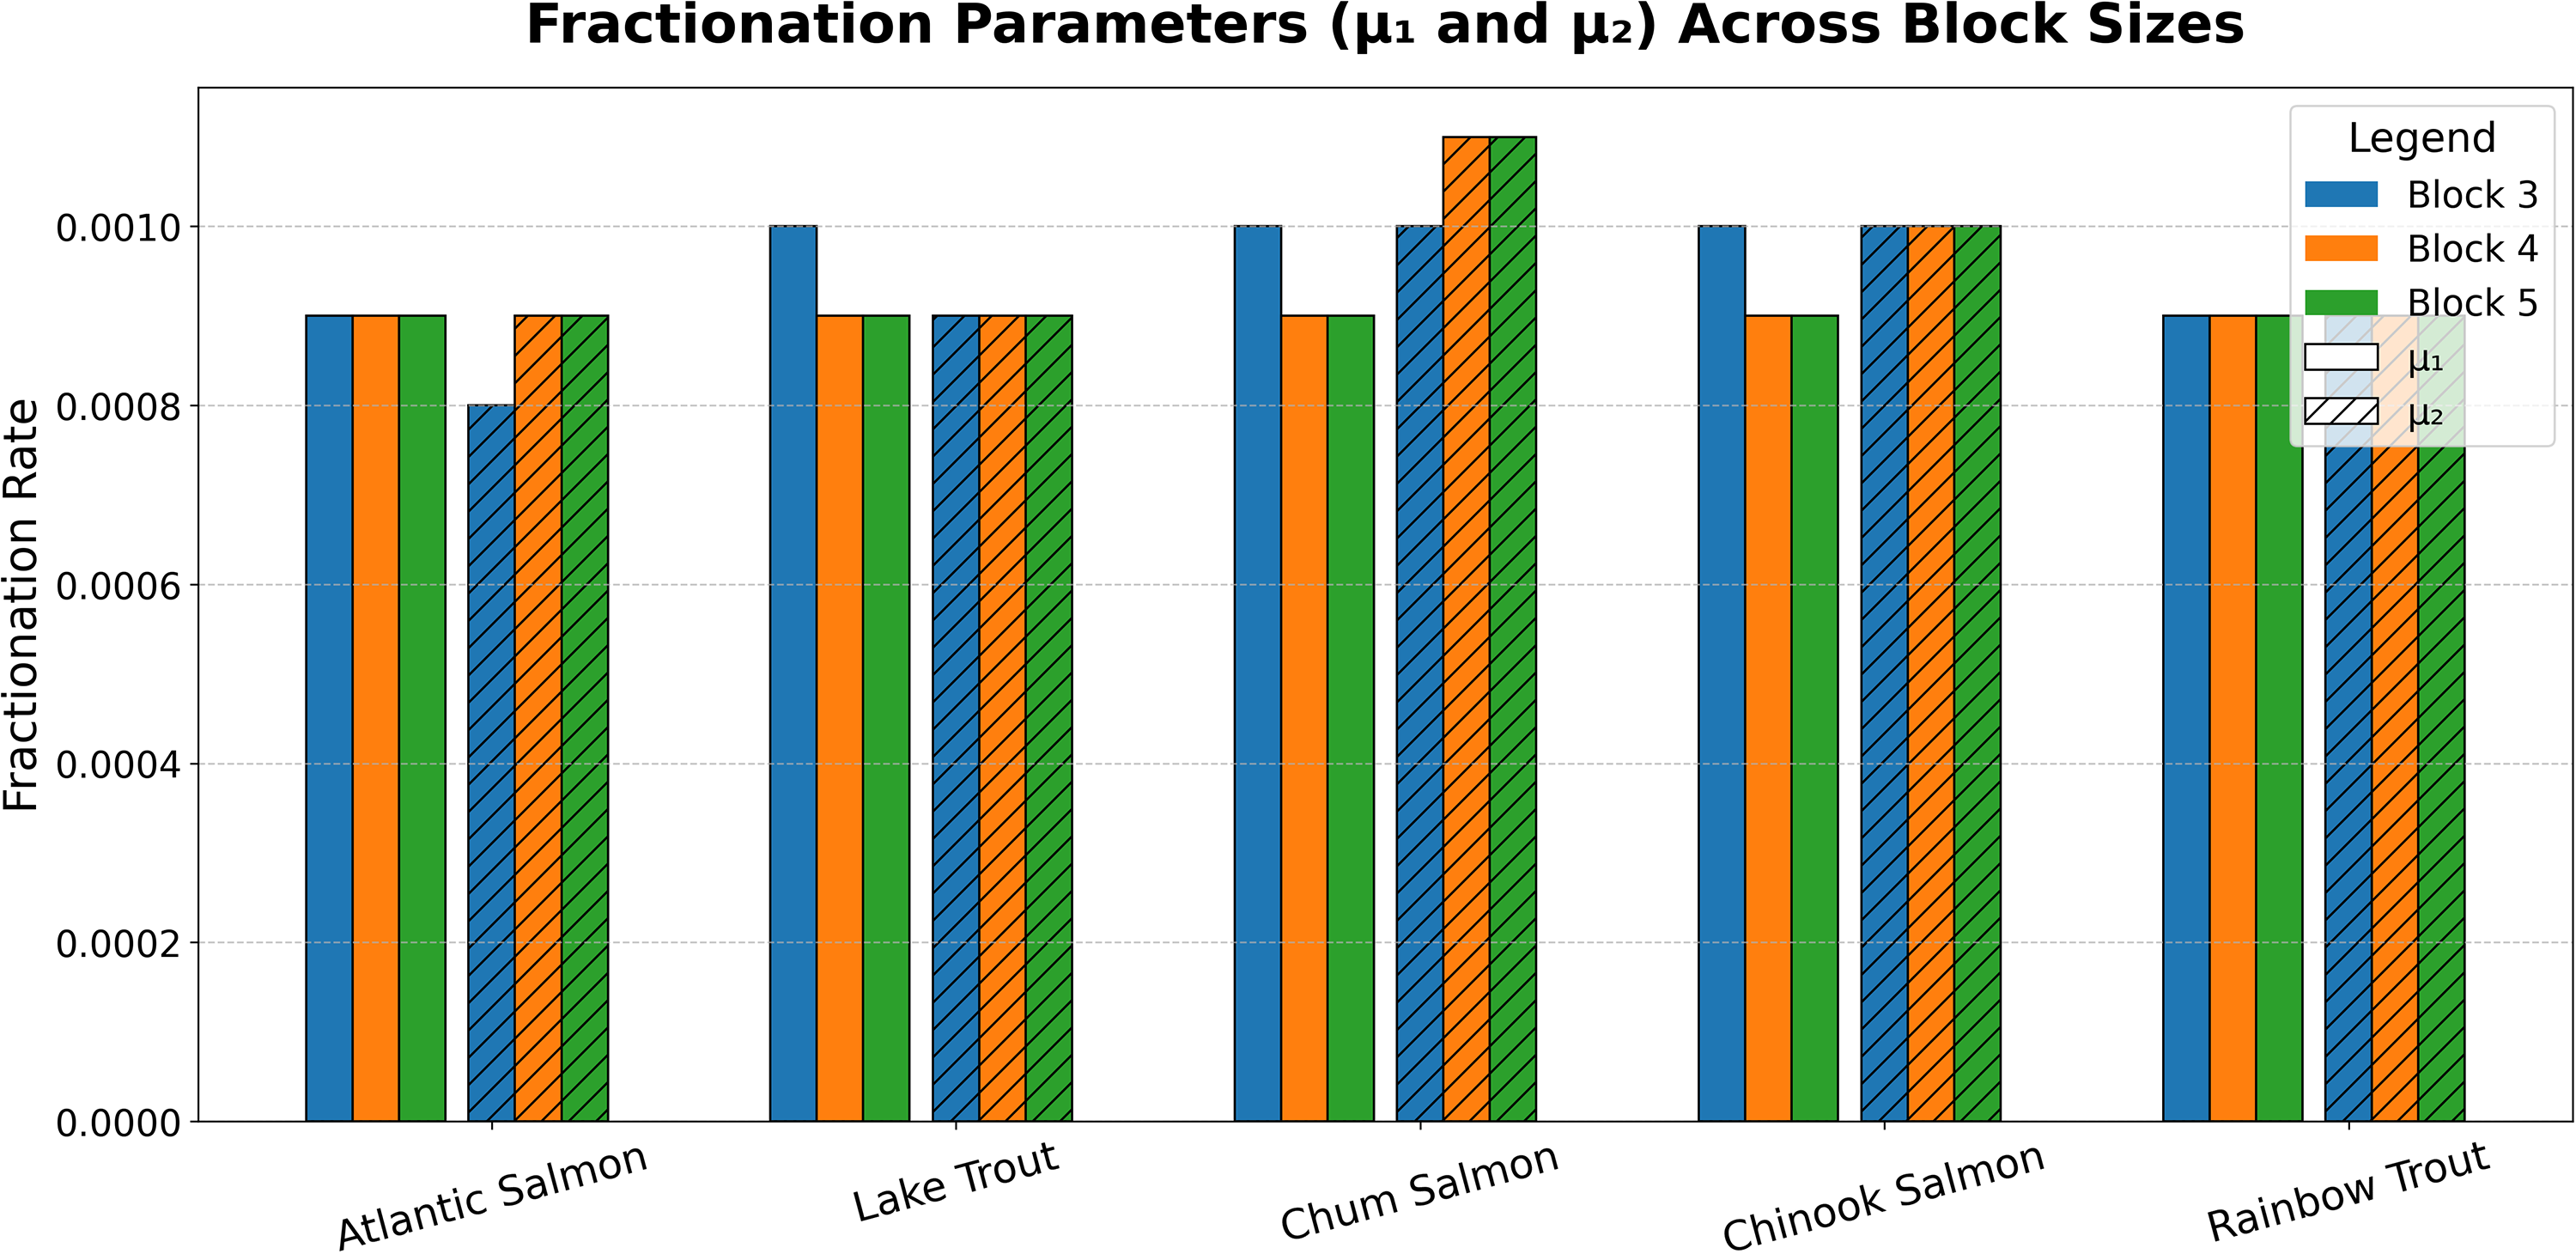
Our analyses indicate that post-WGD fractionation dynamics in salmonid genomes are characterized by relatively slow rediploidization, with well-resolved signals across multiple species. To place these patterns in a broader evolutionary context, we briefly examined the Chinese sucker (Myxocyprinus asiaticus, ID: 61661), a catostomid fish that experienced an independent, lineage-specific whole-genome duplication (Cat-4R).
In addition to Cat-4R, M. asiaticus retains detectable signals from the teleost-specific WGD (Ts3R), as reflected by two major similarity peaks (
Orange is recent duplications or WGD, often aligned near the diagonal. Green is moderately diverged duplicates, and red is the more ancient duplicates for block 3.
To improve resolution in this multi-WGD setting, we integrated
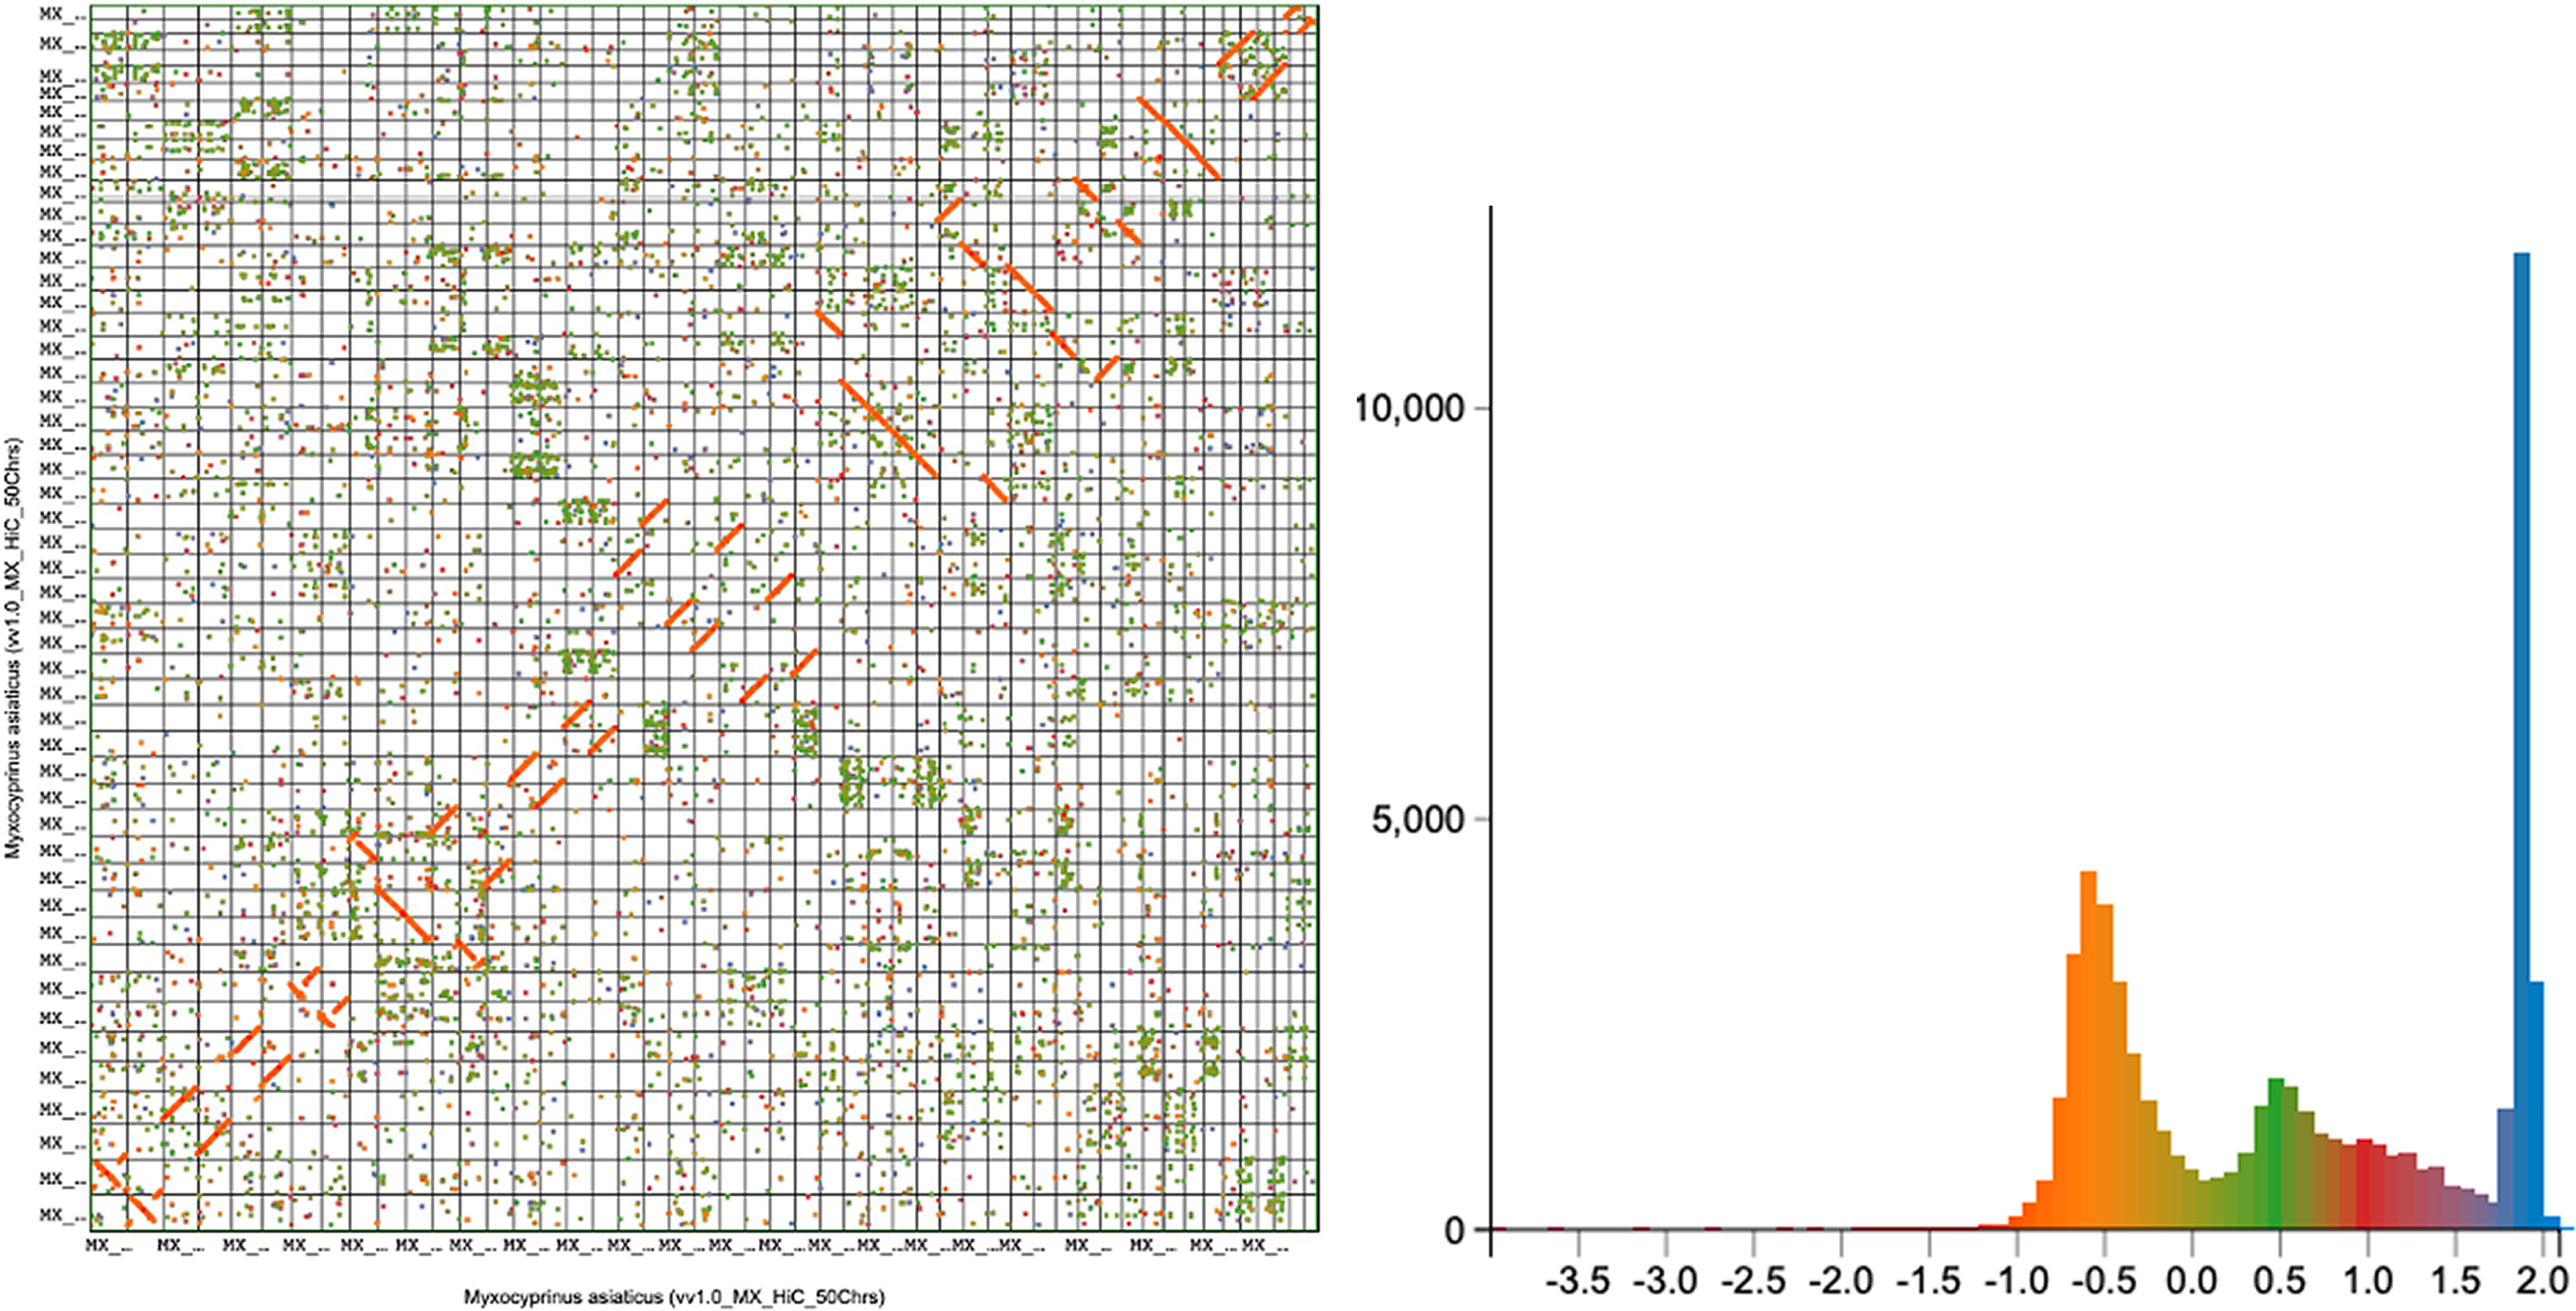
Left: GEvo visualization of a syntenic block between Chromosome 7 and Chromosome 8 in Myxocyprinus asiaticus. Red boxes represent annotated genes, and pink lines connect syntenic gene pairs between the two regions. Right: Histogram of block similarity in Myxocyprinus asiaticus, with bars colored according to the mean log(Ks) value of genes within each bin.
Taken together, these observations suggest that the post-duplication trajectory of M. asiaticus differs from the prolonged and well-resolved rediploidization observed in salmonids. However, the current data do not allow a quantitative comparison of fractionation timescales across lineages. A systematic analysis explicitly modeling M. asiaticus within the same branching-process framework and across alternative synteny detection methods will be required to assess lineage-specific differences in post-WGD dynamics.
Starting with the SYNMAP software on the CoGe platform, we assessed coding sequence similarities to evaluate fractionation rates and polyploidy events in salmonid genomes, utilizing a combination of algebraic and statistical methods. This approach emphasizes the role of singleton genes in the fractionation process, ensuring accurate identification and interpretation of retained and lost genes.
Our branching-process-based framework has applied to distinguish two major WGD signals, can be extended to accommodate three or more components by generalizing the retention model to a mixture structure (Sankoff et al., 2019; Zhang et al., 2019, 2018):
Future research also should aim to standardize synteny block identification methods, enabling more accurate cross-species comparisons. Expanding the study to include a wider range of species will help clarify the evolutionary consequences of polyploidization. Model refinement is also needed to incorporate processes such as gene conversion and subfunctionalization, which play critical roles in post-WGD genome evolution. Developing automated computational pipelines will further improve the efficiency of fractionation analysis, while functional characterization of fractionated genes will provide deeper insights into the mechanisms driving genome diversification.
AUTHORS’ CONTRIBUTIONS
Y.Z.: Conceptualization, methodology, implementation, and writing—original draft. D.S.: Conceptualization, methodology, and writing—review and editing. All authors read and approved the final article.
Footnotes
AUTHOR DISCLOSURE STATEMENT
The authors declare no conflicts of interest.
FUNDING INFORMATION
This study was supported by the Natural Sciences and Engineering Research Council of Canada (NSERC) under Grant (RGPIN-2024-06717 and RGPIN-5212-2022) and the Thompson Rivers University Open Access Fund (Grant No. 103883).
Appendix A1
APPENDIX A2: SIMULATION-BASED VALIDATION OF SIMILARITY THRESHOLDS
To validate the robustness of the overall branching-based framework introduced in our original model—including the modeling of synteny block disintegration, the use of similarity score distributions, and the inferred threshold separating duplicated gene classes—we conducted a simulation-based evaluation using synthetic data.
To emulate observed similarity distributions in real Salmonidae datasets, we defined a synthetic two-component Gaussian mixture model:
These parameters were selected based on empirical peaks observed in pairwise similarity histograms from salmon dataset, representing two modes of post-WGD divergence. We then applied our original inference pipeline, which combines a moment-based representation of similarity scores (see Section 2) with a log-likelihood maximization approach, to estimate the optimal cutoff H for distinguishing these components. The log-likelihood is computed as:
The cutoff H maximizing this likelihood was found to closely align with the theoretical decision boundary separating the two Gaussian modes (e.g.,