
Abstract
Cancer genes, including oncogenes and tumor suppressor genes, are crucial subjects of study in human health. With advancements in nonhuman primate genome research, recent investigations have started to explore the relationship between human cancer genes and various primate species, implying possible links between cancer genes and nonhuman primate species. However, these findings are commonly limited to only a few primate species. Here, we investigate the distribution of 726 human cancer genes across 31 nonhuman primate species and 4 nonprimate species, comparing them with a randomly selected set of 339 other human genes. Overall, a higher ratio of cancer genes was found to have emerged before primate speciation compared with random human genes; however, this trend did not necessarily continue after primate speciation. Furthermore, our investigation into primate clades suggests that the absence of certain cancer genes in a clade may reflect recent emergence in other clades in which they exist, rather than elimination within the clades in which they are absent.
INTRODUCTION
Cancer is a severe threat to human health, with genetic mutations being the major cause of cancer (Croce, 2008; Martínez-Jiménez et al., 2020), including mutations on oncogenes, tumor suppressor genes, and microRNAs (Croce, 2008; Zhang et al., 2007). Some mutations can be passed over generations (Dharwadkar et al., 2022; Ramus et al., 2015; Zhang et al., 2015). Pinpointing genes associated with human cancer has been essential to better comprehend the mechanisms behind cancer (Lineweaver et al., 2021; Long et al., 2003; Ma et al., 2022), to identify affected populations (André et al., 2020; Samadder et al., 2019), and to develop anticancer therapies (Cross and Burmester, 2006; Roma-Rodrigues et al., 2020; Tamborero et al., 2018).
Previous findings have indicated potential associations between cancer associated genetic changes and various primate species other than human (Koufaris, 2016; Wang et al., 2011). MicroRNAs, a class of small noncoding RNAs, have been suggested to be associated with human cancer, with their mutations participating in both cancer development and suppression (Croce, 2008; Hussen et al., 2021; Jansson and Lund, 2012). Previous work (Koufaris, 2016; Wang et al., 2011) conducted phylogenetic analysis on human microRNAs and found that approximately
Other studies compared cancer genes, including protein coding oncogenes and tumor suppressor genes, with various species but not specifically within the range of primate species. For instance, Vakirlis et al. (2020) reported two cancer genes, DEC1 and DIRC1, to be human de novo genes (human specific genes) by comparing them with 17 yeast species, 16 fly species, and 15 vertebrate species. This study did not focus on primates and only included two nonhuman primate species, Pan troglodytes and Gorilla gorilla. Mclysaght and Hurst (2016) reviewed seven primate-specific genes that are associated with cancer. The primate species compared in the original studies were mostly limited to chimpanzee and gorilla, with a few studies expanded to orangutan, gibbon, and macaque. Ma et al. (2022) found that certain primate specific genes are upregulated in 13 human cancer types. The analysis results in that study were compared with four nonhuman primate species: chimpanzee, gorilla, orangutan, and rhesus monkey.
With advancements in nonhuman primate genome research, recent investigations have started to explore the relationship between human genetic changes and a larger collection of primate species. Byrne et al. (2016) investigated 647 high-frequency human-specific missense changes and found 63% of them occur in at least one nonhuman primate species. They also reported an association between nonrecurrent ape-specific missense changes and human diseases. Gao et al. (2023) examined 4.3 million common missense variants in human genes and found that, compared with nonprimate species, the missense variants observed in primate species are more likely to be benign.
Several studies on cancer mechanisms have also hinted at a possible link between cancer genes and species evolution (Lineweaver et al., 2021; Long et al., 2003; Ma et al., 2022; McLysaght and Hurst, 2016). Molecular atavism is one hypothesis proposed to suggest a possible mechanism that causes cancer (Lineweaver et al., 2021). This hypothesis assumes that in humans, cancer cells revert to their previous forms in the unicellular ancestors of humans. Previous research has found possible evidence for this hypothesis, including that many human cancer-associated genes are estimated to have emerged in unicellular or early metazoan ancestors of human (Chen et al., 2015a; Cisneros et al., 2017; Trigos et al., 2019).
Antagonistic evolution (Long et al., 2003; Ma et al., 2022; McLysaght and Hurst, 2016) is another mechanism that has been proposed to understand both human cancer and de novo genes. For de novo genes, antagonistic evolution is proposed to explain why such genes have evolved when the existing genes were existing and functional, possibly reacting to a changing environment (McLysaght and Hurst, 2016). This mechanism suggests that the selection of genes is possibly the result of the co-evolution of the organism and the environment, leading to a rapid evolution of de novo genes from the original regions that can be coding sequences (CDSs) or noncoding sequences (McLysaght and Hurst, 2016). On the other hand, antagonistic pleiotropy, a mechanism proposed to explain aging and diseases that occur in later life (Long et al., 2003), has been used to provide a possible explanation for some human cancers (Ma et al., 2022). An assumption linked with this mechanism suggests that newly emerged genes tend to contribute to cancer developments (Ma et al., 2022). A possible reason for this connection is that the de novo genes were usually more adaptive in evolution, if they can benefit the species in early life but cause diseases such as cancer in later life (Chen et al., 2018). Although it varies from type to type, cancer is overall a disease that increases in risk along with age and tends to be a late life threat (Berger et al., 2006). In the context of antagonistic pleiotropy, cancer and other late life diseases are considered to be side effects of the evolution of adaptive de novo genes.
Newly emerged genes can emerge through multiple mechanisms. In mammals, mechanisms investigated include gene duplication, lateral gene transfer, gene fusion, and the emergence of genes from noncoding regions (Dougherty et al., 2017; Riley et al., 2013; Soucy et al., 2015; Tautz and Domazet-Lošo, 2011; Vakirlis et al., 2020). De novo gene emergence is a subset category within gene emergence, with its definition evolving along with the literature. Early studies focused on gene duplication and considered it as the primary source of de novo genes (Dougherty et al., 2017; Tautz and Domazet-Lošo, 2011), although there are cases of gene emergence that cannot be explained by this mechanism and are unlikely to be overlooked because duplications are difficult to detect (Vakirlis et al., 2020). Later, with increasing research and evidence supporting de novo gene emergence from noncoding regions (Knowles and McLysaght, 2009; Suenaga et al., 2014; Xie et al., 2012), the term “de novo gene” is more often defined specifically to denote genes emerging from noncoding regions. In this study, we follow the latter definition and focus on de novo gene emergence within the broader context of gene emergence. Throughout this article, we use the term “gene emergence” to refer primarily to de novo gene emergence.
Overall, research into the relationship between cancer genes and nonhuman species, alongside other genetic studies in various species, is continuously evolving. Drawing from previous research, we suggest that the genomes of diverse nonhuman species can be used to expand our understanding of the evolutionary dynamics of cancer genes, which is the focus of this study.
In this study, we develop insights into the distribution of human cancer genes across a broader range of nonhuman primate species than previously studied, while emphasizing their evolution. In total, we investigate the distribution of 726 human cancer genes among 32 primate species (including human) and 4 nonprimate species, along with a randomly selected set of 339 human genes for comparison purposes.
To investigate the specific problem of the distribution and emergence trend of cancer genes in different primate species, we used a similar but different approach to the phylostratigraphy method outlined by Domazet-Lošo et al. (2007). The original method cannot be directly applied to this study as it requires a single species from each time period, which does not suit this investigation due to the natural distribution of primate divergence times. In our methods, when estimating the emergence of a gene, we always consider a clade, a group of species sharing a common ancestor, rather than a single species. In recognizing the potential bias associated with inferring gene emergence based on species divergence and the use of the BLAST tool, we consistently compare two or more gene sets. This comparison allows us to form relativistic rather than absolute conclusions and mitigate bias. In summary, we examined the presence or absence of genes across various primate species using the BLAST tool and based our conclusions on the gene distribution across gene sets and species.
This study aims and contributes to enhance our understanding of the emergence and conservation in primate species of human cancer genes, and hopefully, further shed light on the evolutionary dynamics of cancer genes. The results reported in this study have been achieved by investigating gene distribution across a wide range of species and clades and examining gene emergence trends after primate speciation.
METHODS AND MATERIALS
There are three types of data used in this work: (1) CDS data of 32 primate species and 4 nonprimate species (Cunningham et al., 2022; Sayers et al., 2022), (2) divergence times of 32 primate species (including human) and 4 nonprimate species (Kumar et al., 2022), and (3) 733 cancer genes obtained from the Cancer Gene Census v96 (Sondka et al., 2018) and 339 randomly selected human genes. Data and scripts used in this study are available in the repository described in the Section Availability of data and materials.
To detect human cancer and randomly selected human genes in primate species, protein sequences of these genes were aligned with the CDSs of primate species. After applying identity and coverage thresholds to the BLAST results, each gene was assigned to be present or absent in each primate species. Additionally, primate species were divided into groups of large clades and groups of small clades as illustrated in Figure 1. A gene missing from all the species from one clade was identified to be missing from the entire clade.
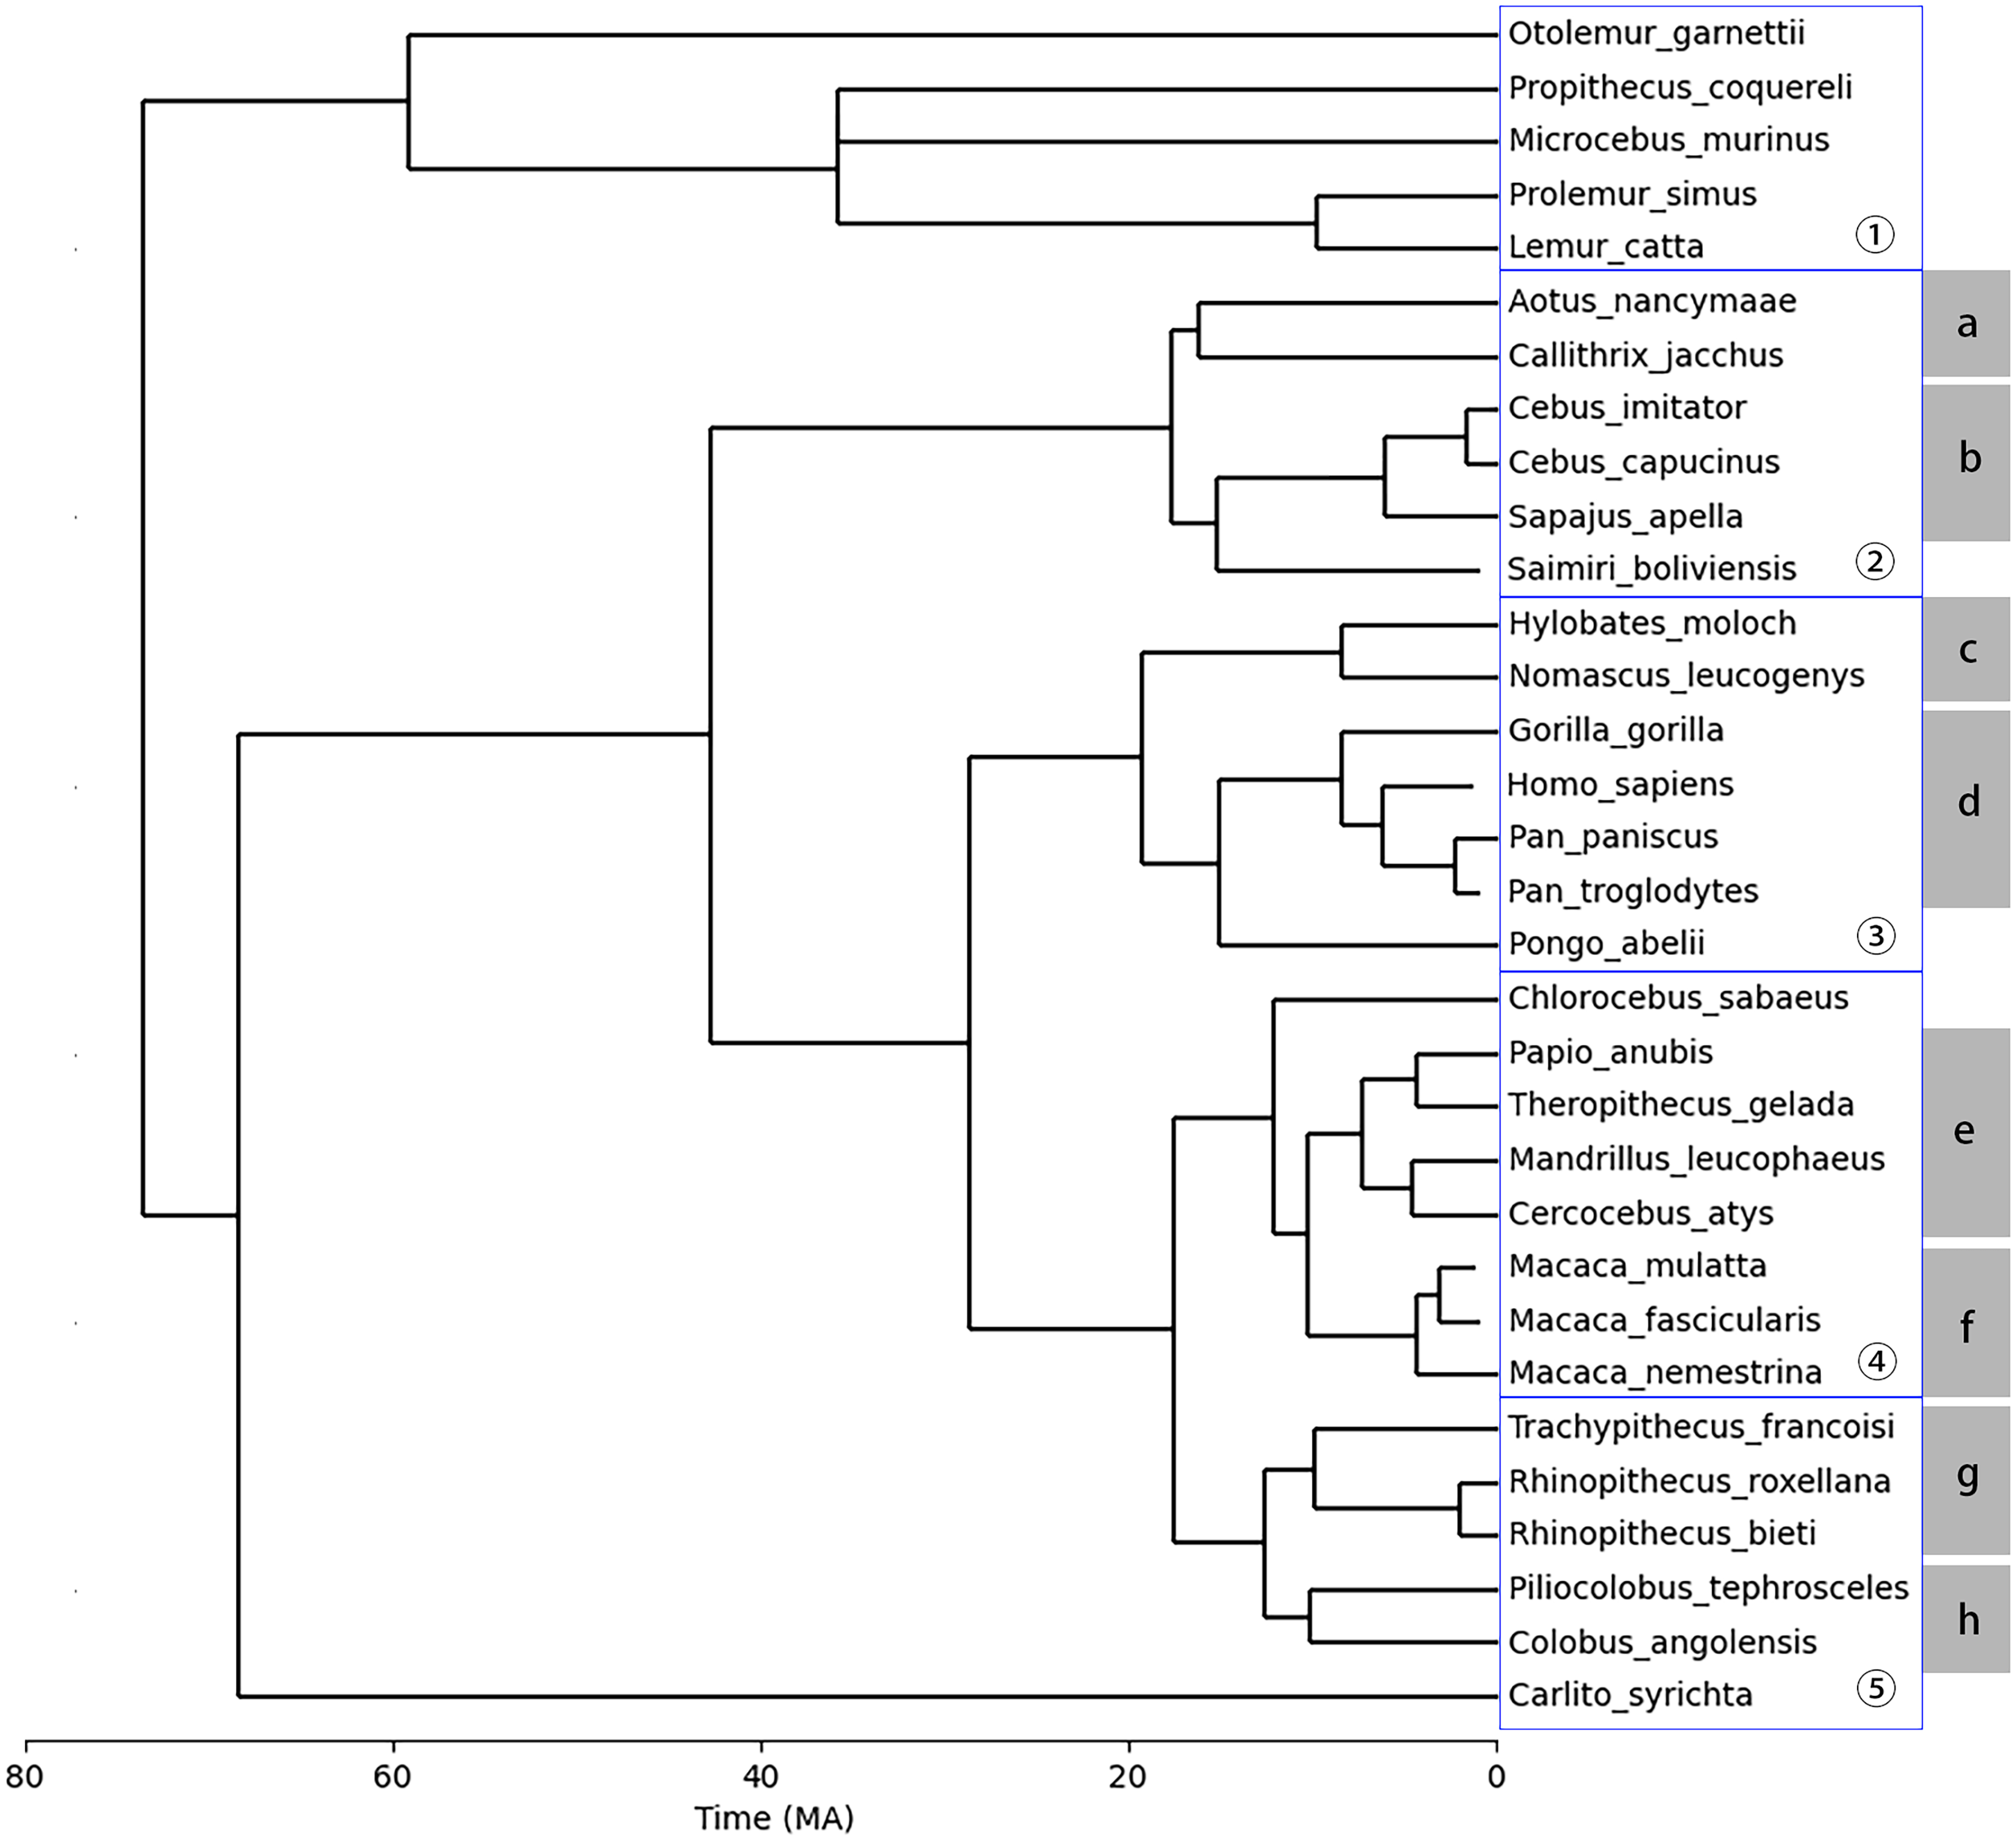
The timetree of the 32 primate species used in this study. The blue boxes display the partition of the six large clades, while the ranges of gray solid rectangles mark the eight small clades as described in Section 2.4. The divergence times of the species were obtained from the TimeTree database (Kumar et al., 2022). Numeric labels represent large clades, while alphabetic labels represent small clades. Human (Homo Sapiens) is not included in any clade during further analysis processes but is included in the tree to show the distances from other species to human.
In this study, genomes and CDSs of 32 primate species (including human, Homo sapiens), as well as 4 nonprimate species, were downloaded from Ensembl and NCBI databases (Cunningham et al., 2022; Sayers et al., 2022). The genome accession numbers are available as described in Section Availability of data and materials.
Among the four nonprimate species, the mouse, dog, and zebrafish are well-studied model species that have been investigated along with primate species in previous studies (Gao et al., 2023). Anteater, a less-studied species, has been included as an endemic species to the New World to expand on the variety of the nonprimate species in this study. Note that the anteater genome is less well-annotated than the other three species and the results reported for anteaters are rather additional than critical.
Estimating divergence times of primate species
A timetree of the 32 primate species is illustrated in Figure 1. The divergence times of the species were obtained from the TimeTree database (Kumar et al., 2022), except for Cebus imitator. The divergence time of Cebus imitator was not found in the TimeTree database (Kumar et al., 2022) and was separately obtained from Boubli et al. (2012). The divergence times obtained from the TimeTree database (Kumar et al., 2022) has a confidence interval of 95%, indicating that approximately 95% of reported times in the synthesized studies lie within two standard deviations of the mean time, assuming a normal distribution.
This tree has been compared with a fossil calibrated tree of 233 primate species from Kuderna et al. (2023) for correction. Within the 233 primate species, 23 out of the 32 primate species in this study were identified. For the 23 primate species identified and corrected, the overall structure (branches and leaves) of the tree remains the same, although the divergence time points can be slightly different. In this study, the order of the divergence times and the overall structure of the tree have more importance than the exact divergence times, as later shown in Section 3. Therefore, the current tree as illustrated in Figure 1 was considered sufficient for this study.
It is notable that the taxonomic classification of genera Aotus, Callithrix, Cebus, and Saimiri has been a topic of debate (Di Fiore et al., 2023; Opazo et al., 2006; Schneider and Sampaio, 2015). While the NCBI Taxonomy Database (Schoch et al., 2020) classifies genus Aotus under family Aotidae, Opazo et al. (2006) reported that this phylogenetic relationship is weaker than other branches. More recent work has shown evidence for classifying Aotus under subfamily Cebinae or supported the sister relationship between Aotus and Callithrix (Di Fiore et al., 2023; Opazo et al., 2006). Therefore, in this article, we adopt the sister relationship between Aotus and Callithrix, as shown in the TimeTree database (Kumar et al., 2022) and Kuderna et al. (2023).
Based on the information obtained from current genomes and CDSs, one method for estimating the emergence of a gene is to detect its presence across species that diverged at distinct time points (Domazet-Lošo et al., 2007). In this study, we particularly investigate the emergence of human genes in primates, inferred by their presence in primate and nonprimate species. Specifically, if a gene is found in all nonhuman primate species examined, the gene is considered to have originated before the primate speciation. If a gene is found in at least one primate species, but not in any of the nonprimate species examined, the gene is considered to be primate-specific. Moreover, if the gene is found only in a nonempty proper subset of the primate species examined, then the gene is primate-specific, or in other words, the gene emerged within primates. To mitigate the potential bias introduced by the quality of a single species’ genome, we consistently compare the presence of genes across different gene sets within at least one clade, rather than relying on data from a single species.
Detecting cancer genes in primate and nonprimate CDS
There are three sets of human genes investigated in this article: (1) 733 human cancer genes obtained from Cancer Gene Census v96 (Sondka et al., 2018), (2) 100 randomly selected human genes using the
Out of the 733 human cancer genes processed, 726 genes have at least one reviewed protein identified. For the 100 randomly selected human genes, all of the genes have at least one reviewed protein identified. For the 240 randomly selected human genes from our previous study, there is one gene FAM47E-STBD1 not mapping to any reviewed protein in UniProt (Liang and Heath, 2023). In (Liang and Heath, 2023), the set of 239 randomly selected human genes with mapped proteins was a union of a set of 60 genes and a set of 179 genes. The genes without a mapped protein identified were not processed in later steps in this study.
In the remainder of the paper, we will denote by C the set of 726 human cancer genes, by
A small proportion of genes are mapped to multiple reviewed proteins. In these cases, we only considered the first protein sequence listed in the UniProt (UniProt Consortium, 2023) ID mapping table, reducing the number of mapped proteins from 760 to 726 for human cancer genes (4.5% reduced), 245 to 239 for random selected human genes (2.5% reduced). Full lists of reviewed proteins before deduplication can be found in the repository described in Section Availability of data and materials. The full list of human genes to randomly select from is extracted from the human CDS (Genome Reference Consortium Human Build 38) on Ensembl (Cunningham et al., 2022).
BLAST (Altschul et al., 1990), in particular, the TBLASTN method that searches proteins against nucleotides, was used to detect similar CDSs in the 31 nonhuman primate species and 4 nonprimate species. Nucleotide references were built locally from the CDS data of 32 primate species. The cancer genes and randomly selected human genes were then searched against the references with default parameters. Results were postfiltered with thresholds of 80% identity and 80% query coverage per subject. Here, the identity in BLAST results is defined as the percentage of identical base pairs between the sequences being compared. The query coverage per subject is defined as the length of each subject sequence in relation to the reference sequence.
Despite that BLAST, including TBLASTN, continued to be a widely used tool in recent de novo gene studies (Heames et al., 2020; Peng and Zhao, 2024; Takeda et al., 2023), there have been several debates suggesting that BLAST does not account for some of the complexities in gene evolution, potentially leading to biased estimates of gene ages toward newer origins (Domazet-Lošo et al., 2017; Moyers and Zhang, 2018). The main reason is that earlier sequences with insufficient similarity become difficult to detect, leading to false negatives in sequence existence. In addition, the quality of each genome can also affect the detection rate of genes, which may lead to false negatives. Genome statistics and other information can be accessed through the genome accession numbers provided in the repository described in Section Availability of data and materials.
To reduce the effect of potential bias, in this study, we always infer relativistic rather than absolute results by comparing two or more gene sets. For species more distantly related to humans, we have, in addition, applied a more relaxed threshold of 60% identity and 60% query coverage per subject for BLAST results, considering their greater genomic divergence. Supplementary Data contain tables generated with this threshold, applied to all nonprimate species or specifically to zebrafish. Notably, the results obtained with this threshold align with the conclusions reported in Section 3.
Detecting absent cancer genes in primate clades
The 32 primate species were first split into a list of large clades with sizes between five to eight, then into a list of small clades with sizes between two to four, as shown in Figure 1. In this study, a clade is defined to be a group of species that share a common ancestor, as the same in the standard definition. For each large or small clade, each gene was assigned to one of three statuses: (1) existent, (2) absent, and (3) unknown. A gene was only assigned to exist in one clade if this gene was detected in all the species in that clade. A gene was marked absent from one species clade if this gene was detected in none of the species in that clade. If neither of the above, there was insufficient information to assign a status other than unknown. The thresholds of identity and query coverage on BLAST results were applied before assigning the genes to clades.
Ka/Ks analysis
We have further performed a preliminary Ka/Ks analysis (Nei and Gojobori, 1986) on certain human cancer genes to estimate their evolutionary constraint. The analysis is performed through

Ka/Ks ratios that are significantly above 1 suggest positive selection with relaxed constraints on sequence changes, while ratios below 1 suggest negative selection with strong constraints favoring sequence conservation.
Note that the Ka/Ks analysis was performed on the single BLAST hit per gene per species retained in the previous described method (Section 2.3). When we retained a BLAST hit using the previous described methods, because we only considered the existence of similar sequences, the retained hit was not necessarily the most suitable sequence for Ka/Ks but any sequence that passed the filtering thresholds. This may have affected the Ka/Ks analysis results. Therefore, the associated findings should be regarded as preliminary and exploratory, with further conclusions requiring deeper investigation.
RESULTS
The results of this study are presented in three parts. Sections 3.1 and 3.2 together illustrate that the examination of cancer genes, whether prevalent in primate species (i.e., genes speculated to have emerged before primate speciation) or present specifically in primates (i.e., genes speculated to have emerged after primate speciation), both suggest that, compared with random human genes, cancer genes have a higher proportion of emerge before primate speciation.
Additionally, Section 3.3 investigates genes absent from certain primate clades, assessing whether their absence is more likely due to gene loss within those clades or to their emergence in other species.
Cancer genes prevalent in primate species
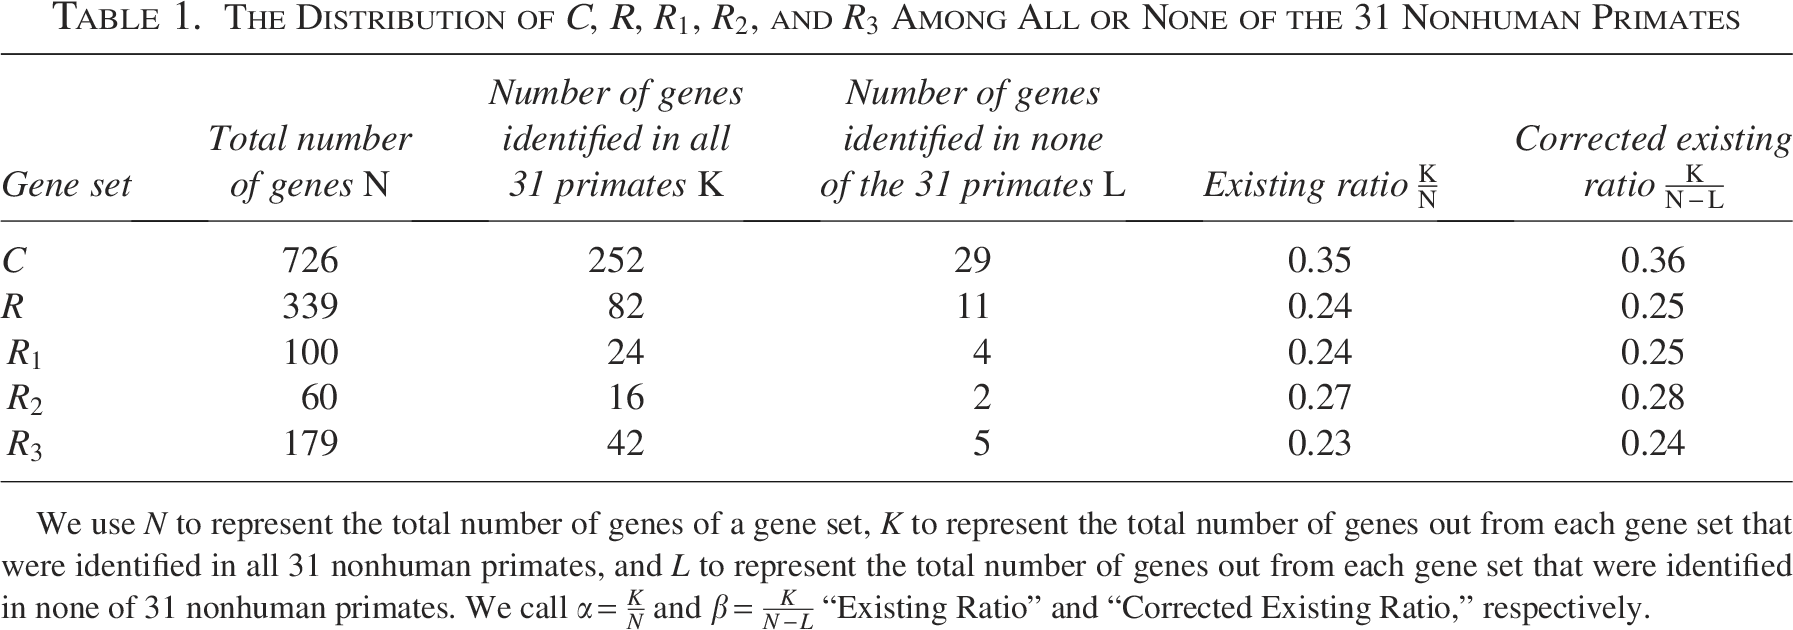
In this section, we present the results for those cancer genes that are prevalent in the primate species, i.e., cancer genes that are found in all 31 nonhuman primate species. Table 1 shows the numbers for both cancer genes and random human genes. Out of 726 genes in C, 252 genes were identified in all 31 nonhuman primate species. For the entire set of 339 random human genes, 82 genes are prevalent in primate species. The list of nonhuman primate species investigated in this result is described in Section 2.
The Distribution of C, R,
,
, and
Among All or None of the 31 Nonhuman Primates
The Distribution of C, R,
We use N to represent the total number of genes of a gene set, K to represent the total number of genes out from each gene set that were identified in all 31 nonhuman primates, and L to represent the total number of genes out from each gene set that were identified in none of 31 nonhuman primates. We call
It is notable that the genes detected in none of the species may not be actually absent from them, but rather undetectable using the methods and the genome sequences available in this investigation. To correct for possible effects introduced by these genes, an adjusted ratio is provided as an additional column in Table 1, where the number of absent genes is deducted from the numerators.
We use N to stand for the total number of genes of a gene set, K to stand for the total number of genes out from each gene set that were identified in all 31 nonhuman primates, and L to represent the total number of genes out from each gene set that were identified in none of 31 nonhuman primates. Then the “existing ratio” and “corrected existing ratio” are defined as
Furthermore, Table 2 shows the results of a Fisher’s exact test based on Table 1.
Contingency Table of Fisher’s Exact Test Results Based on Table 1
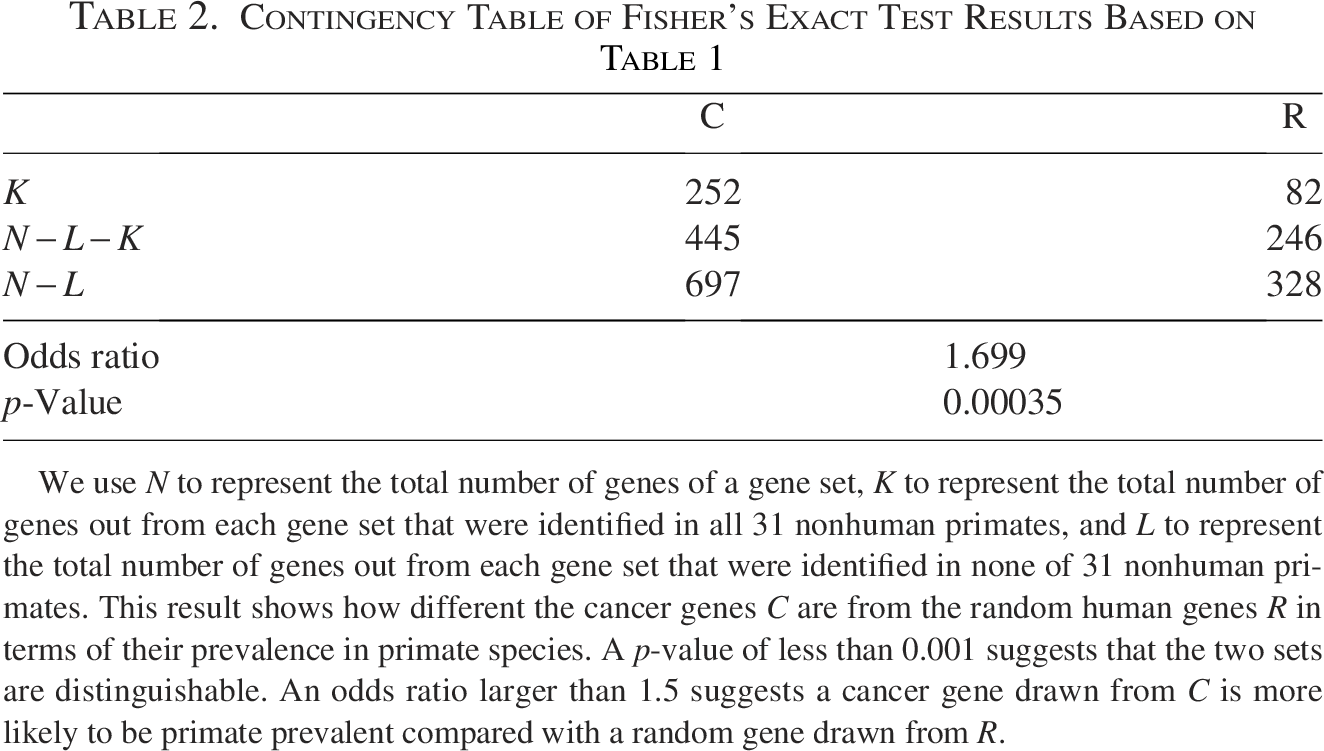
We use N to represent the total number of genes of a gene set, K to represent the total number of genes out from each gene set that were identified in all 31 nonhuman primates, and L to represent the total number of genes out from each gene set that were identified in none of 31 nonhuman primates. This result shows how different the cancer genes C are from the random human genes R in terms of their prevalence in primate species. A p-value of less than 0.001 suggests that the two sets are distinguishable. An odds ratio larger than 1.5 suggests a cancer gene drawn from C is more likely to be primate prevalent compared with a random gene drawn from R.
As shown in Tables 1 and 2, while the total random gene set has an existing ratio of approximately 0.25 in the 31 nonhuman primate species, the human cancer gene set has an existing ratio of approximately 0.36. Combined with Fisher’s exact test result, which shows a p-value below 0.001, these findings suggest that human cancer genes are more prevalent in primate species compared with random sets of human genes. Compared with a random human gene, a human cancer gene is more likely to have an older evolutionary origin predating the speciation of primates.
Additionally, the three random gene sets of different sizes suggest that the result is not affected by the size of random gene sets. The different random gene sets
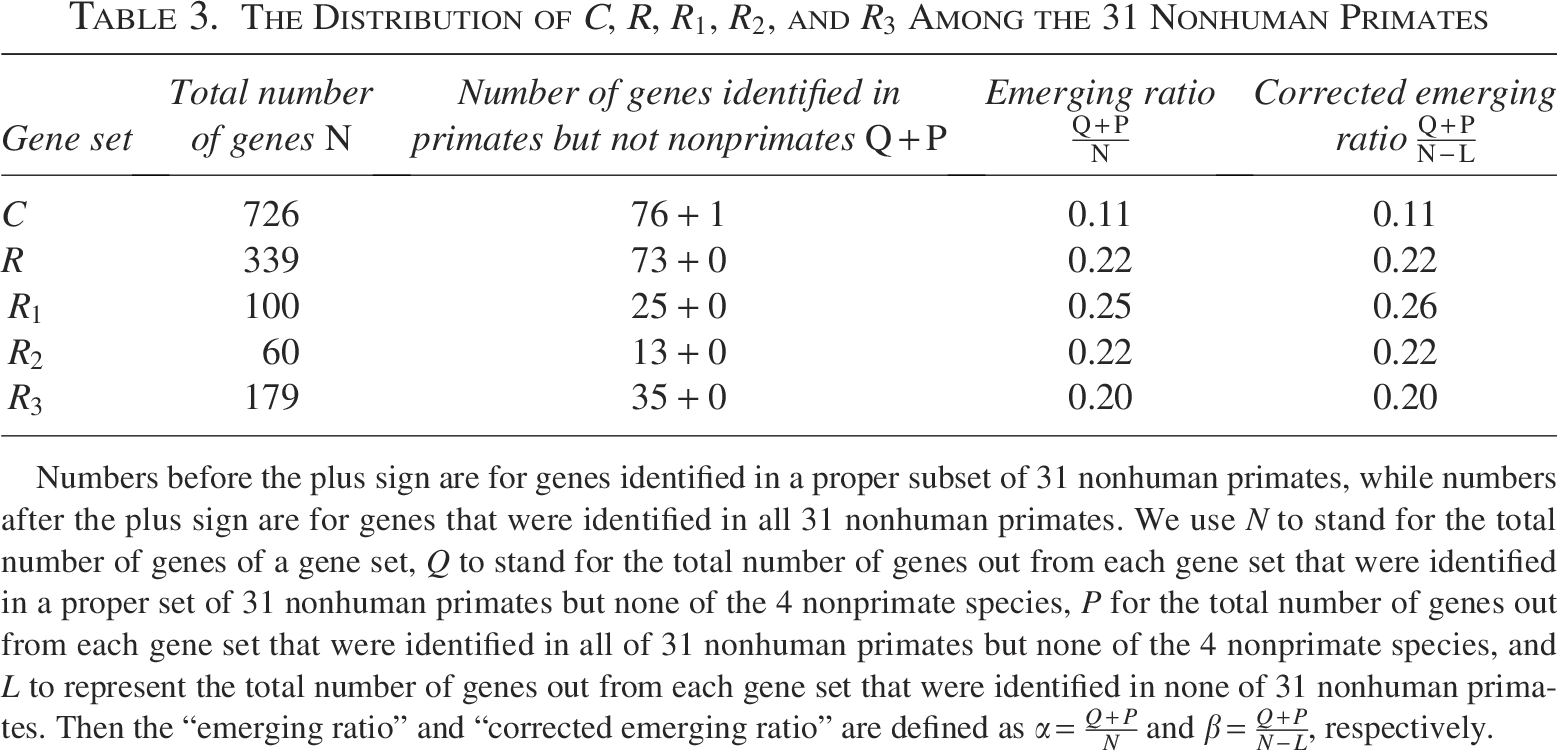
In this section, we present the results for those cancer genes that are specific to primate species. As indicated in Section 2, a gene is only considered to be primate-specific in this study if (1) the gene is found in at least one of the 31 primate species and (2) the gene is found in none of the 4 nonprimate species. Table 3 shows the number of genes that satisfy the criteria. Out of 726 genes in C, 1 gene is detected in all of the 31 nonhuman primate species and none of the 4 nonprimate species, 76 genes are detected in a nonempty proper subset of the 31 nonhuman primate species and none of the 4 nonprimate species. For a total of 339 random human genes, the numbers are 0 and 73, respectively. Similar to the result described in Section 3.1, a corrected ratio is provided in a separate column.
The Distribution of C, R,
,
, and
Among the 31 Nonhuman Primates
The Distribution of C, R,
Numbers before the plus sign are for genes identified in a proper subset of 31 nonhuman primates, while numbers after the plus sign are for genes that were identified in all 31 nonhuman primates. We use N to stand for the total number of genes of a gene set, Q to stand for the total number of genes out from each gene set that were identified in a proper set of 31 nonhuman primates but none of the 4 nonprimate species, P for the total number of genes out from each gene set that were identified in all of 31 nonhuman primates but none of the 4 nonprimate species, and L to represent the total number of genes out from each gene set that were identified in none of 31 nonhuman primates. Then the “emerging ratio” and “corrected emerging ratio” are defined as
Similar to in Section 3.1, we notate the related terms as follows. We use N to stand for the total number of genes of a gene set, Q to stand for the total number of genes out from each gene set that were identified in a proper set of 31 nonhuman primates but none of the 4 nonprimate species, P for the total number of genes out from each gene set that were identified in all of 31 nonhuman primates but none of the 4 nonprimate species, L to represent the total number of genes out from each gene set that were identified in none of 31 nonhuman primates. Then the “emerging ratio” and “corrected emerging ratio” are defined as
Contingency Table of Fisher’s Exact Test Results Based on Table 3
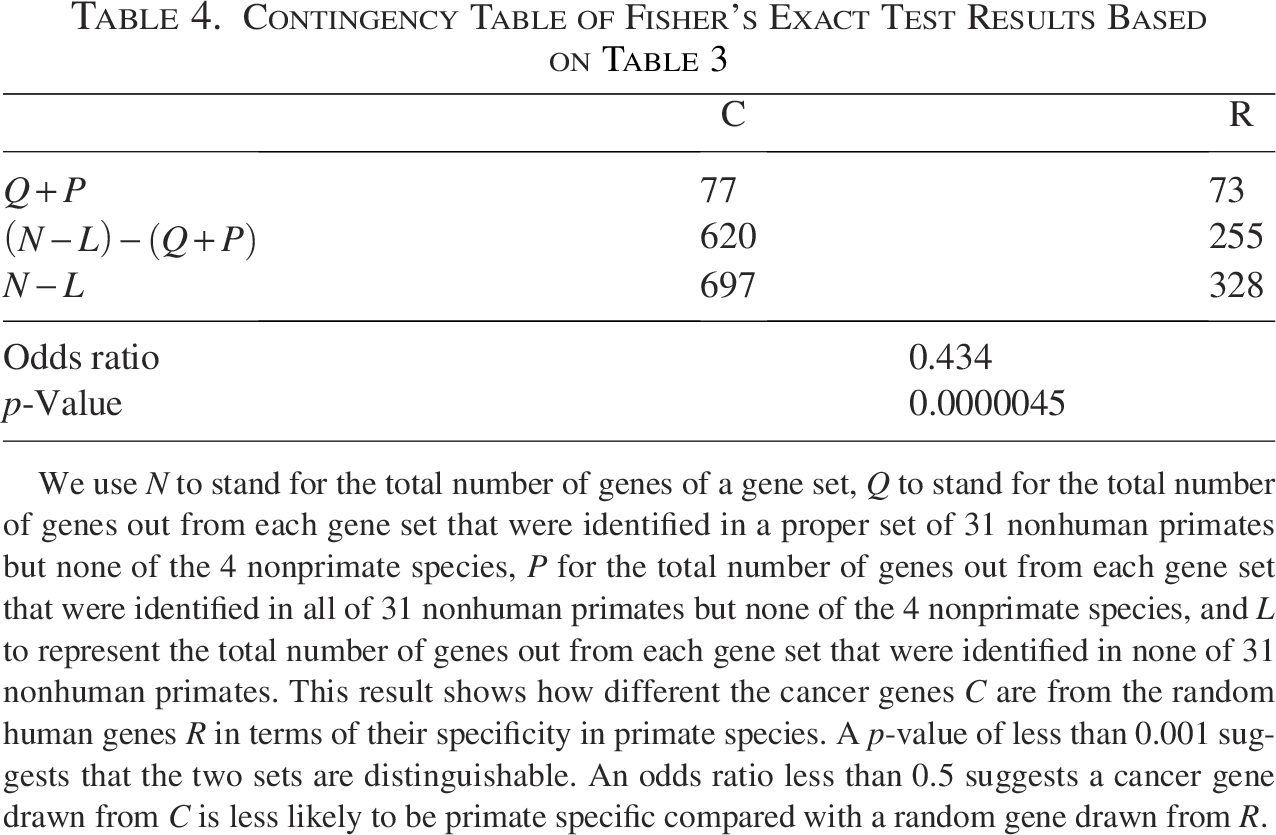
We use N to stand for the total number of genes of a gene set, Q to stand for the total number of genes out from each gene set that were identified in a proper set of 31 nonhuman primates but none of the 4 nonprimate species, P for the total number of genes out from each gene set that were identified in all of 31 nonhuman primates but none of the 4 nonprimate species, and L to represent the total number of genes out from each gene set that were identified in none of 31 nonhuman primates. This result shows how different the cancer genes C are from the random human genes R in terms of their specificity in primate species. A p-value of less than 0.001 suggests that the two sets are distinguishable. An odds ratio less than 0.5 suggests a cancer gene drawn from C is less likely to be primate specific compared with a random gene drawn from R.
As shown in Tables 1 and 2, while the total random gene set has a ratio of approximately 0.22 for primate specificity, the human cancer gene set has a primate specificity ratio of approximately 0.11. Combined with Fisher’s exact test result, which shows a p-value below 0.001, these findings suggest that human cancer genes are less specific to primate species compared with random sets of human genes. Compared with a random human gene, a human cancer gene is less likely to have a newer evolutionary origin after the speciation of primates.
In addition, following the previously discussed findings, we conducted a preliminary comparison of the inferred emergence times of cancer genes and random genes after primate speciation. The purpose of this comparison is to identify whether the trends in their emergence times after primate speciation were also distinct.
It is important to note that although we use primate clades instead of single species to infer gene emergence times, this approach may still be biased. Thus, the inferred emergence times presented in the results should not be interpreted as absolute, but rather as relativistic comparisons between the two gene sets.
Figure 2 shows the estimated emergence time of all the 726 cancer genes alongside the 339 random human genes, based on their existence status among 32 primate species, following the methods described in (Liang and Heath, 2023). To facilitate direct comparison, the random gene set was adjusted for size. Since only primate-specific genes could be included in the analysis, the exact sizes of the gene sets could not be predetermined, making it challenging to ensure equivalent sizes for both sets. As a result, the random gene set size was adjusted accordingly.
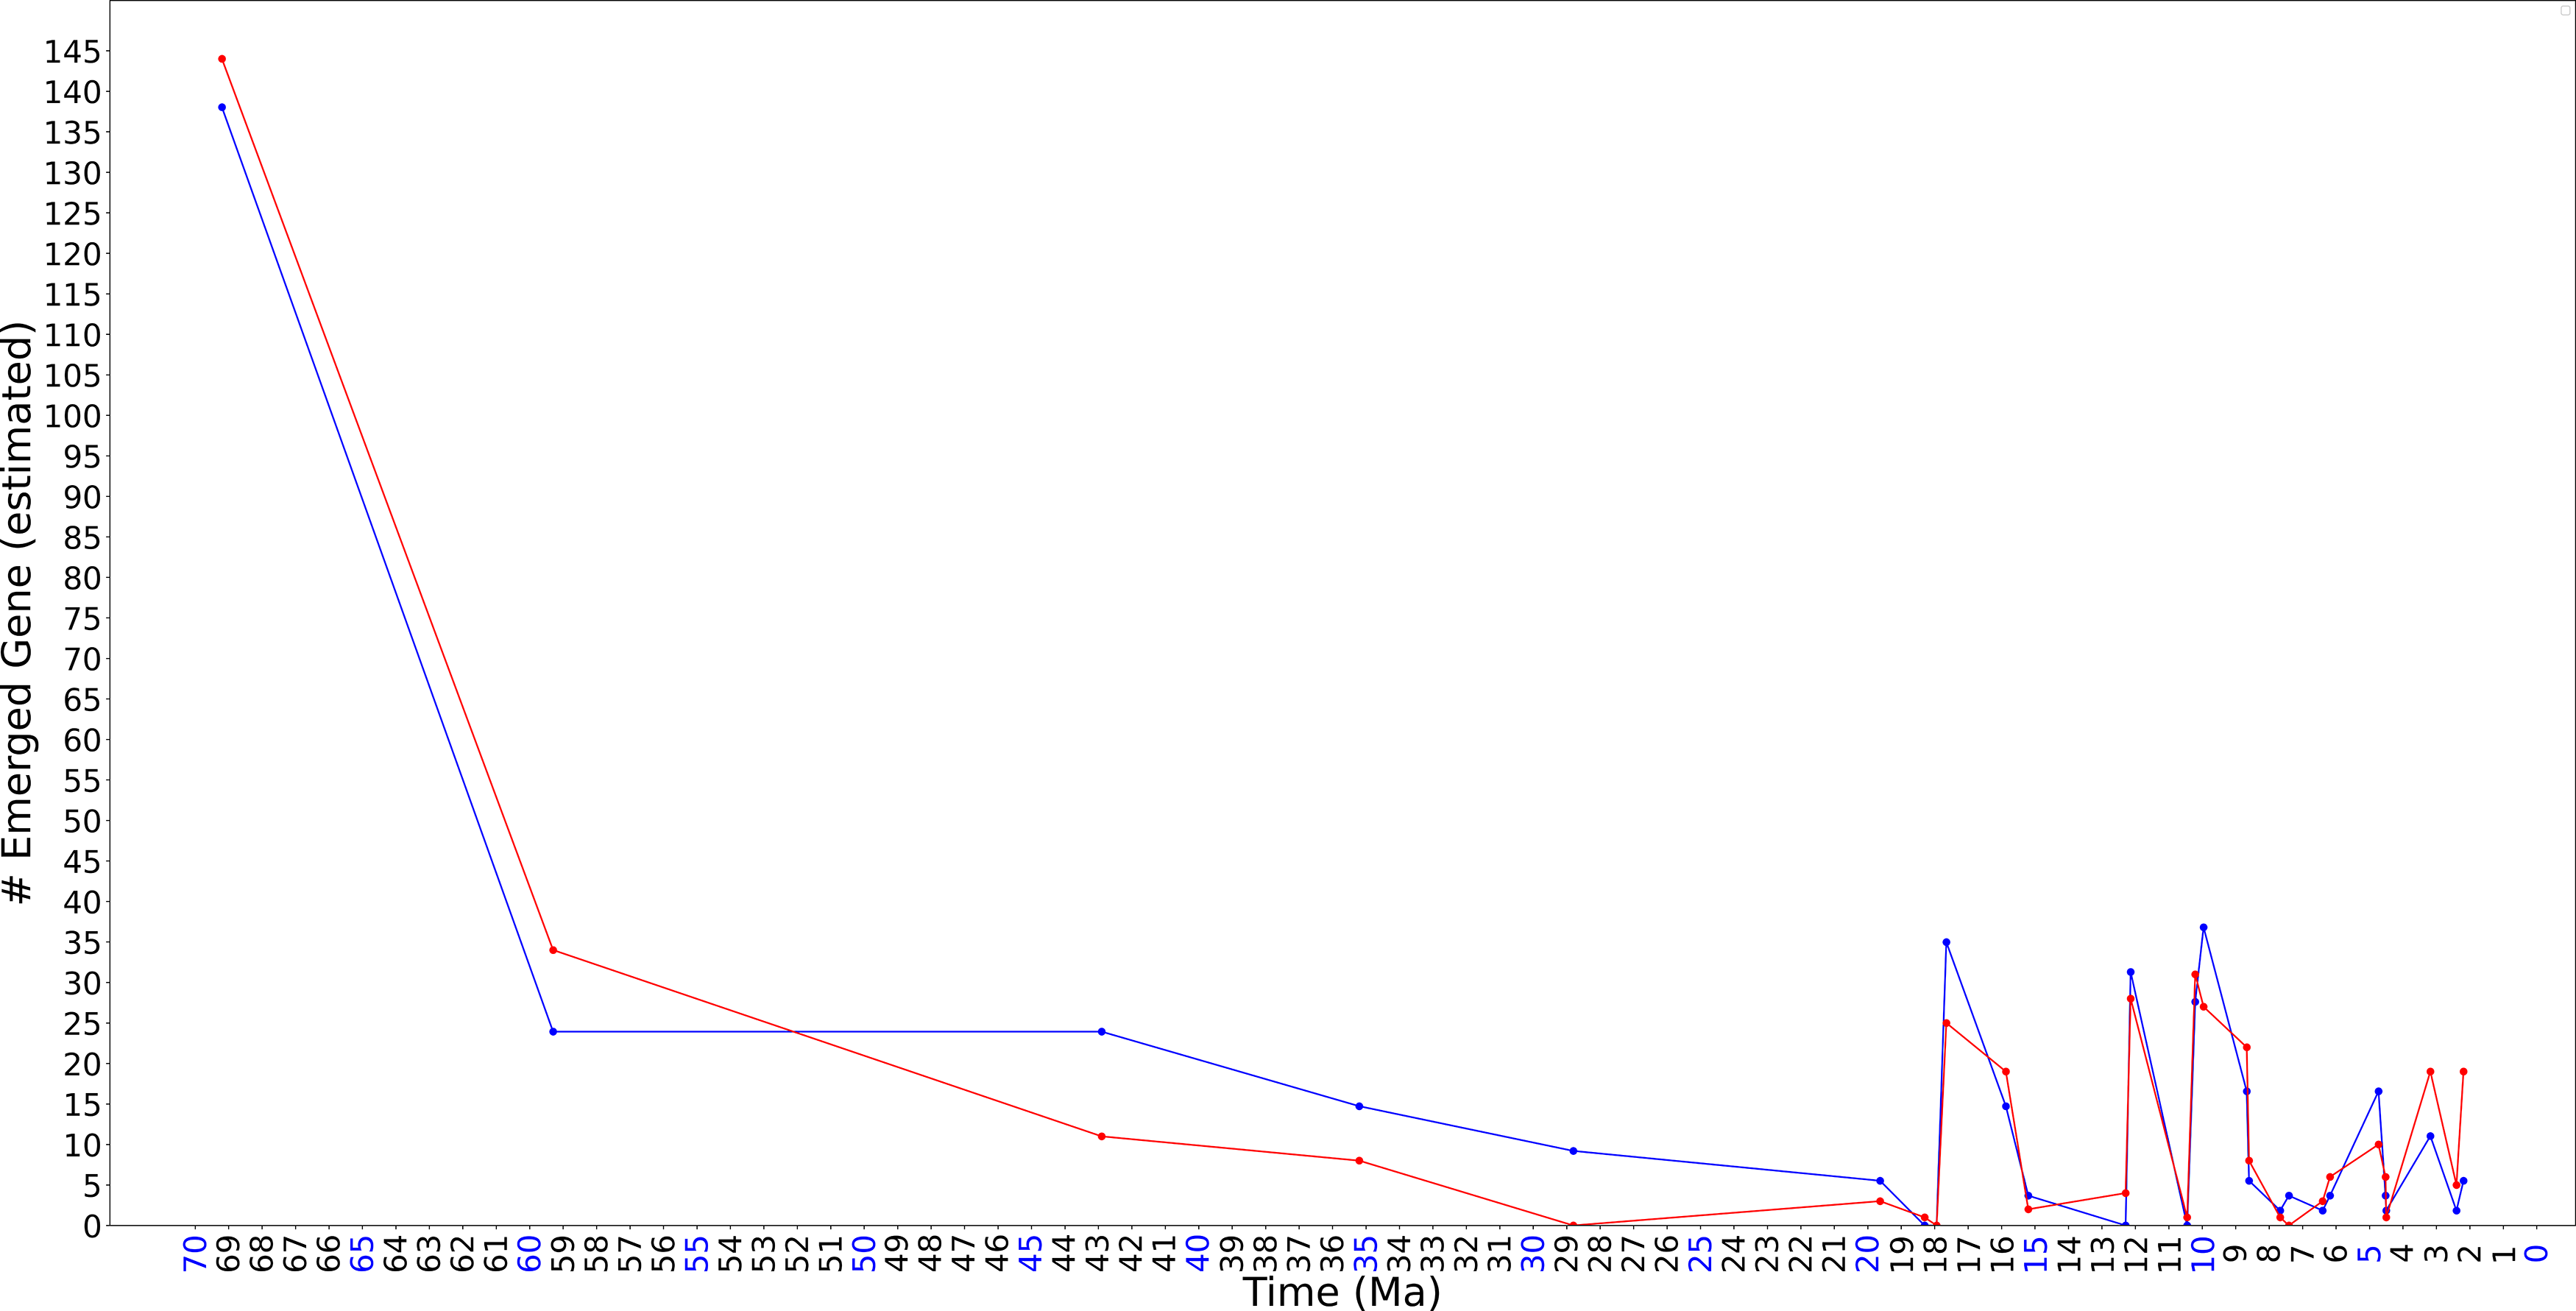
A preliminary comparison between cancer genes and random human genes, examining the estimated number of newly emerged genes in association with the time since primate speciation. Red markers represent 438 human cancer genes from the entire gene set Cancer Gene Census (Sondka et al., 2018) that can be assigned an estimated emerging time. Blue markers represent the random set of 238 human genes that has an estimated emerging time. To account for differences in gene set sizes, numbers of random genes are scaled using a
Given prior conclusions, we hypothesized that cancer genes would exhibit earlier emergence times than random human genes after primate speciation. However, this is not observed in Figure 2. On the contrary, under this specific setting of approach and data, cancer genes show fewer emergence numbers compared to random genes until 4 million years ago, with an increase thereafter. While numerous explanations are possible, we do not speculate on the specific cause, instead presenting the result to encourage further investigation.
In this section, we present the results for those cancer genes that are absent from certain primate clades. Primate clades used for this investigation are described in Section 2.4. Out of 726 human cancer genes, 75 genes are found to be absent in at least one primate clade. In the remainder of the paper, we will denote by
Among the 75 genes in
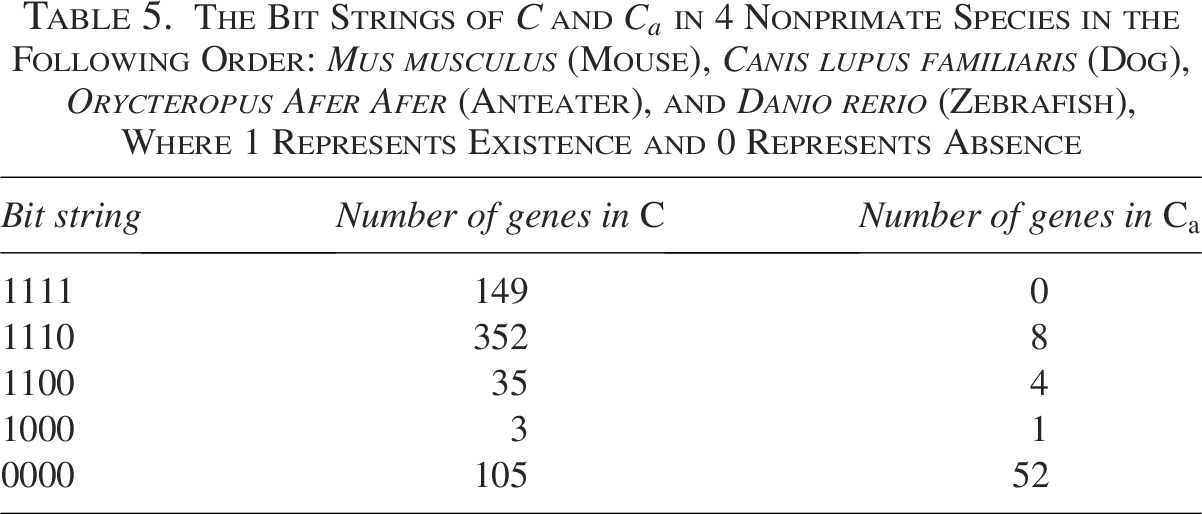
For clarity in presenting the results, we use bit strings to represent the gene presence status in four nonprimate species. These bit strings are arranged in the order of the species’ evolutionary distance from human: Mus musculus (mouse), Canis lupus familiaris (dog), Orycteropus afer afer (anteater), and Danio rerio (zebrafish), where 1 represents existence and 0 represents absence. For example, “0000” represents gene absence in all four species, while “1111” indicates gene presence in all four.
Of the 16 possible bit strings, we recognize five as more meaningful and regular: (1) “1111” indicating that a gene is present in all four nonprimate species, (2) “1110” indicating that a gene is specific to mammals, (4) “1100” indicating that a gene is specific to well-studied mammals (excluding anteaters), (4) “1000” indicating that a gene is specific to mouse, and (5) “0000” indicating that a gene is absent in all four nonprimate species. As the bits are ordered by the species’ evolutionary distance from human, other bit strings may correspond to mutations, detection errors, or incomplete genome sequences. In our results, the other bit strings are rarer cases compared with the five regular bit strings. While investigating these irregular bit strings can be interesting under certain circumstances, we have excluded them in later examination as outliers. For reference, the tables containing all the 16 possible bit strings are available in Supplementary Data.
Table 5 displays the bit strings of the cancer genes in C and
The Bit Strings of C and
in 4 Nonprimate Species in the Following Order: Mus musculus (Mouse), Canis lupus familiaris (Dog), Orycteropus Afer Afer (Anteater), and Danio rerio (Zebrafish), Where 1 Represents Existence and 0 Represents Absence
The Bit Strings of C and
Contingency Table of Fisher’s Exact Test Results Based on Table 5
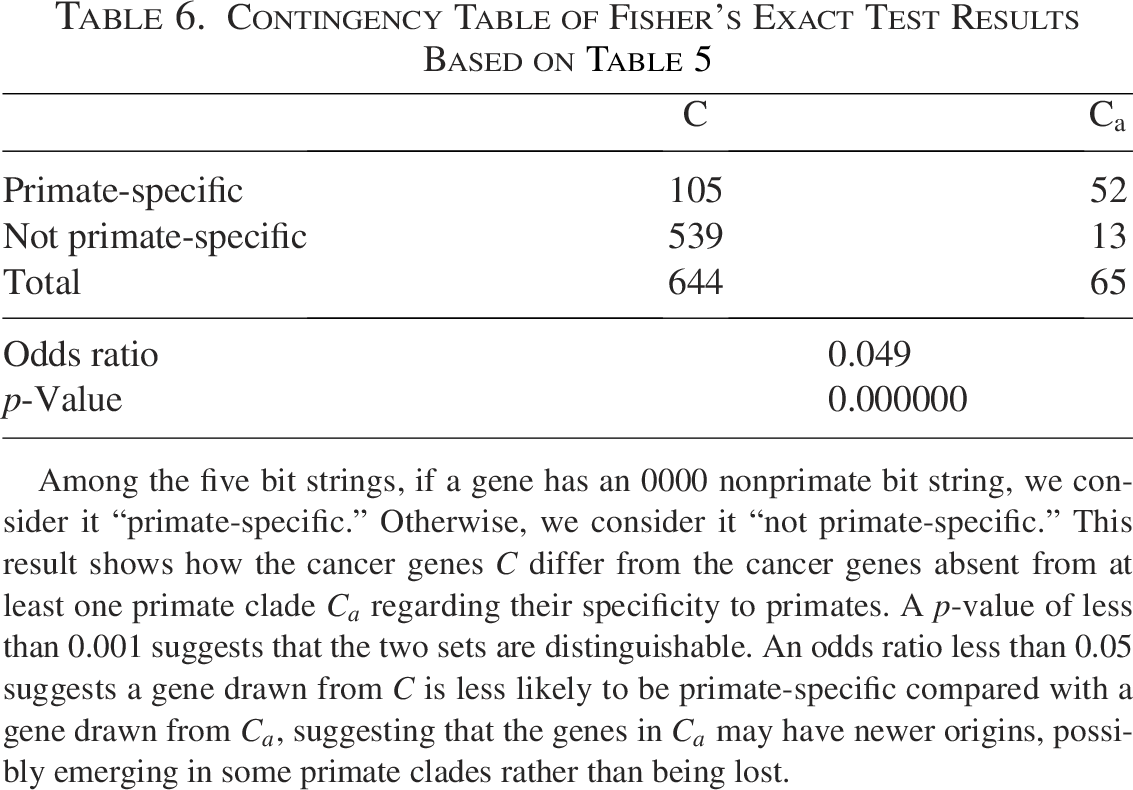
Among the five bit strings, if a gene has an 0000 nonprimate bit string, we consider it “primate-specific.” Otherwise, we consider it “not primate-specific.” This result shows how the cancer genes C differ from the cancer genes absent from at least one primate clade
As mentioned previously, note that some of the bit strings may have resulted from mis-detection or incomplete genome data. Furthermore, the divergence times for the first three nonprimate species are relatively close (approximately 99 to 87 Ma), whereas zebrafish diverged significantly earlier. To account for the possible effects caused by farther evolutionary distance, results generated with an adjusted for zebrafish are provided in the Supplementary Data.
Additionally, we report an interesting finding on genes associated with a specific type of cancer. Among the 733 cancer genes in the original dataset obtained from Cancer Gene Census (Sondka et al., 2018), only 5 cancer genes are associated with synovial sarcoma, a relatively rare tumor that accounts for only 5%–10% of all soft tissue sarcomas (Gazendam et al., 2021), which themselves account for 1% of all tumors (Berwick and Wiggins, 2017). Four of these genes are found to be absent from at least one primate clade (excluding human). Gene SSX1 is absent in clade 1 and b, while exists in clades 4, c, d, g, and h. SSX2 and SSX4 are absent in clades 1 and b, while exist in clades 4, c, and d. SS18L1 is absent in clades 1 and c, while it exists in 2 and f. All these four genes are oncogenes. Figure 3 illustrates their existence and absence in different clades.
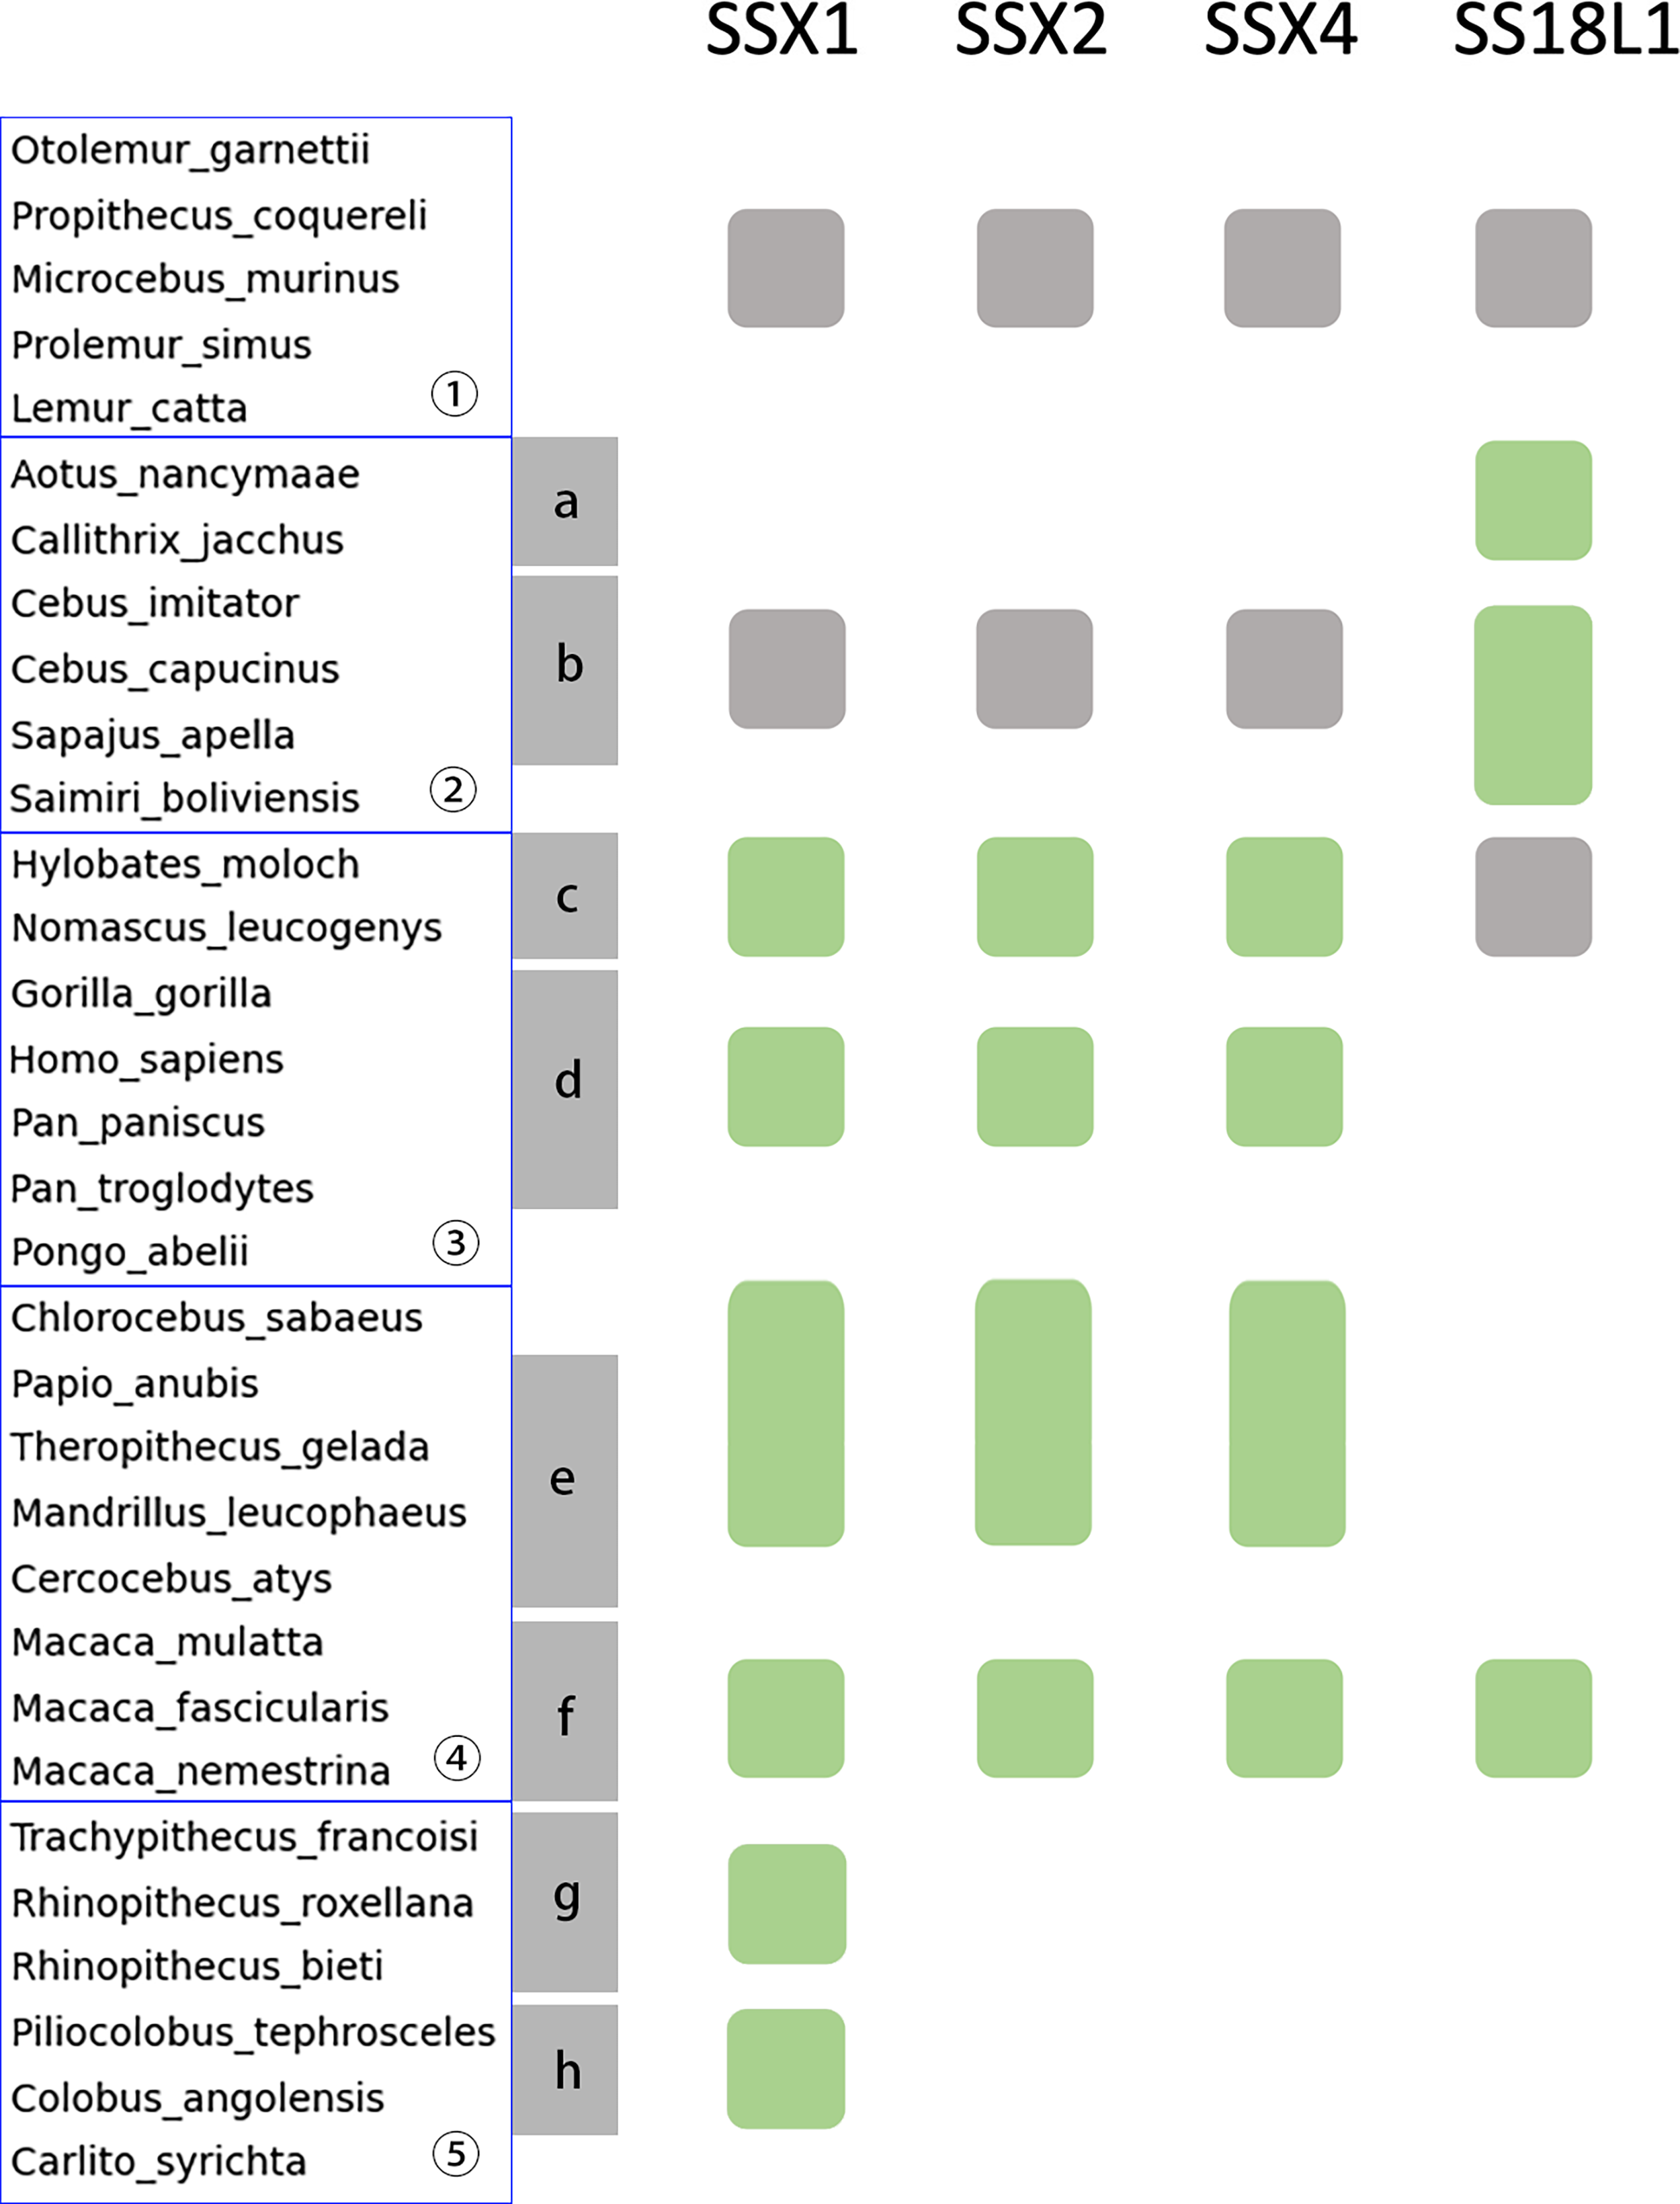
The distribution of four cancer genes associated with synovial sarcoma: SSX1, SSX2, SSX4, and SS18L1. A green block represents the existence of the gene in the corresponding clade, while a gray block represents the absence from the entire clade. For the clades shown on the left hand side, as in Figure 1, the blue boxes display the partition of the six large clades, while the ranges of gray solid rectangles mark the eight small clades as described in Section 2.4. Numeric labels represent large clades, while alphabetic labels represent small clades. Human (Homo Sapiens) is not included in any clade during the analysis processes, but is included in the figure to show the distances from other species to human.
While the other three genes are absent from further branches that diverge from human at 42 Ma or earlier, gene SS18L1 exits in such a branch while is absent from a closer clade, clade c. Overall, gene SS18L1 has a different existence pattern among primates compared with the other three genes associated with synovial sarcoma.
Furthermore, osteosarcoma, the most common type of bone cancer, has four associated genes indicated in the 733 cancer genes. Two of them are found to be absent from one clade distantly related to human, which is clade 1 as shown in Figure 1. In these two genes, WRN is a tumor suppressor gene while RECQL4 is an oncogene.
Among the 12 human cancer genes absent from suborder Strepsirrhini (clade 1), genes FAM47C and TERT are identified in the Cancer Gene Census (Sondka et al., 2018) as associated with melanoma. Melanoma is a type of skin cancer that has ultraviolet radiation in sun exposure as a risk factor (Armstrong et al., 2017). The absence of the associated gene in the suborder Strepsirrhini may be related to the nocturnal behavior of species within this clade.
For the four genes associated with osteosarcoma or melanoma and absent from clade 1, we have performed a preliminary Ka/Ks analysis to estimate their evolutionary constraint, as described in 2.5. FAM47C has
The discussion of this study explores research and potential mechanisms related to the presented results. Additionally, we explore possible research directions that may offer valuable insights, even though the specific nature of some connections has not been clearly identified in this study.
Primate genes and cancer
The gene differences in primates have been studied in many aspects, including body mass, life history, climatic niche, social behavior, diet composition, and disease (Kamilar and Cooper, 2013; Niimura et al., 2018; Silcox and López-Torres, 2017). While the last aspect is directly related to cancer, all the other aspects listed above may also be associated with the absence of cancer genes in certain primate species, as will be discussed in more detail in Section 4.2.
There is previous work associated with cancer genes that emerged earlier than primates. Kuderna et al. (Kuderna et al., 2023) reported that human disease genes suffer from ape-specific missense changes, in a greater proportion than expected by chance. Gao et al. (Gao et al., 2023) suggested that missense variants found in at least one nonprimate species tend to be benign, compared with the total set of missense variants. Therefore, these variants are less likely to cause human disease as they were tolerated by natural selection in closely related species. They also found that the disease-related missense has been gradually removed throughout the primate lineage. In the results of this study, cancer genes were found to be shared in a higher proportion in primate species than random genes, which is consistent with the previous findings.
Gao et al. (Gao et al., 2023) suggests that certain genes have significant differences in selective constraint between human and other primates, where the selective constraint is defined as the ratio of missense over synonymous mutations for individual genes. TERT is one of these genes whose selective constraint has increased most in humans compared across 211 primate species. TERT has an effect on maintaining telomere length (Heidenreich and Kumar, 2017), which has been shown to be associated with longevity (Adwan Shekhidem et al., 2019). While TERT is a beneficial gene in humans that possibly contributes to longevity through the maintenance of the telomere, it is also an oncogene associated with various cancers in human, such as melanoma, glioblastoma, hepatocellular carcinoma, mesothelioma, and medulloblastoma (Sondka et al., 2018). Therefore, it is possible for cancer genes to not show a trend toward earlier emergence time, compared with other genes, after primate speciation.
Recent studies have identified a class of cancer genes referred to as Tumor Specifically Expressed, Evolutionarily New genes (Kozlov, 2016; Makashov et al., 2019; Matyunina et al., 2019). On one hand, these tumor specifically expressed genes are evolutionarily new, originating from coding or noncoding sequences through various mechanisms (Kozlov, 2016; Matyunina et al., 2019). On the other hand, Makashov et al. (2019) have demonstrated that oncogenes, tumor suppressor genes, and differentiation genes are probably the second most ancient type of genes after the housekeeping genes. Based on the previous findings, whether there are bimodal emergence peaks of human cancer genes, one early in time and the other much more recent, remains a topic worth exploring.
Cancer types and absent genes
Genes absent from lemurs
Among 75 genes in
Other than clade distance and genome size, one notable characteristic of lemurs is their nocturnal habit. Lemurs have a different visual system from other primate species in terms of corneal size and visual acuity (Shao et al., 2023). In addition, lemurs are exposed to less sunlight. Ultraviolet radiation in sun exposure is a risk factor for melanoma, including ocular and cutaneous melanoma (Armstrong et al., 2017). It is also reported that compared with Strepsirrhinis, Simiiformes usually possess darker skin pigmentation (Shao et al., 2023). Among the 12 human cancer genes absent from lemurs, gene FAM47C and TERT are identified as associated with melanoma in the Cancer Gene Census (Sondka et al., 2018), indicating a possible link. Further study of the association of these human cancer genes with the lemur genes, such as NPHP4, GRHL2, and SLC39A5 associated with the visual system, as well as KIT and CREB3L4 associated with skin pigmentation, can be an interesting direction for additional study.
It is also notable that TERT is a gene previously mentioned, being reported to have effect on maintaining telomere length (Heidenreich and Kumar, 2017) and one of the genes whose selective constraint increased most in human compared across 211 primate species (Gao et al., 2023). Missense mutations of TERT can transform it into an oncogene for various cancer types, including melanoma. These facts indicate the importance of this gene. Compared with two other cancer genes missing from lemurs as shown in Section 3.3, TERT shows a stronger constraint in terms of Ka/Ks ratio, which may be related to its beneficial functions in telomere length maintenance. The relatively strong constraint of TERT and its absence in other primates including lemurs, can provide one perspective for future comparative studies.
Cancer and diet
Different primate species have diverse dietary habits. One categorization is to classify some primates as frugivores and folivores, where the former prefers fruits and the latter prefers leaves as food (Silcox and López-Torres, 2017). Primate species can also have different dietary structures depending on their habitats (Marshall and Wrangham, 2007). As for diet, humans are omnivorous. From the perspective of cancer, there have been studies on the effect of dietary structure on cancer. For example, studies regarding non-Hodgkin lymphomas (NHLs) show that while fruit consumption has no association with NHL risk overall, some results indicate a certain association between vegetable consumption and NHL risk (Cerhan et al., 2017). In gastric cancer, a previous study has reported a 10% decreased risk for high fruit consumers compared with low fruit consumers, while no significant association being reported on vegetable consumption, except for salt-preserved vegetables (Martel and Parsonnet, 2017; Wang et al., 2014b). Other studies have categorized fruits and vegetables together against other food choices, such as meat, for cancer risk evaluation in renal and colorectal cancers (Chow et al., 2017; Wu et al., 2017). Further investigation of the relationship between gene distribution among primates and primate dietary habits can be a future subject of study.
It has been suggested that olfaction may have an impact on primate food preferences, and fruit foraging is more dependent on olfaction than leaf foraging (Niimura et al., 2018). Shao et al. (2023) reported that, compared with the nocturnal Strepsirrhinis, olfactory sensitivity has been decreased in Simiiformes. This may be related to the fact that nocturnal lemurs are less capable of relying on vision to forage for food. This finding is also consistent with another finding that the olfactory receptor genes in mouse have become unitary pseudogenes in humans, where the gene sequences are retained but no longer processed to produce proteins (Zhang et al., 2010). These distinctions among primate species may have led to some gene differences regarding olfaction and digestion. Among the genes missing from a certain primate clade, genes VHL, CNBD1, SETD1B, PTK6, SDHA, and MUC1 are associated with the aforementioned digestive system related cancers or NHL, where WDCP is missing in the Strepsirrhinis. Understanding the olfaction and diet structure difference between Strepsirrhini and humans may help us better understand digestive system related cancers from a gene difference perspective.
Sarcoma associated genes
Synovial sarcoma is a relatively rare tumor that accounts for only 5%–10% of all soft tissue sarcomas (Gazendam et al., 2021), while all types of soft tissue sarcomas account for 1% of all tumors (Berwick and Wiggins, 2017). In this study, four out of five synovial sarcoma oncogenes identified in Cancer Gene Census (Sondka et al., 2018) have been found to be absent from several primate clades. This type of cancer tends to occur in large joints such as knees (Murphey et al., 2006) and, therefore, tends to be related to the upright walking of humans. The arboreal habits of some primate species may also be a factor, but the exact link remains unknown.
Osteosarcoma is another type of sarcoma and the most common bone cancer (Berwick and Wiggins, 2017). The age distribution of osteosarcoma is bimodal, with one peak in the teenage years associated with rapid bone growth, and the other peak in later life (Berwick and Wiggins, 2017). The latter peak is possibly associated with the aforementioned antagonistic pleiotropy assumption for cancer mechanisms. The oncogene RECQL4 and the tumor suppressor gene WRN are both missing from Strepsirrhinis, possibly indicating that the two genes co-evolved in primates and their emergence time is later than the divergence between Strepsirrhinis and Simiiformes, which is approximately 69 Ma, as obtained from the TimeTree database (Kumar et al., 2022).
CONCLUSION
In this study, we investigate the existence of 726 human cancer genes across 32 primate species and 4 nonprimate species, in comparison with 339 randomly selected human genes. The results indicate that compared with random human genes, a higher proportion of cancer genes have older origins predating primate speciation, demonstrated in two directions: (1) cancer genes are more prevalent in primate species than random human genes, indicating more cancer genes existed prior to primate speciation, and (2) after primate speciation, cancer genes are less specific in primate species, indicating less cancer genes emerged after primate speciation. Moreover, human cancer genes that are absent from certain primate clades are more likely to have emerged in other clades, rather than being eliminated from them. Cancer types associated with the genes absent from certain clades can possibly be related to the cancer type, as well as characteristics of the primate species within the clades.
LIMITATIONS AND FUTURE WORK
It should be noted that this study primarily considers de novo gene emergence and does not account for more distant coding region ancestors of cancer genes emerging from sources such as gene duplication, lateral gene transfer, and gene fusion. Thus, the conclusions should be applied within the de novo gene emergence context and may not extend to cases involving other mechanisms. In the meantime, these other mechanisms of gene emergence are also highly relevant in the context of evolutionary genomics and cancer biology. Specifically, the role of multiple homologous sequences within the same species in cancer-related evolution, an aspect not considered in this study, can be an important direction for future research.
BLAST and low-quality genomes can lead to potential false negatives in gene existence. In this study, this issue is mitigated by always comparing results across different gene sets and species clades, rather than depending on a single set of genes or species. For future work, methodologies could be developed and applied to account for BLAST sensitivity and genome quality, allowing more robust analyses on single gene sets and species.
As mentioned in Section 1, noncoding regions such as microRNAs and long noncoding RNAs are gaining increasing attention in cancer related research. In this study, we primarily focused on protein CDSs, without examining noncoding sequences or their interactions with protein CDSs, which can be worthwhile for further research. Additionally, this study investigated de novo gene emergence and gene elimination, but did not delve into their origins before becoming protein-CDSs or their destinations after elimination, both of which can be closely related to noncoding regions. Future research that examines these origins, destinations, and interactions with noncoding regions would provide valuable insights.
AUTHORS’ CONTRIBUTIONS
X.L.: Conceptualization, methodology, data curation, investigation, software, writing—original draft preparation. L.S.H.: Conceptualization, methodology, supervision, writing—reviewing and editing. All authors read and approved the final article.
Footnotes
ACKNOWLEDGMENT
The authors would like to thank their lab members who provided suggestions on this article: Badhan Das, Yoonjin Kim, and Jingyi Zhang.
AUTHOR DISCLOSURE STATEMENT
The authors declare that they have no conflicts of interest.
FUNDING INFORMATION
No funding was received for this article.
AVAILABILITY OF DATA AND MATERIALS
The data sources of primate CDS, human protein sequences, and phylogenetic tree are indicated in Section 2. The accession numbers of the 32 primate genomes and 4 nonprimate genomes, tables of human cancer genes and random genes investigated in this study, full tables of cancer genes absent from primate clades, as well as the scripts used to process the data and generate result figures can be found at ![]() .
.
Supplemental Material
References
Supplementary Material
Please find the following supplemental material available below.
For Open Access articles published under a Creative Commons License, all supplemental material carries the same license as the article it is associated with.
For non-Open Access articles published, all supplemental material carries a non-exclusive license, and permission requests for re-use of supplemental material or any part of supplemental material shall be sent directly to the copyright owner as specified in the copyright notice associated with the article.