
Abstract
Air traffic complexity demands high situational awareness (SA) among air traffic controllers. SA comprises three levels: perception, comprehension, and projection. This study examined the development of SA in inexperienced participants. We wanted to study whether mere exposure to SA levels through probes specifically designed for each level could generate a scaffold for the development of SA. Participants were assigned to five groups: three SA level questionnaires, a complete questionnaire, and a control group. Following the SPAM methodology, we measured response times, accuracy, and ATC task performance. We found that the SPAM questionnaire produced reactivity effects in the ongoing scenario, and that these effects were modulated by the SA level group. However, these effects did not systematically transfer to a subsequent scenario for all the SA level groups. Specifically, only the projection group continued to use the same strategy developed in the first scenario. In addition, our results support that the conception of SA structure is not entirely hierarchical since participants could answer higher-level probes without first having to answer lower-level probes. Implications for designing SA training interventions are discussed. These findings indicate that real-time SA questionnaires elicit short-term reactivity but fail to produce lasting impacts, limiting their utility for SA training.
Introduction
The nature of air traffic is undergoing significant transformations, characterized by continuous growth in aircraft density, automation, and operational complexity. As the number of aircraft in operation increases, one might anticipate a corresponding rise in air conflicts. However, technological advancements, automation, and the efforts of air traffic controllers (ATCOs) have maintained, or even reduced, conflict rate over time (ACRO, 2025). ATCOs are responsible for managing airspace, which includes controlling sectors where aircraft operate at varying directions, speeds, and altitudes. In the event of a potential conflict between aircraft, the ATCO must communicate with at least one of the aircraft involved to modify flight properties and prevent conflicts. Consequently, ATCOs must continuously monitor their sector, assess the current situation, and anticipate potential developments to ensure safety. The overarching cognitive construct that encapsulates these processes is situational awareness (SA).
The most widely accepted definition of SA is that of Endsley (1988, p. 97): “The perception of the elements in the environment within a volume of time and space, the comprehension of their meaning, and the projection of their status in the near future.” In other words, SA represents a complex cognitive construct encompassing various cognitive processes and temporal dimensions within the activity (Endsley, 2021; Endsley & Garland, 2000). Among ATCOs, it is common to define SA informally as “having the picture” (Durso et al., 1998), indicating that ATCOs integrate the most pertinent information from the environment to anticipate and regulate all potential occurrences. Endsley and Rodgers (1994) proposed that SA is the cognitive process preceding decision-making and execution, making its development a fundamental prerequisite for optimal air traffic control (ATC) operations.
Research findings indicate that SA compromise three levels (Durso et al., 1998; Endsley, 1995, 2015; Endsley & Garland, 2000; Jeannot et al., 2003): (1) The perceptual level involves detecting aircraft information such as speed, direction, altitude, and environmental factors like adverse weather conditions, navigational crossings, or operational constraints. (2) The comprehension level entails interpreting current events within the sector. For instance, if two aircraft are observed at the same altitude but separated by more than 10 nautical miles (nmi), the situation would not be classified as a “current conflict.” (3) The projection level concerns anticipating probable developments within the sector in the near future. This hierarchical structure suggests that accurately projecting future events is impossible without adequate information and comprehension of the current situation. However, a hierarchical conception of the SA levels does imply neither a linear relation between levels, nor a necessary development from the first to the third levels (Endsley, 2015).
Research has demonstrated that individuals with high SA tend to perform better in their tasks across various domains, including ATC (Chiappe et al., 2016; de Winter et al., 2019; Falkland & Wiggins, 2019; Fujino et al., 2020; Jones & Endsley, 2004; Li et al., 2023; Loft et al., 2015, 2018; Trapsilawati et al., 2020; Wilson, 2000), aircraft piloting (Dao et al., 2009, 2011), submarine handling (Loft et al., 2015, 2018), fire emergency response (Li et al., 2014), and surgery (Graafland et al., 2015). Therefore, workers should be encouraged to develop SA optimally and expediently to enhance overall performance.
Several methods assess SA (Endsley, 2021; Endsley & Jones, 2012; Jeannot et al., 2003; Pierce et al., 2008), ranging from indirect techniques such as EEG (Li et al., 2023; Trapsilawati et al., 2020; Wilson, 2000) or eye-tracking (de Winter et al., 2019; Li et al., 2023), to direct methods such as verbal reports (Falkland & Wiggins, 2019) and self-reports (Endsley & Garland, 2000; Taylor, 2017). However, these methods do not fully capture SA and its distinct levels. Attempts have been made to assess SA based on performance, although this approach is unconventional, as SA is more commonly used to predict or regulate ATCO performance (Farley et al., 2000; Jones & Endsley, 2004). Research indicates that while high SA tends to lead to good performance (Chiappe et al., 2016; Durso et al., 1998; Jipp & Ackerman, 2016; Li et al., 2023), acceptable performance can still be achieved without high SA (O'Brien & O'Hare, 2007).
The most effective way to measure SA is through objective questionnaires (Durso et al., 1998; Endsley, 2021). Two dominant formats exist within this line of research. One is the Situational Awareness Global Assessment Technique (SAGAT), developed by Endsley (2021; Endsley & Garland, 2000). This method involves freezing the simulation in which the ATCO is immersed and presenting a series of probes related to the three levels of SA. However, this method requires both working and long-term memory, limiting its applicability in real-world conditions, as ATCOs cannot pause their duties to answer probes. Furthermore, these methods cause an intrusion effect because the user must suddenly stop their main task and perform a different task, with no control over the situation. Consequently, this method does not permit dynamic SA assessment.
As an alternative, Durso proposed the Situation Present Assessment Method (SPAM) (Durso et al., 1998, 2017; Loft et al., 2015, 2018). In this method, ATCOs receive a phone call from an assessor and answer probes covering the three SA levels. SPAM allows for assessing response accuracy and recording response times. Findings indicate that the time taken to answer the call is strongly associated with ATCOs’ mental workload (MWL), whereas response time to probes is linked to SA (Bacon & Strybel, 2013).
The main drawback of real-time probes, such as SPAM, is their potential to induce interference or reactivity effects (Chi et al., 2023). These effects can be categorized into two main types. The first type refers to interference effects on the ongoing ATC task. Pierce (2012) demonstrated that SPAM probes affected ATC performance within a short time window following their administration and described these effects as dual-task interference. Conversely, other studies that controlled expertise or level of automation found no interference with ATC performance measures (Keeler et al., 2015; Silva et al., 2013). Additionally, none of these studies reported significant increases in MWL due to SPAM.
The second type of interference or reactivity effect concerns the SA content itself after the probes. This was examined by Bacon and Strybel (2013), who explicitly investigated whether posing probes during task execution altered subsequent SA. Their study included probes that were differentially related to upcoming events in the primary ATC task. Their results showed no consistent effect of probe content on subsequent events. This finding was interpreted as supporting the use of SPAM questionnaires for real-time SA measurement.
While prior studies examined immediate or short-term effects of SPAM probes on performance and SA content, no research has investigated these effects on a longer time scale. Given the SA’s critical importance for ATCOs, systematic training is needed (Endsley & Robertson, 2000). Analyzing SPAM’s influence on SA may inform training approaches.
This study tested whether exposing participants to SPAM probes at different SA levels would affect SA development or ATC performance in later scenarios. Specifically, we investigated whether asking inexperienced ATCOs probes at each level of SA serves as scaffolding for their construction of SA. We would like to emphasize that we want to study the formation and establishment of SA from the beginning with people who have no prior experience. This will allow us to study whether SA can be generated from the first contact with the task or if a certain level of expertise is necessary. Additionally, we want to study whether exposure to SA levels through probes can facilitate the development of SA. These objectives can only be studied with people who are unfamiliar with the task.
This approach aligns with the “question-behavior effect” observed in social psychology (Morwitz & Fitzsimons, 2004; Sprott et al., 2006; Wilding et al., 2016), where behavior changes in response to targeted probes in a specific form of training. Furthermore, previous research has proposed a differential role of working memory in the SA levels, suggesting a positive relation of working memory with the projection-level SA (Gutzwiller & Clegg, 2013). This implies that queries at the different SA levels might drive attention to the elements of the task necessary to answer the probes at that SA level (Gonzalez & Wimisberg, 2007). More specifically, Sohn and Doane (2004) demonstrated that, whereas the spatial capacity of the working memory was positively related with SA, in novice participants the strategic use of working memory on established structures, which they called “long-term working memory,” was better predictor than in expert participants.
A previous attempt to specifically train SA was conducted by O'Brien and O'Hare (2007). In their study, participants were trained in cognitive skills such as better attentional focus and better identification of the most task-relevant information with the aim of improving their SA and sector management. Despite the training not being task-specific, they found that it proved beneficial for participants with low SA in the ATC task. The results of this study suggest that SA is not merely a perceptual-attentional activity. Furthermore, the study demonstrated that even naïve participants could generate SA.
However, O'Brien and O'Hare’s (2007) approach does not allow for the study of SA formation or the extent of its hierarchical structure. We believe that these probes could be addressed by exposing participants to probes at different SA levels. In other words, we aimed to test whether exposure to SPAM probes at different SA levels affects the ability to build an appropriate SA. In this regard, we wanted to test whether receiving probes at different levels of perception, comprehension, or projection would prompt participants to seek out relevant information, encourage greater attention to imminent events, or encourage greater anticipation of future events.
Accordingly, this experiment aimed to expose different groups of inexperienced participants to the levels of SA by using probes at that specific level of SA. First, a Control group was established to determine the extent to which participants could self-generate SA within a limited familiarization period. In terms of short-term or dual-task interference, it was expected that participants explicitly exposed to the SPAM questionnaires would perform worse than those in the control group in the ongoing scenario. However, as previous studies have shown, this would not differentially affect their perceived MWL. Additionally, previous studies (Gonzalez & Wimisberg, 2007; Gutzwiller & Clegg, 2013; Sohn & Doane, 2004) have shown that dual-task interference would vary as a function of the difficulty of the secondary task (i.e., the SPAM questionnaires), such that the higher the hierarchical level of the questionnaire, the greater the performance decrements, with the complete group performing at the average of the three SA levels.
Regarding the question-behavior effect, our hypothesis was that when confronted with a second scenario featuring a complete SPAM questionnaire (comprising the three SA levels) the SA level included in the first scenario questionnaire for the different groups would act as a specific training, influencing both performance and SPAM response delays and accuracy, such that their performance would be differentially affected when the complete SPAM questionnaire involves an increase or decrease in SA level compared to the first scenario.
Method
Ethics
The university’s ethics committee approved the experimental procedure. Participants provided informed consent and received course credit for their participation.
Participants
A total of 50 participants (39 females, aged 18–29) took part in the study. All were psychology students. As a prerequisite, none had prior experience in air traffic control.
Apparatus
ATC-LabAdvance Simulator
We employed the ATC-LabAdvanced simulator developed by Fothergill et al. (2009). The simulator includes a radar image of the airspace, allowing users to engage with a realistic ATC scenario in which aircraft behavior is accurately represented. Each aircraft has an information box displaying the aircraft name, model, current speed, and current and future altitude. The ATCO could manually perform the following actions: (a) modify the altitude, speed and direction of aircraft, (b) accept and transfer aircraft to the next sector, and (c) check the route and the predicted trajectory of each aircraft.
In this study we used a rectangular sector (400 × 250 nmi) comprising four main routes with three crossing points (see Figure 1). The active sector had a density of six A320 aircraft (narrow-body airliners) and only one aircraft following a non-standard route and in evolution (i.e., changing altitude). Additionally, the scenario incorporated five pre-established conflicts. The altitude of the aircraft following standard routes ranged from 37,000 to 40,000 ft, while the speed ranged from 400 to 500 nmi per hour. For the second part of the study, participants performed the same scenario; however, it was flipped and rotated 90°, and aircraft call names were changed. All participants believed they were undertaking a completely new scenario. Image of the ATC-LabAdvanced. Note. Picture (with magnified information boxes) of the ATC-LabAdvanced representing the first scenario used in this study. The circles represent the aircraft. The information boxes include the aircraft’s callsign, its type, its current and programmed altitudes (/100), and its speed (/10). Green circles are aircraft under control. Blue circles are aircraft entering the sector. Orange circles are aircraft leaving the sector. Black solid lines represent the routes followed by the aircraft. For the second scenario, we flipped and rotated this scenario 90°.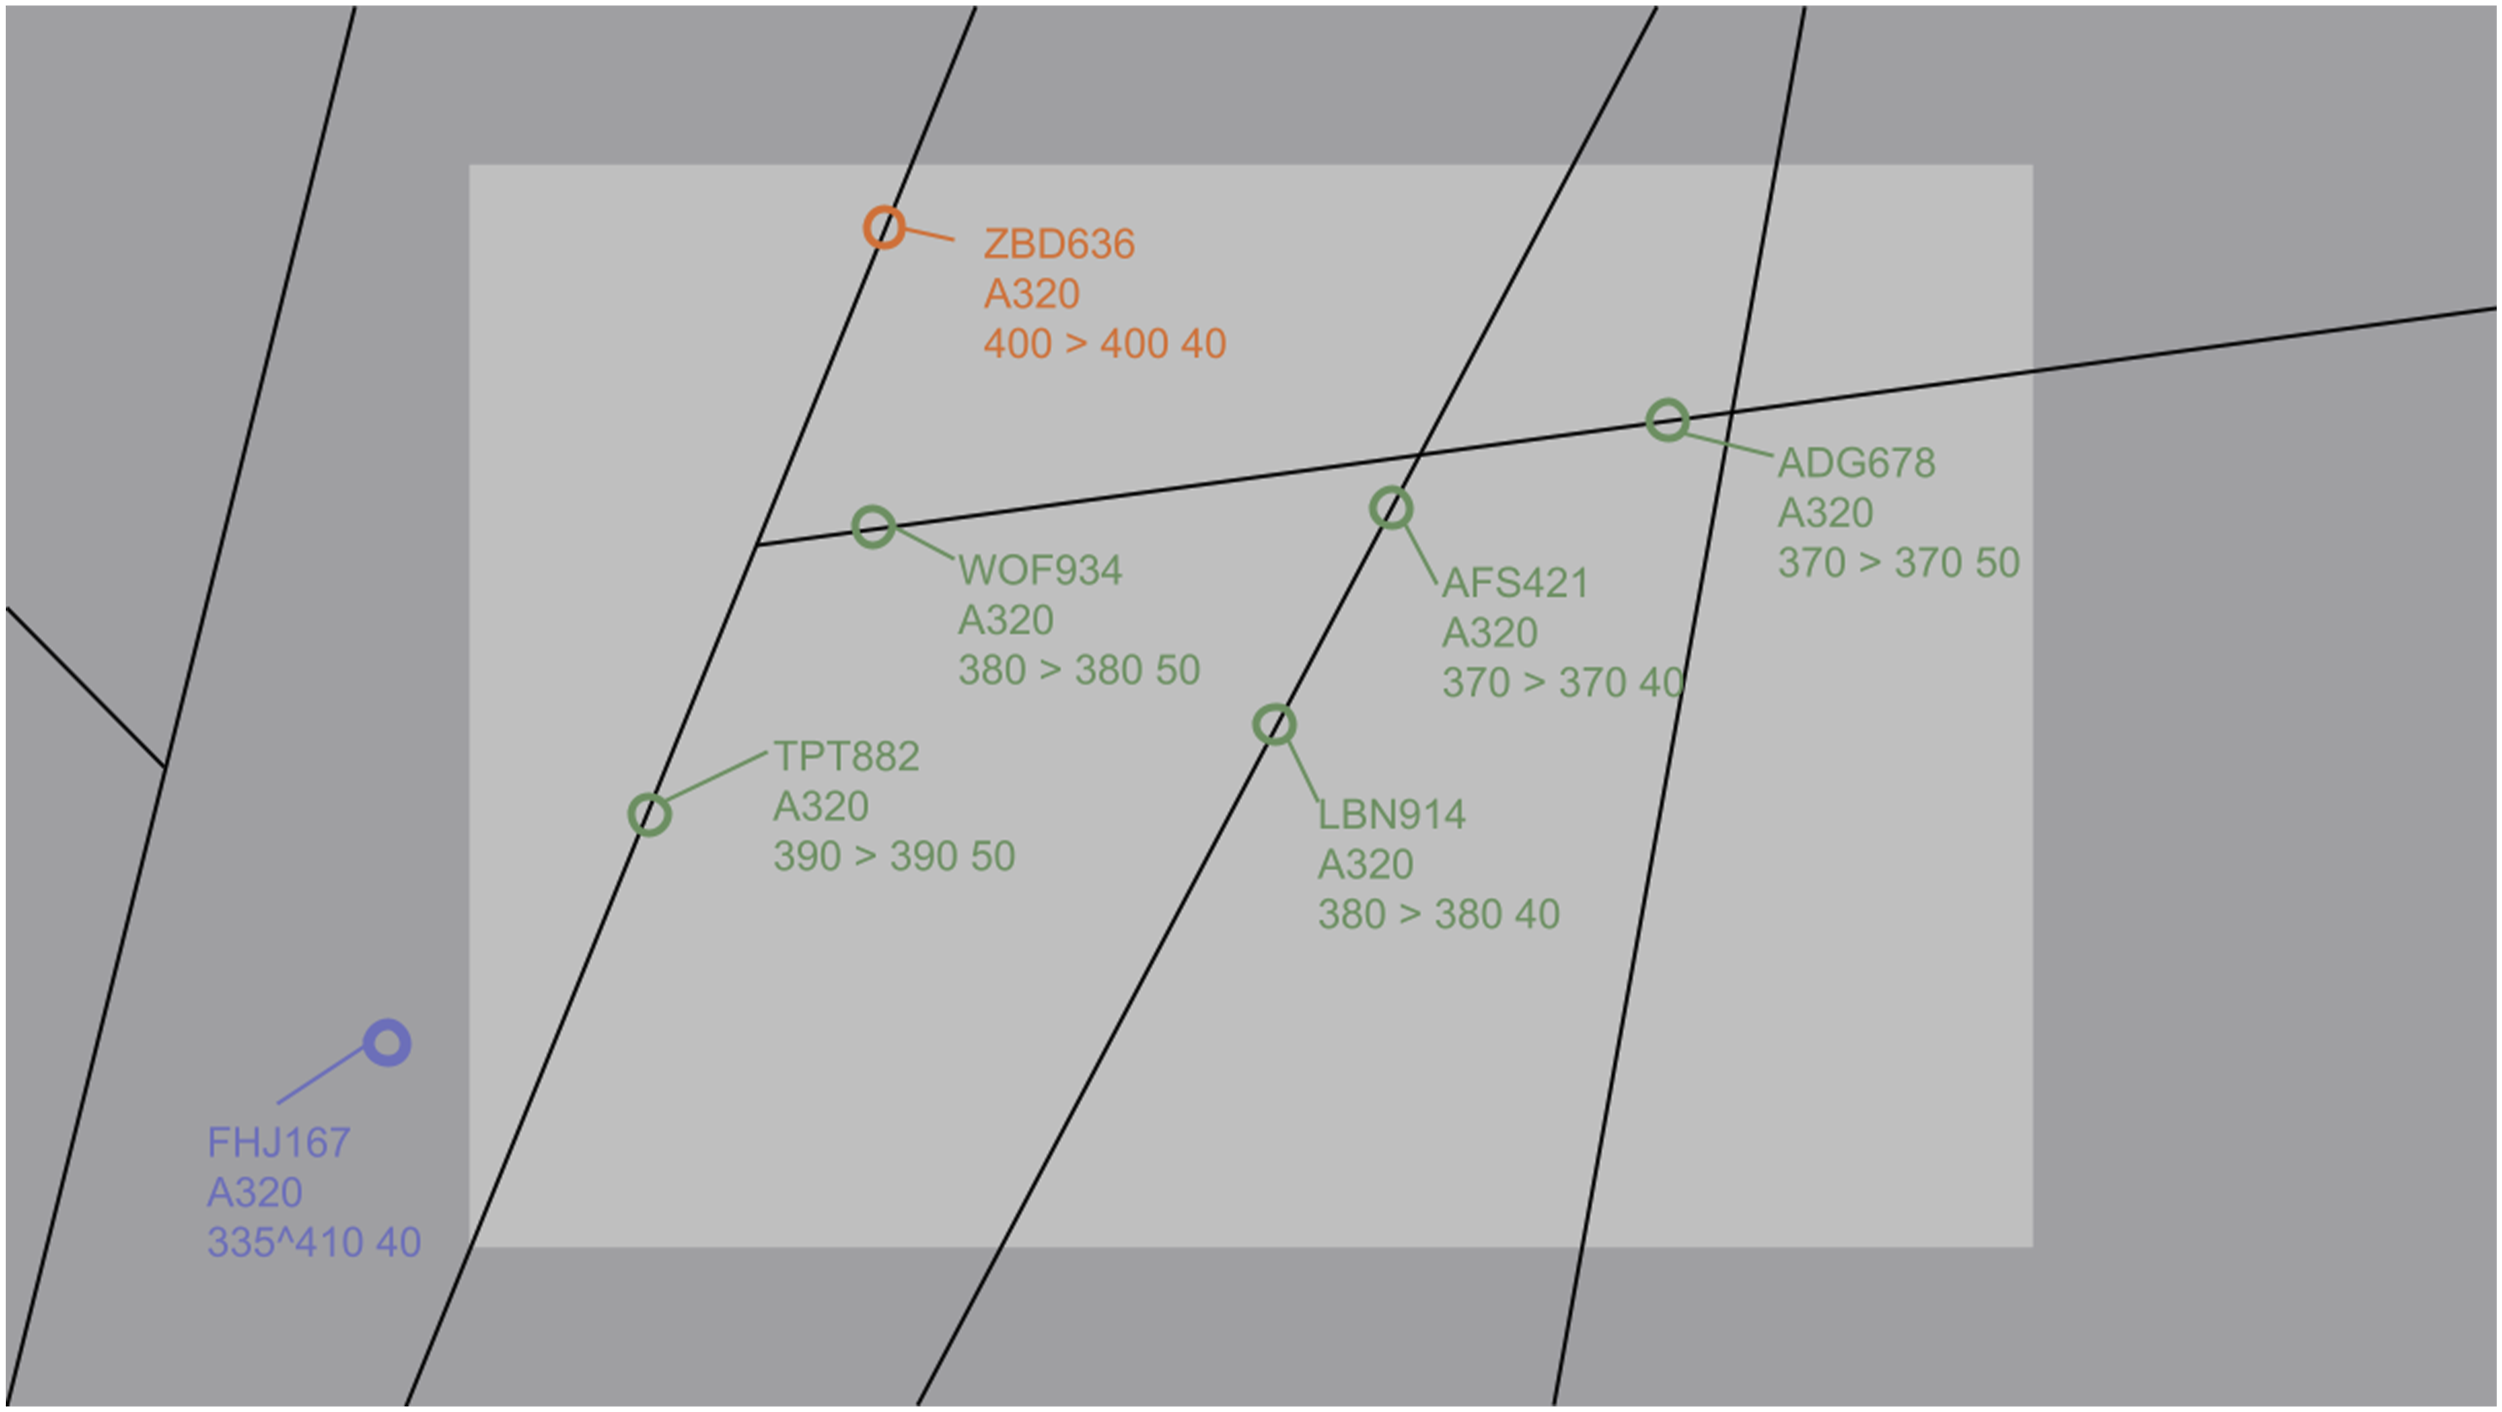
Situational Awareness (SA) Questionnaire
We developed a questionnaire to assess SA using the Situation Present Assessment Method (SPAM). During the experiment, participants received a phone call from the researcher and were asked three probes. They were instructed to answer with “yes” or “no,” with accuracy being more important than response time. The scenario remained active during the call, allowing participants to access information without relying on memory. The call could coincide with ATCO interventions to resolve (potential) conflicts. A probe set was created for each SA level. Nevertheless, each probe was independent of the others. In other words, within a given time window, a set of probes did not focus exclusively on a specific event or aircraft.
Participants were instructed to prioritize ATC tasks (main task) over answering the call (secondary task). Perceptual probes (Level 1) assessed aircraft characteristics such as speed, altitude, and trajectory changes. Comprehension probes (Level 2) evaluated the participant’s understanding of the current situation of the scenario, including conflicts and operational constraints. Projection probes (Level 3) addressed anticipated future events within four-minute and beyond, such as potential conflicts or aircraft entering or leaving the sector. The complete questionnaire is provided in Appendix 1. The probes were developed before the experiment and tailored to specific two-minute time windows. In each time window, three probes were posed, corresponding to the type of exposure (perception only, comprehension only, projection only, or complete exposure). The complete questionnaire contained one probe from each level, and the assignment of each probe within the time window was random. However, in each two-minute phone call, the probes referred to different aircraft and parts of the scenario to avoid biasing the participants, instead of asking the three probes on a certain aircraft or part of the scenario. The questionnaire, developed by the first author (author CP), was submitted to an ATM expert (author PL) and a cognitive science expert (author DT), both with more than 25 years of experience in their respective fields. Results showed an inter-rater reliability index with the questionnaire categories of ∝Cronbach = 0.983 with the ATM expert, ∝Cronbach = 0.991 with the cognitive science expert, and an ∝Cronbach = 0.979 between experts.
ISA Questionnaire
We employed the Instantaneous Self-Assessment (ISA) Likert scale to assess subjective mental workload (MWL) on a scale from 1 to 7 (Tattersall & Foord, 1996). Participants verbally provided ISA ratings every 2 minutes.
Procedure
Participants first read an instructional manual on using the ATC-LabAdvanced simulator. The instructions covered fundamental ATC concepts, including sector definition, aircraft separation, flight plans, and simulator-specific representations such as color codes. The second part of the manual detailed the simulator’s operations, including keyboard-based controls for adjusting aircraft speed and altitude, handoffs, predictions, etc. Participants were informed of the primary objectives: (a) maintaining separation standards and (b) ensuring aircraft exited the sector according to their flight plan. They were also informed that the researcher would simulate a call and ask them three yes-or-no probes. They were instructed to prioritize ATC tasks over answering the call. Participants were informed that they had to answer as best they could in the shortest time possible. They did not have to justify their answers, nor did they receive any feedback.
Participants completed a training scenario under the researcher’s guidance, learning to modify aircraft speed and altitude to avoid conflicts. They practiced using simulator tools, including the ruler (in nmi) and trajectory predictions. They were also trained to detect and anticipate potential conflicts and transfer aircraft. At the conclusion of training, participants completed a simulated call, answering three probes corresponding to the SA levels (perception, comprehension, and projection). A total of six people (not included in the sample of 50 participants) did not ultimately perform the experiment because they could not perform the basic operations with the ATC simulator and complete the training scenario.
After training, participants completed the first experimental scenario. The researcher monitored their actions via a duplicated screen. Every 2 minutes, the researcher simulated a call, asked three probes based on the participant’s SA level group, and recorded the responses (correct or incorrect). The first scenario lasted 16 minutes, followed by a five-minute break. Participants then completed a second 16-min scenario, during which all received the complete questionnaire. No feedback was provided. To ensure accuracy, the session was audio recorded, and response times were measured using a stopwatch. Response time was measured as the difference in seconds from the end of the probe to the start of the response. The entire experiment lasted 90 minutes.
Design
The independent variables were as follows: (a) Scenario (within-subject factor, two levels: the original scenario and the rotated/flipped scenario). It is important to highlight that both the first and second scenarios were compared in a previous study. Results showed non-significant differences between them in performance, as well as in MWL estimations. (b) SA level groups (between-subject factor, five levels: Control, Perception, Comprehension, Projection, and Complete). For the first scenario, participants were assigned to one of the SA level groups. Every 2 minutes, they received a call and answered three probes corresponding to their assigned group (except the Control group). For the second scenario, all participants answered the complete questionnaire covering all SA levels. Therefore, we recorded the Minute of the simulation (within-subjects, seven levels from minute 2 to 14 in 2-min intervals) and the Order of the probes (within-subjects, three levels, 1, 2 or 3) to include them as covariates in the analysis.
The dependent variables were categorized into three groups: (a) SA questionnaire performance (response time to answer the call, response time to answer each probe, and the accuracy of responses); (b) Scenario performance (number of conflicts, number of potential conflicts, number of altitude and speed interventions and MWL estimation). A conflict between aircraft was defined as 5 nmi of lateral separation and 1000 ft of vertical separation. A potential conflict was defined as aircraft separation below 10 nmi and 2000 ft.
Data Preprocessing and Statistical Analysis
The ATC-LabAdvance simulator generated a.log file documenting all scenario events with timestamps. A custom Python routine parsed the.log file to extract scenario performance variables. Logged data included the number of speed and altitude interventions, as well as conflict and potential conflict occurrences. Audio recordings were used to measure response times to calls and probes via stopwatch. Answer accuracy and ISA scores were manually recorded by the researcher.
The analyses focused on two performance categories: questionnaire performance and scenario performance. For the questionnaire performance variables, the Control group was excluded from the analysis, as these participants were not exposed to the SA questionnaire until the second scenario. Mixed-effects models were conducted for each dependent variable using R. Model residuals were inspected, and appropriate transformations were applied when any of the DHARMa assumptions were violated (uniformity, dispersion, outliers and/or zero-inflation tests). Finally, we performed Pearson correlation analyses among the dependent variables to assess potential associations between questionnaire and scenario performance measures. Statistical significance was set at α = .05.
Results
Questionnaire Performance
Response Time to Answer the Call
Model Fits Statistics of Each Dependent Variable.
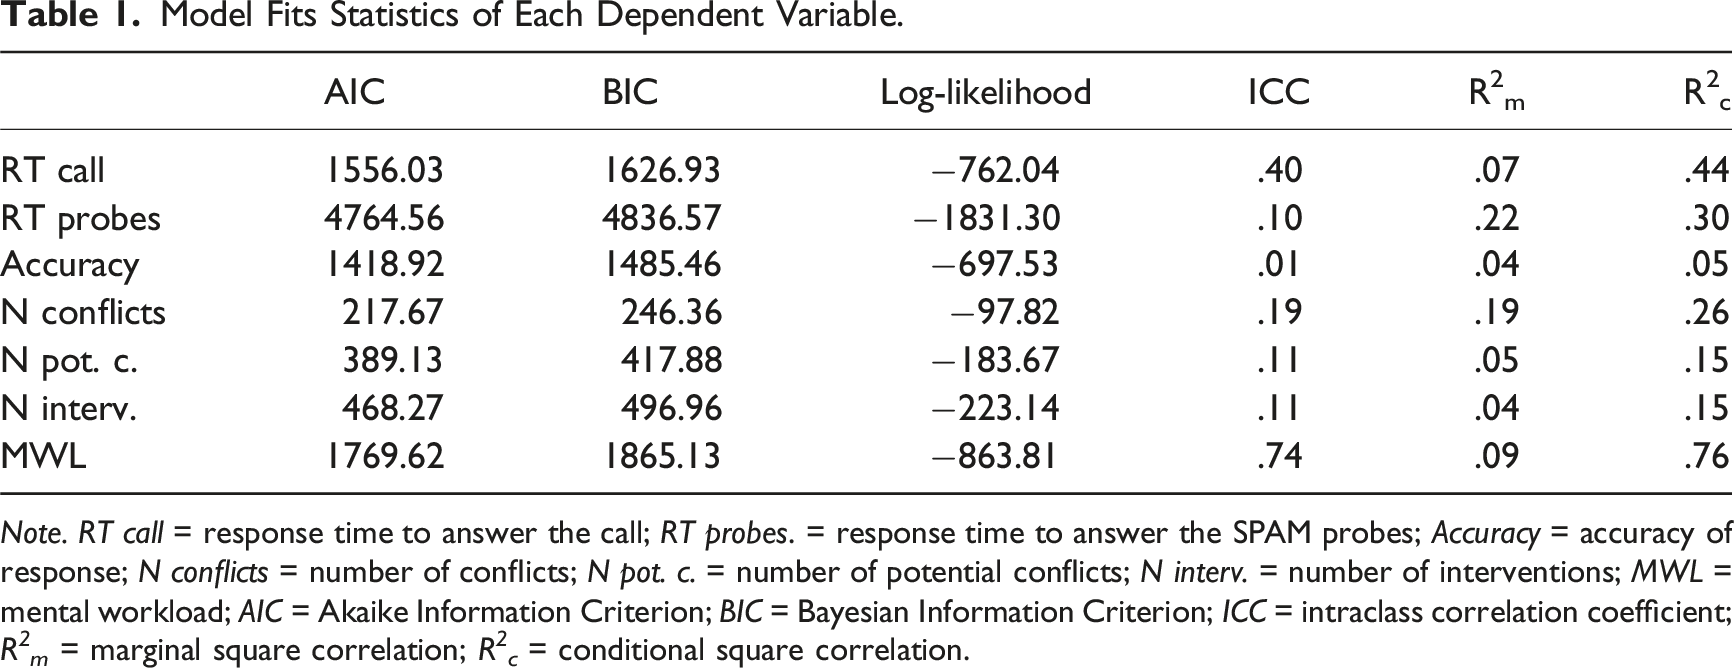
Note. RT call = response time to answer the call; RT probes. = response time to answer the SPAM probes; Accuracy = accuracy of response; N conflicts = number of conflicts; N pot. c. = number of potential conflicts; N interv. = number of interventions; MWL = mental workload; AIC = Akaike Information Criterion; BIC = Bayesian Information Criterion; ICC = intraclass correlation coefficient; R 2 m = marginal square correlation; R 2 c = conditional square correlation.
Omnibus Test for Each Dependent Variable.
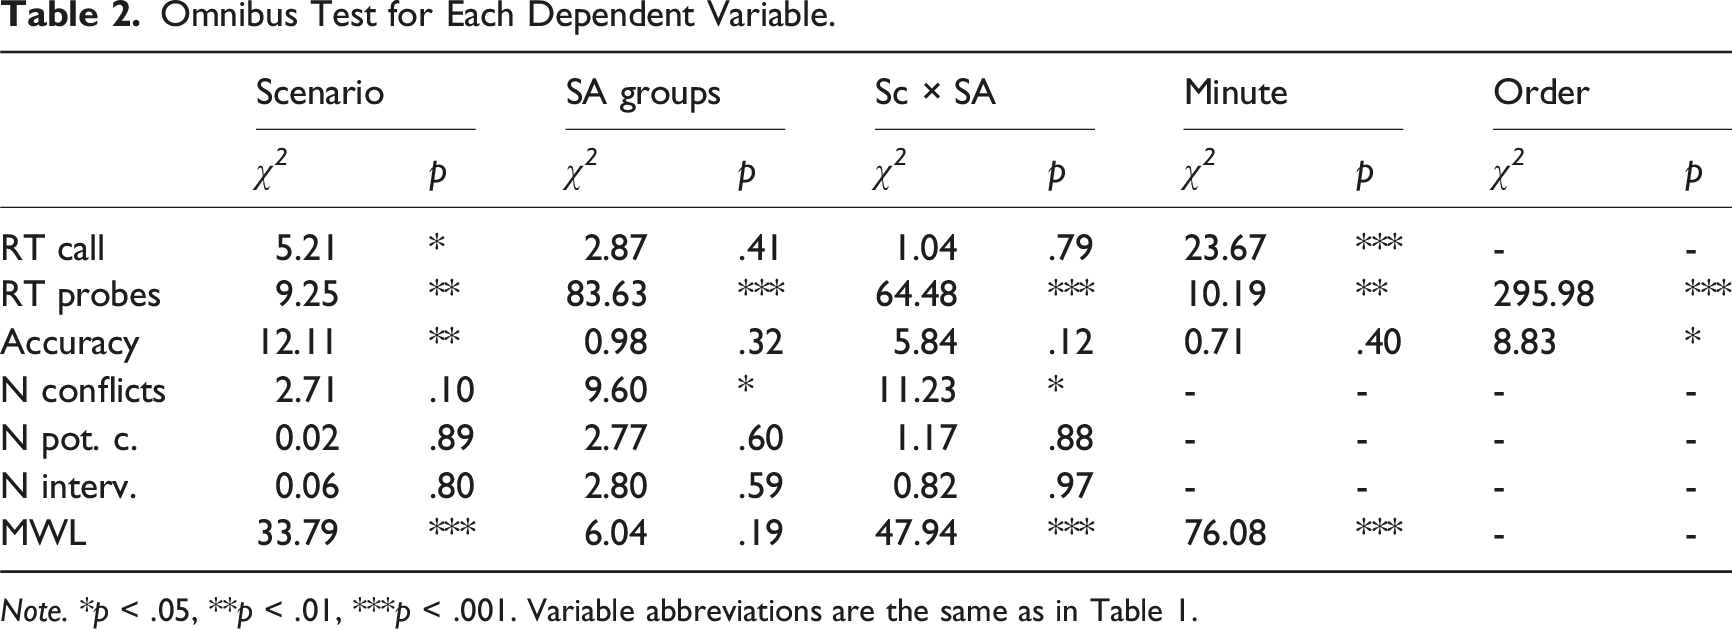
Note. *p < .05, **p < .01, ***p < .001. Variable abbreviations are the same as in Table 1.
Summary of the Mean and Standard Deviation of Each Dependent Variable Across Scenario and SA Level Groups.
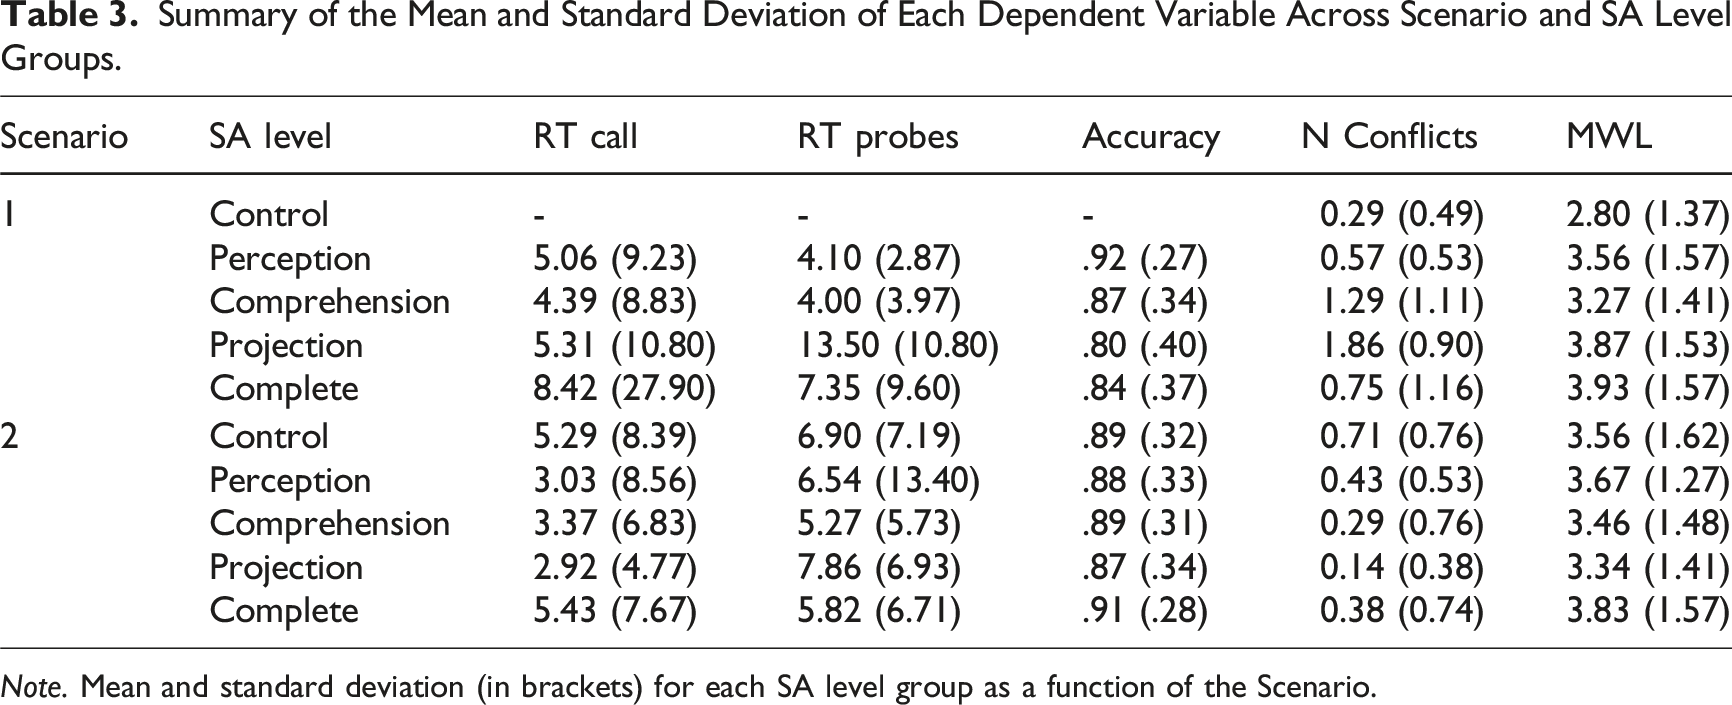
Note. Mean and standard deviation (in brackets) for each SA level group as a function of the Scenario.
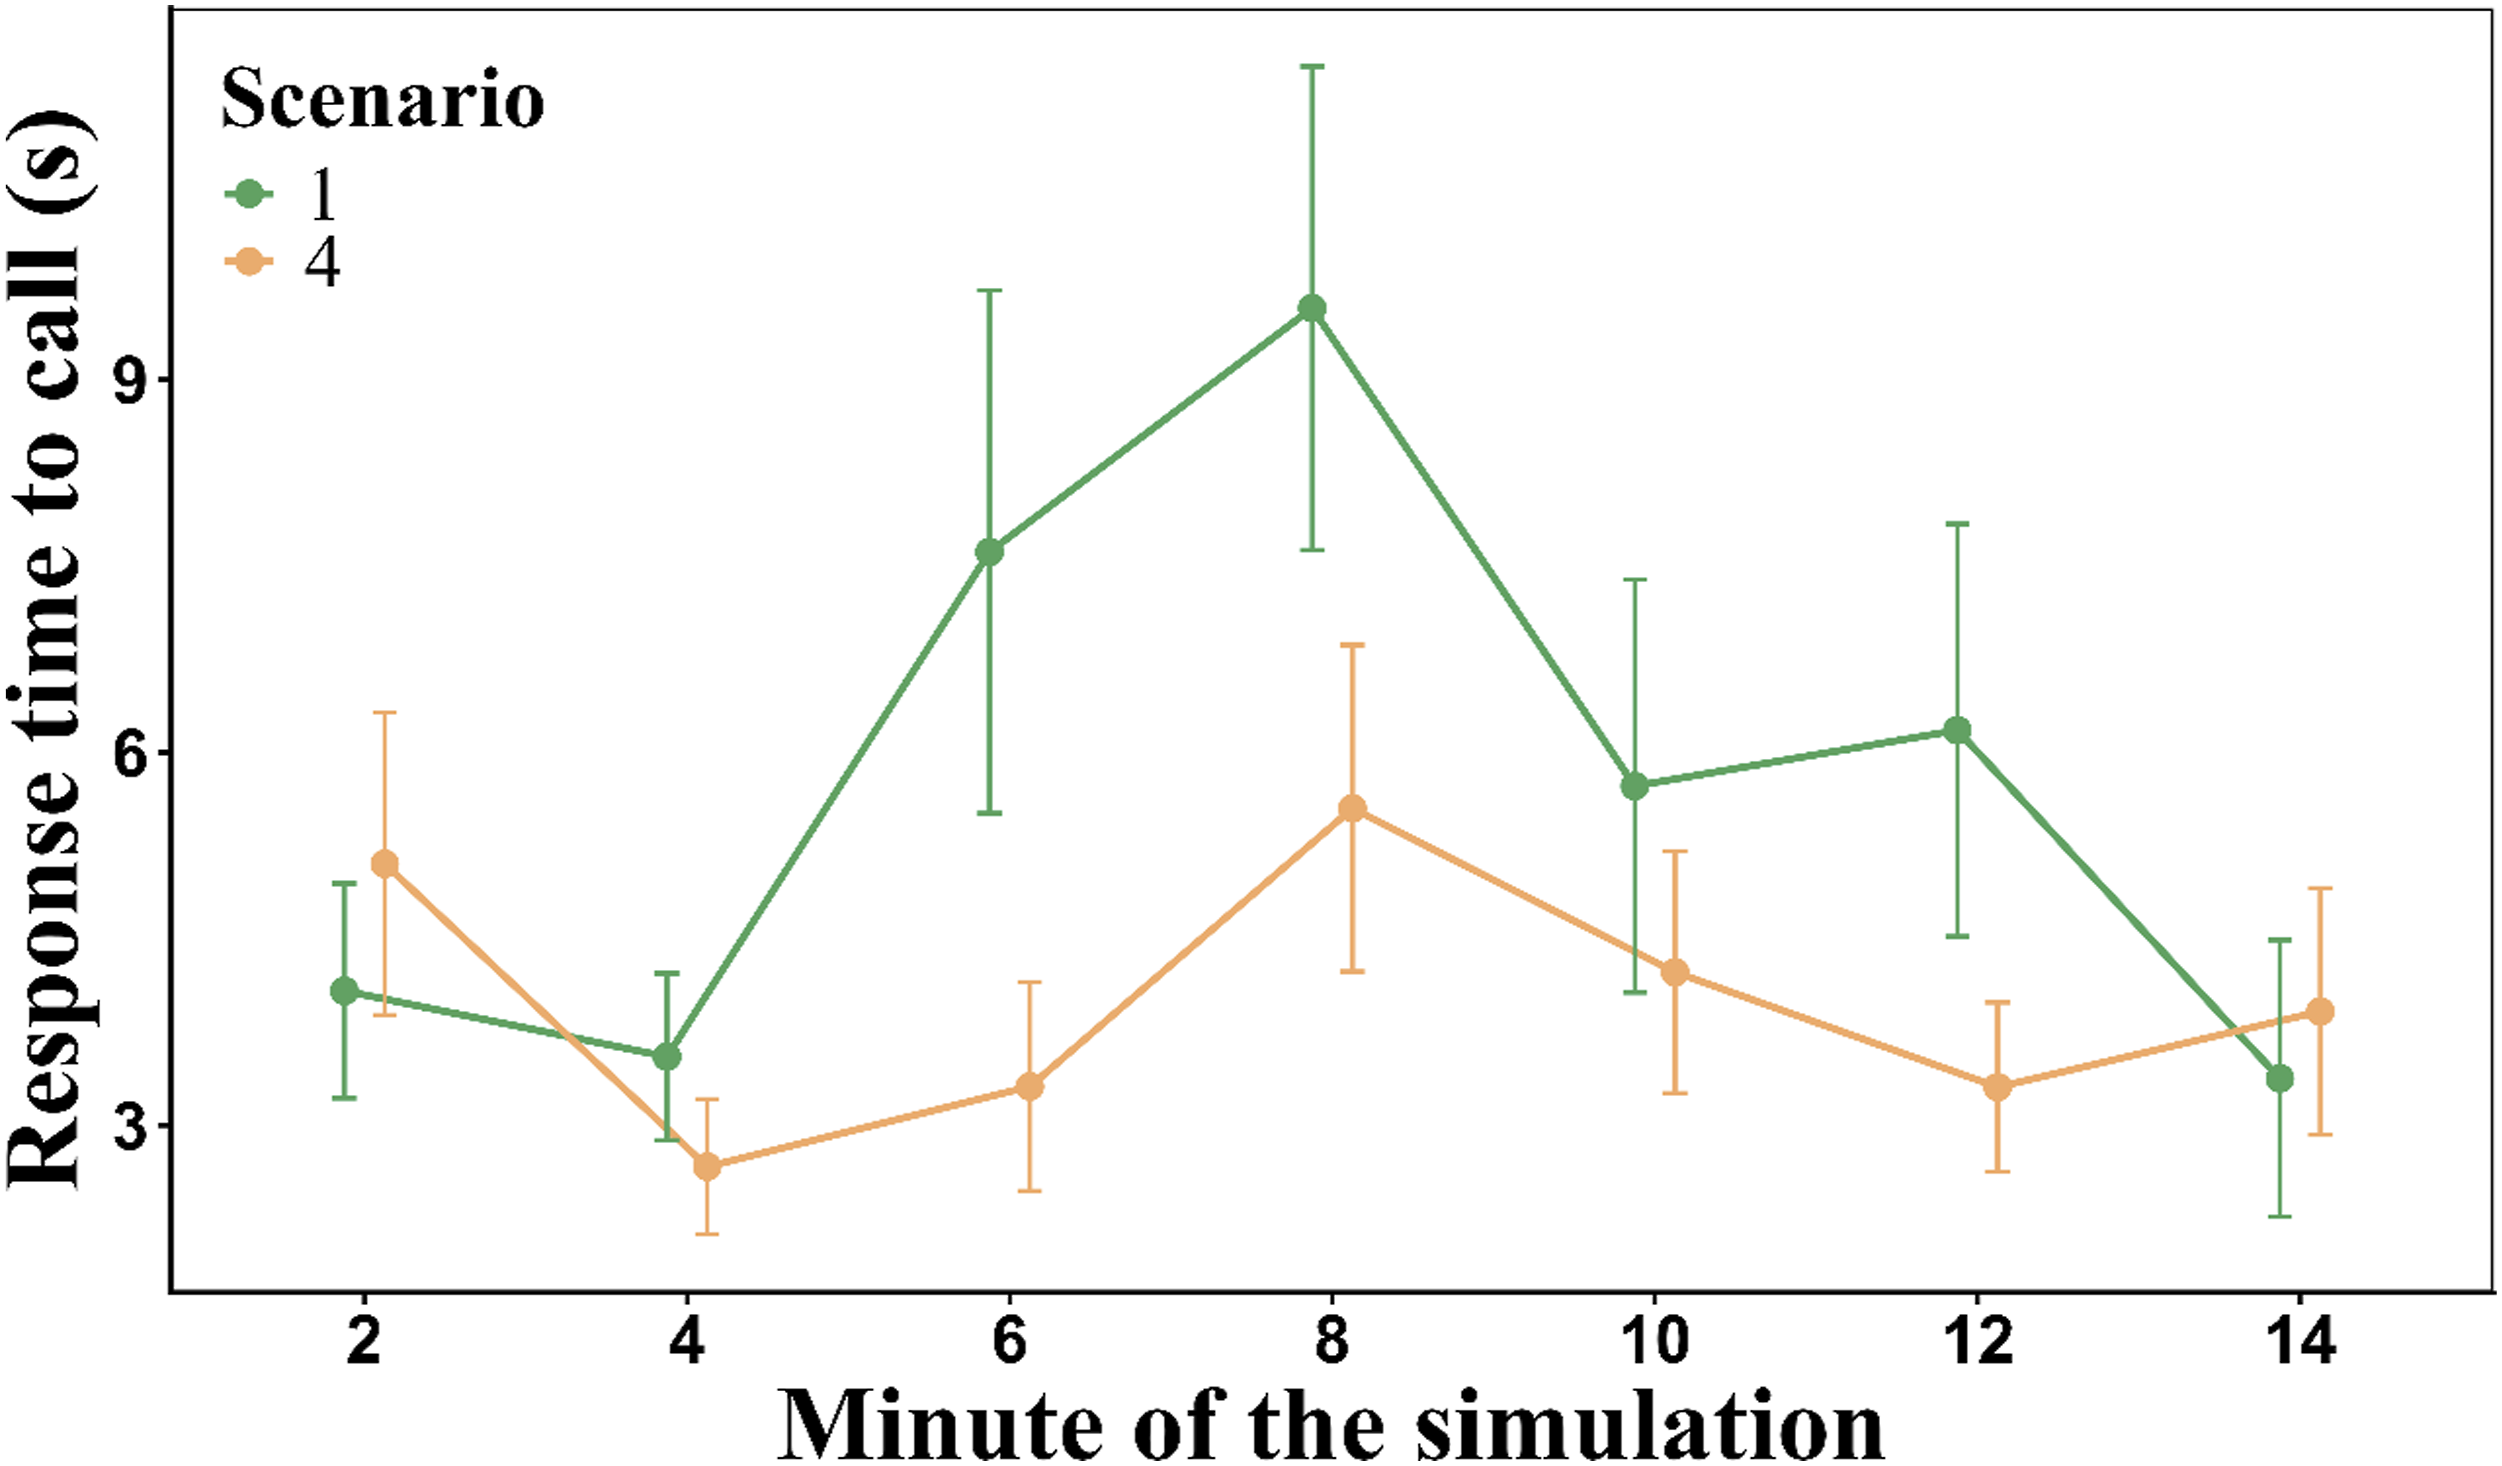
Response time to the call as a function of Minute of simulation and Scenario. Note. Mean response time (RT) to the call across the minutes of the simulation and depending on the Scenario. Error bars represent the SEM. Participants answered the question faster in the second scenario than in the first one. There was a peak of required time to answer the call in the eighth minute of the simulation for both scenarios.
Matrix of Correlations (Pearson) Between Questionnaire and Scenario Dependent Variables.
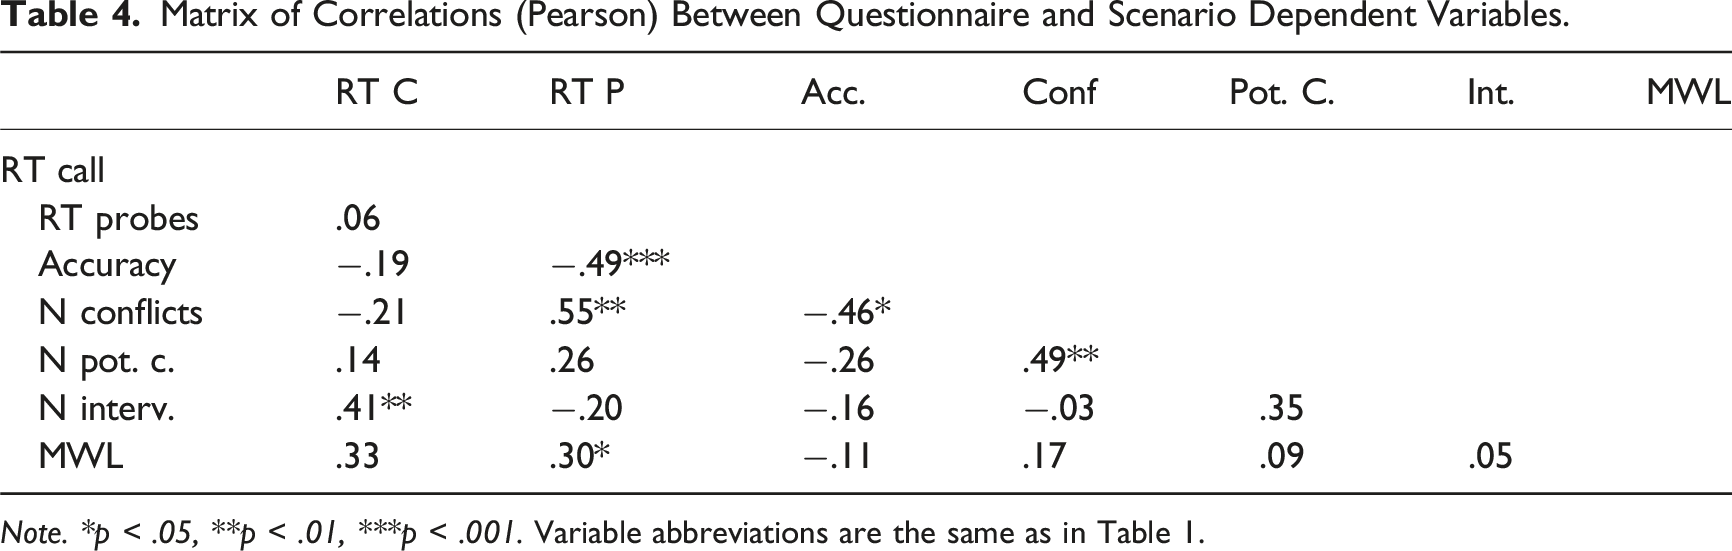
Note. *p < .05, **p < .01, ***p < .001. Variable abbreviations are the same as in Table 1.
Response Time to Answer the Probes
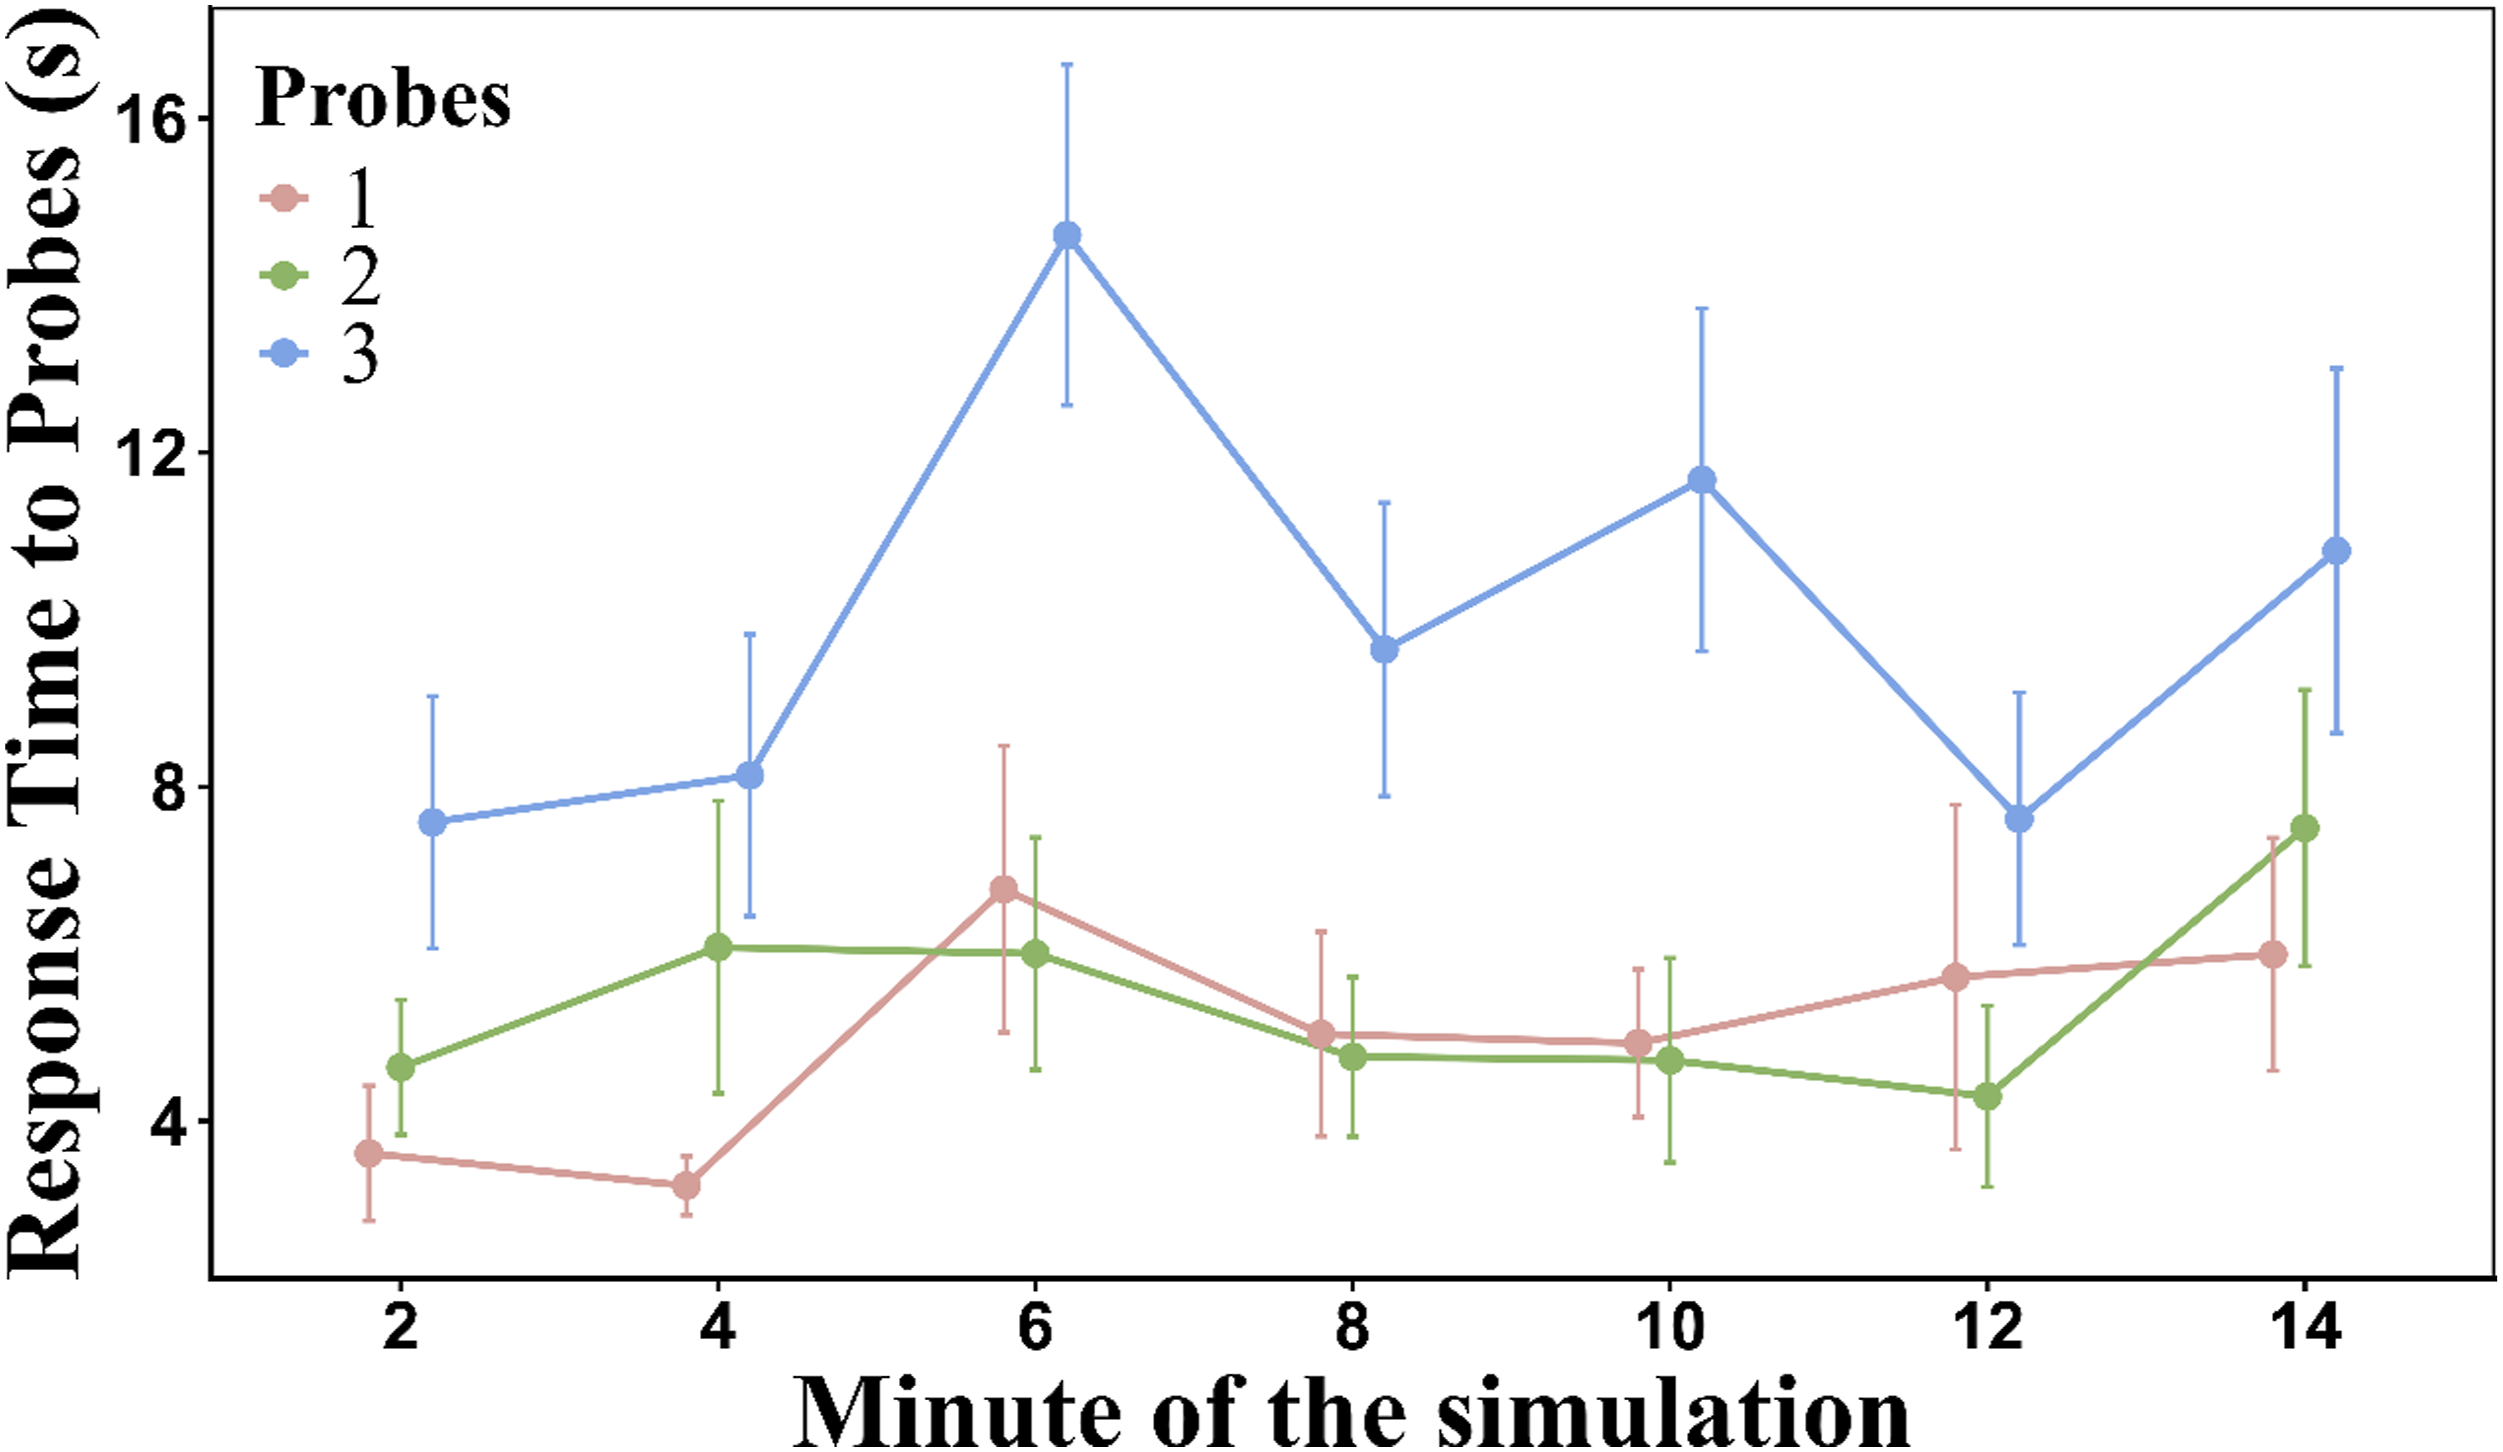
A linear mixed-effects model was fitted on the normalized response times (“bestNormalize” transformation). The Scenario and the SA level groups (Control not included) were assigned as fixed effects. The Minute of the simulation and the Order of the probes were covariate variables. We included the Participant as a random intercept. Only one outlier (>70 s) was removed after reviewing the residuals (0.05% of the data). Model fit statistics can be seen in Table 1. Model explanatory power was moderate for fixed effects with a modest increment after including random effects. The fixed factors and their interaction were significant (Table 2). As can be seen in Figure 3, the Perception (p < .01) and Comprehension (p < .01) groups increased significantly their response time in the second scenario compared to the first scenario, while the Projection (p < .001) and the Complete (p < .05) group significantly reduced their response time to probes in the second scenario. On the other hand, in the first scenario, the Projection group differed significantly from the rest of the groups (p < .001), but in the second scenario the Projection group only differed significantly from the Comprehension and Complete groups (p < .001). The overall response time to answer each probe was 6.81 s (SD = 6.80) (see Table 3). The covariate Minute of the simulation was significant (p < .01). The changes in the response time to probes as a function of the Minute of the simulation were not symmetrical. There were some time windows which produced larger response time than others. The Order of the probes was highly significant (p < .001). As can be seen in Figure 4, the third probe took significantly more time to be answered than the other probes. Table 4 showed that the response time to answer the probes was significantly and positively correlated with the MWL, the number of conflicts and response accuracy. Response time to probes of the SPAM as a function of the SA level groups and the two Scenarios. Note. Boxplots show response times to probes (in seconds) across SA level groups for both scenarios. Boxes represent the interquartile range with median lines, and whiskers indicate variability outside the upper and lower quartiles. Individual points represent participant data. Asterisks denote significant differences (*p < .05, **p < .01, ***p < .001). Response times were significantly higher in the first scenario across all SA level groups except Control. Within the first scenario, Projection differed significantly from all other groups, while in the second scenario, Projection was significantly different from Comprehension and Complete groups. Response time to answer each probe as a function of the Order of the question and the Minute of the simulation. Note. Required mean time to answer the SPAM probes as a function of the Minute of the simulation and the Order of the probes. Error bars represent the SEM. The third probe took significantly more time to be answered than the other probes. Additionally, there was a peak of required time to answer the probe in minute 6 of the simulation.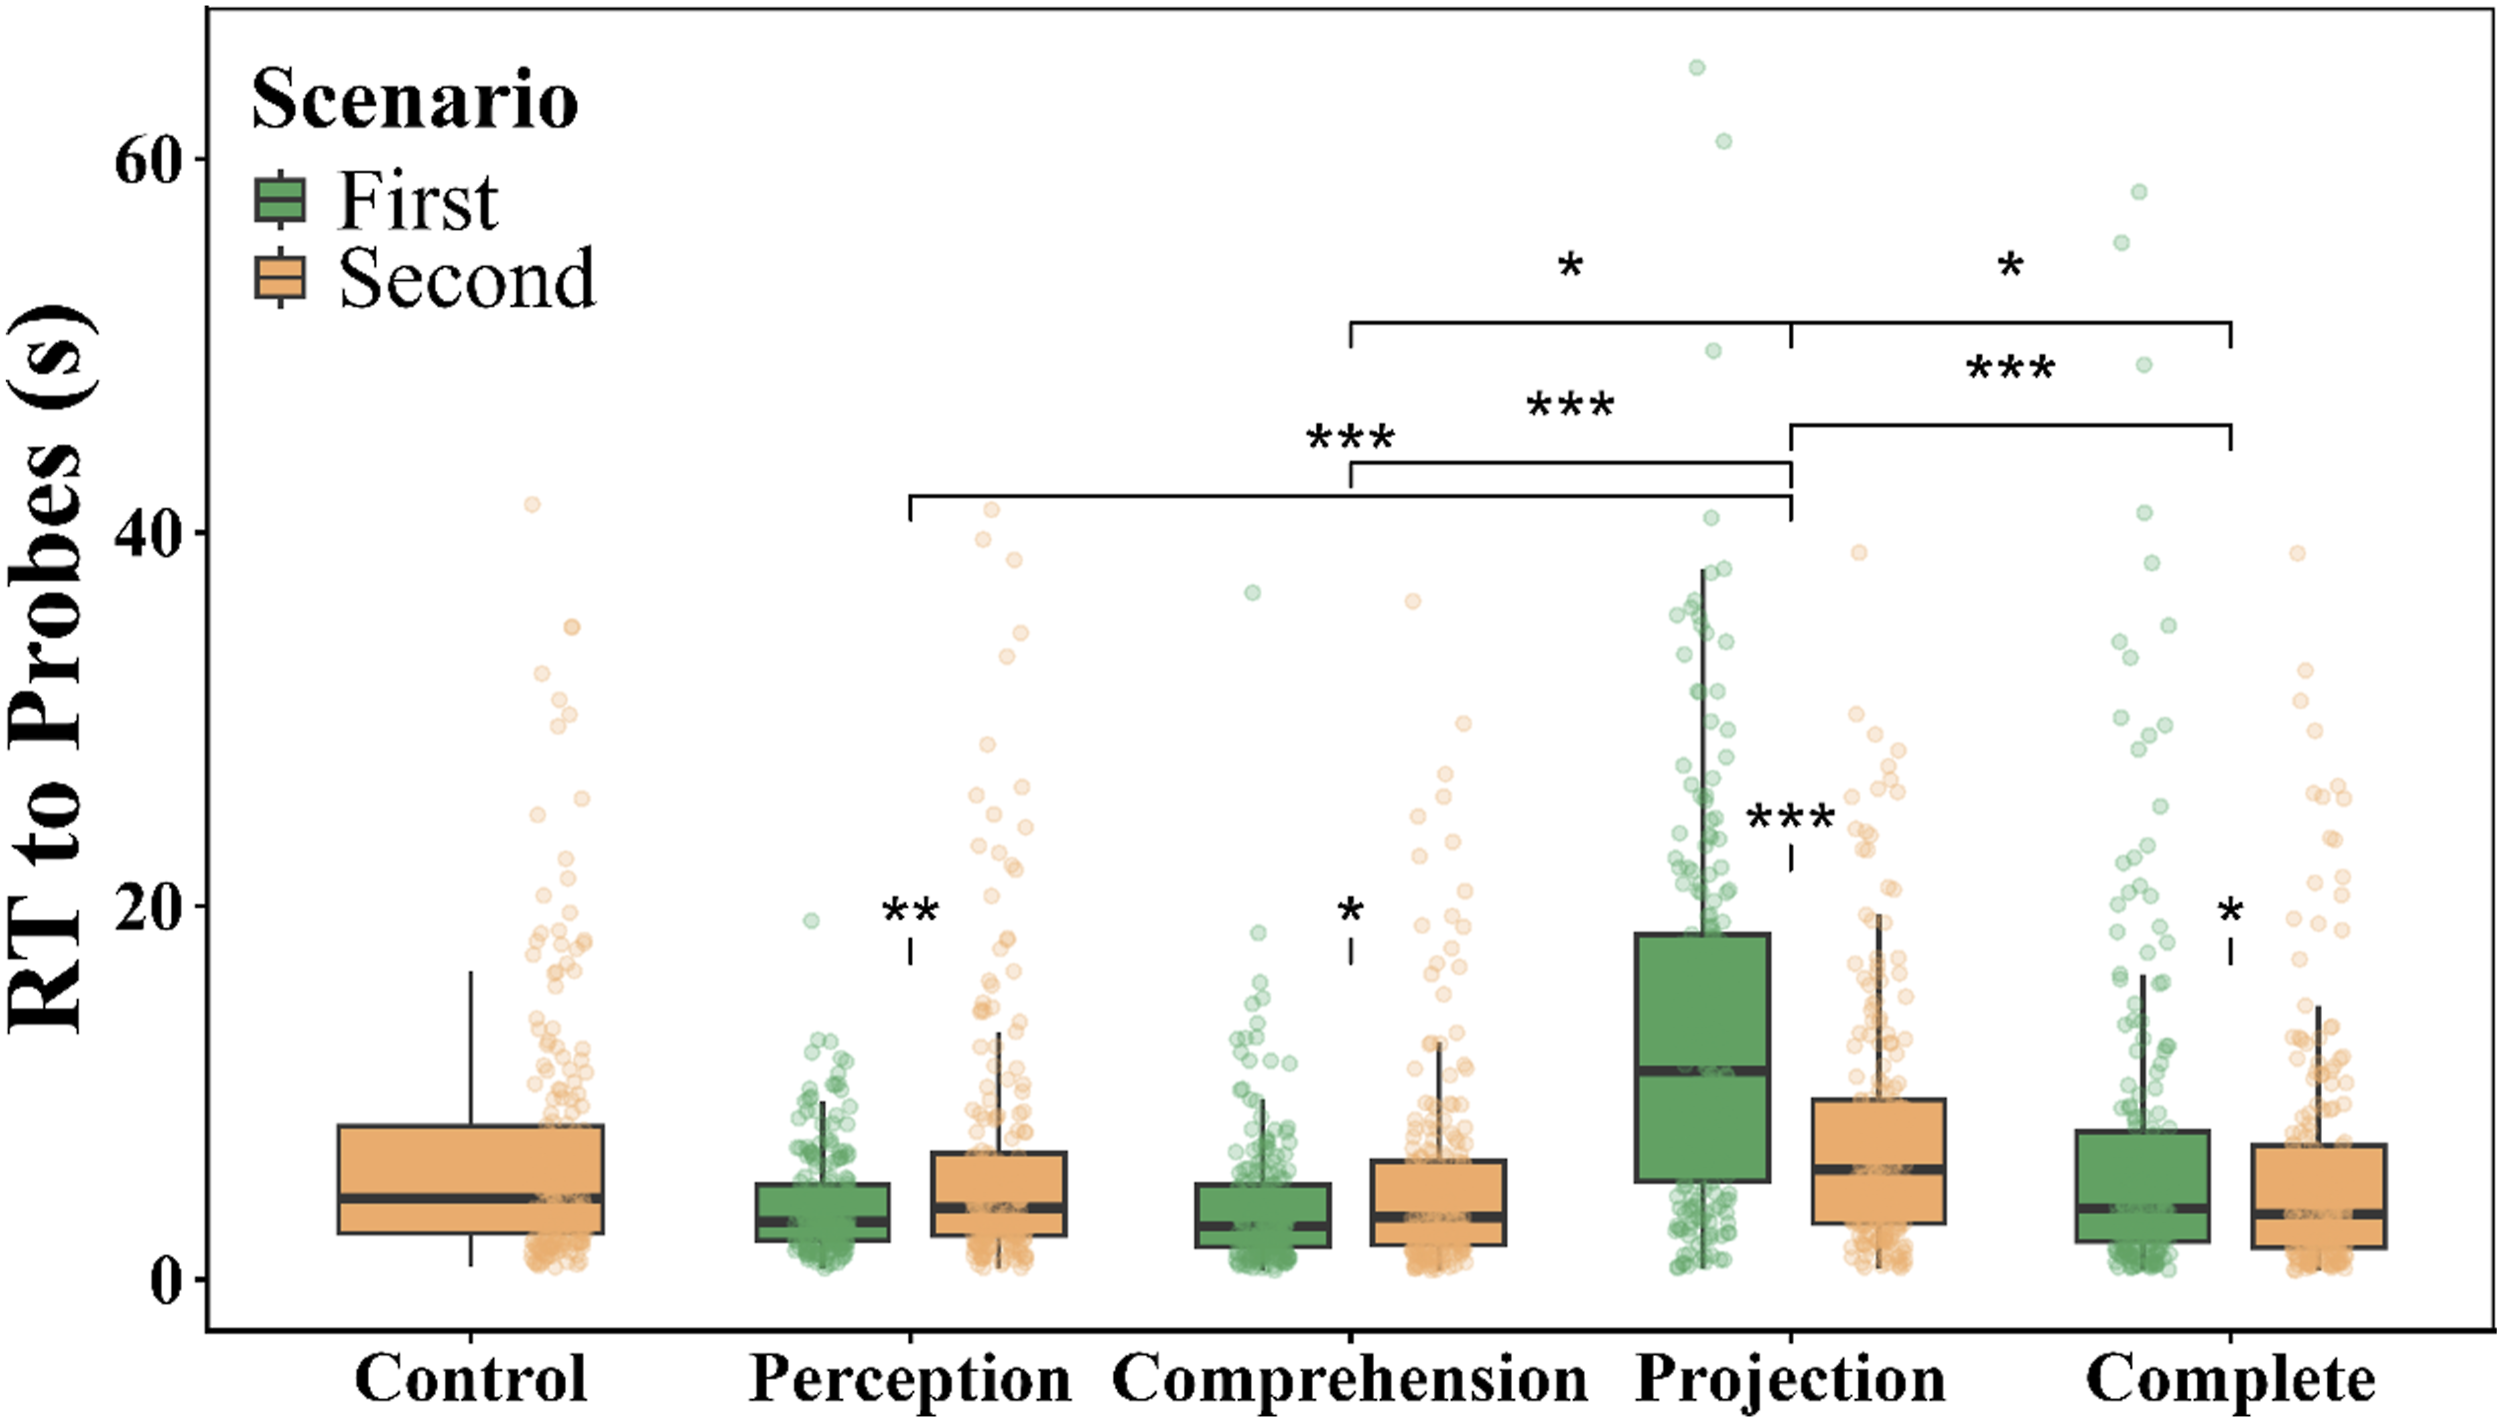
Accuracy of Responses
We modeled correctness of the response (0/1) using a mixed-effects logistic regression (logit link). The Scenario and the SA level groups (without the Control group) were considered as fixed effects. The Minute of the simulation and the Order of the probes were included as covariates variables. The participants were included as a random intercept. The amount of variance explained by the fixed effects was very small and the inclusion of random effects were negligible (Table 1). Only the Scenario showed a main effect (p < .01) (Table 2). Participants responded with greater accuracy to perception probes than to projection probes. The overall accuracy was 0.87 (SD = 0.33) (see Table 3). The effect of Order of the probes was significant (p = .01). The first probe (M = .89, SD = 0.09) received a significantly (p < .05) more accurate response than the third one (M = .84, SD = 0.10). The second probe (M = .88, SD = 0.11), did not differ significantly from the other two probes. The accuracy of responses was significantly and negatively correlated with the response time to answer probes, and significantly and negatively correlated with the number of conflicts (Table 4).
Scenario Performance
Number of Conflicts
We modeled the count of conflicts using a generalized linear mixed model (Poisson distribution, log link) with a random intercept for Participant. The fixed factors were Scenario and SA level groups (including the Control group). No covariables were included. Model fit statistics showed that the fixed effect accounted for modest explanation of the variance (Table 1). However, there was a non-negligible proportion of variance explained by the random effects. As can be seen in Table 2, the SA level groups (p < .05) and the interaction with Scenario (p < .05) were significant (Figure 5). The post-hoc comparisons (see Table 3) revealed that participants in the Comprehension group produced significantly more conflicts in Scenario 1 than in Scenario 2 (p < .05). Likewise, participants in the Projection group produced more conflicts in Scenario 1 than in Scenario 2 (p < .01). As can be seen in Table 4, the number of conflicts showed a significant and positive correlation with the number of potential conflicts and response time to answer the probes. The response accuracy was significantly and negatively correlated with the number of conflicts. Number of conflicts as a function of the SA level groups and the two Scenarios. Note. Bar plot showing the mean number of conflicts across SA level conditions for both Scenarios. Error bars represent the SEM. Individual points indicate participant data. Asterisks denote significant differences between scenarios within each training condition (*p < .05, **p < .01). Specifically, the number of conflicts was significantly higher in the first scenario compared to the second for the Comprehension and Projection groups.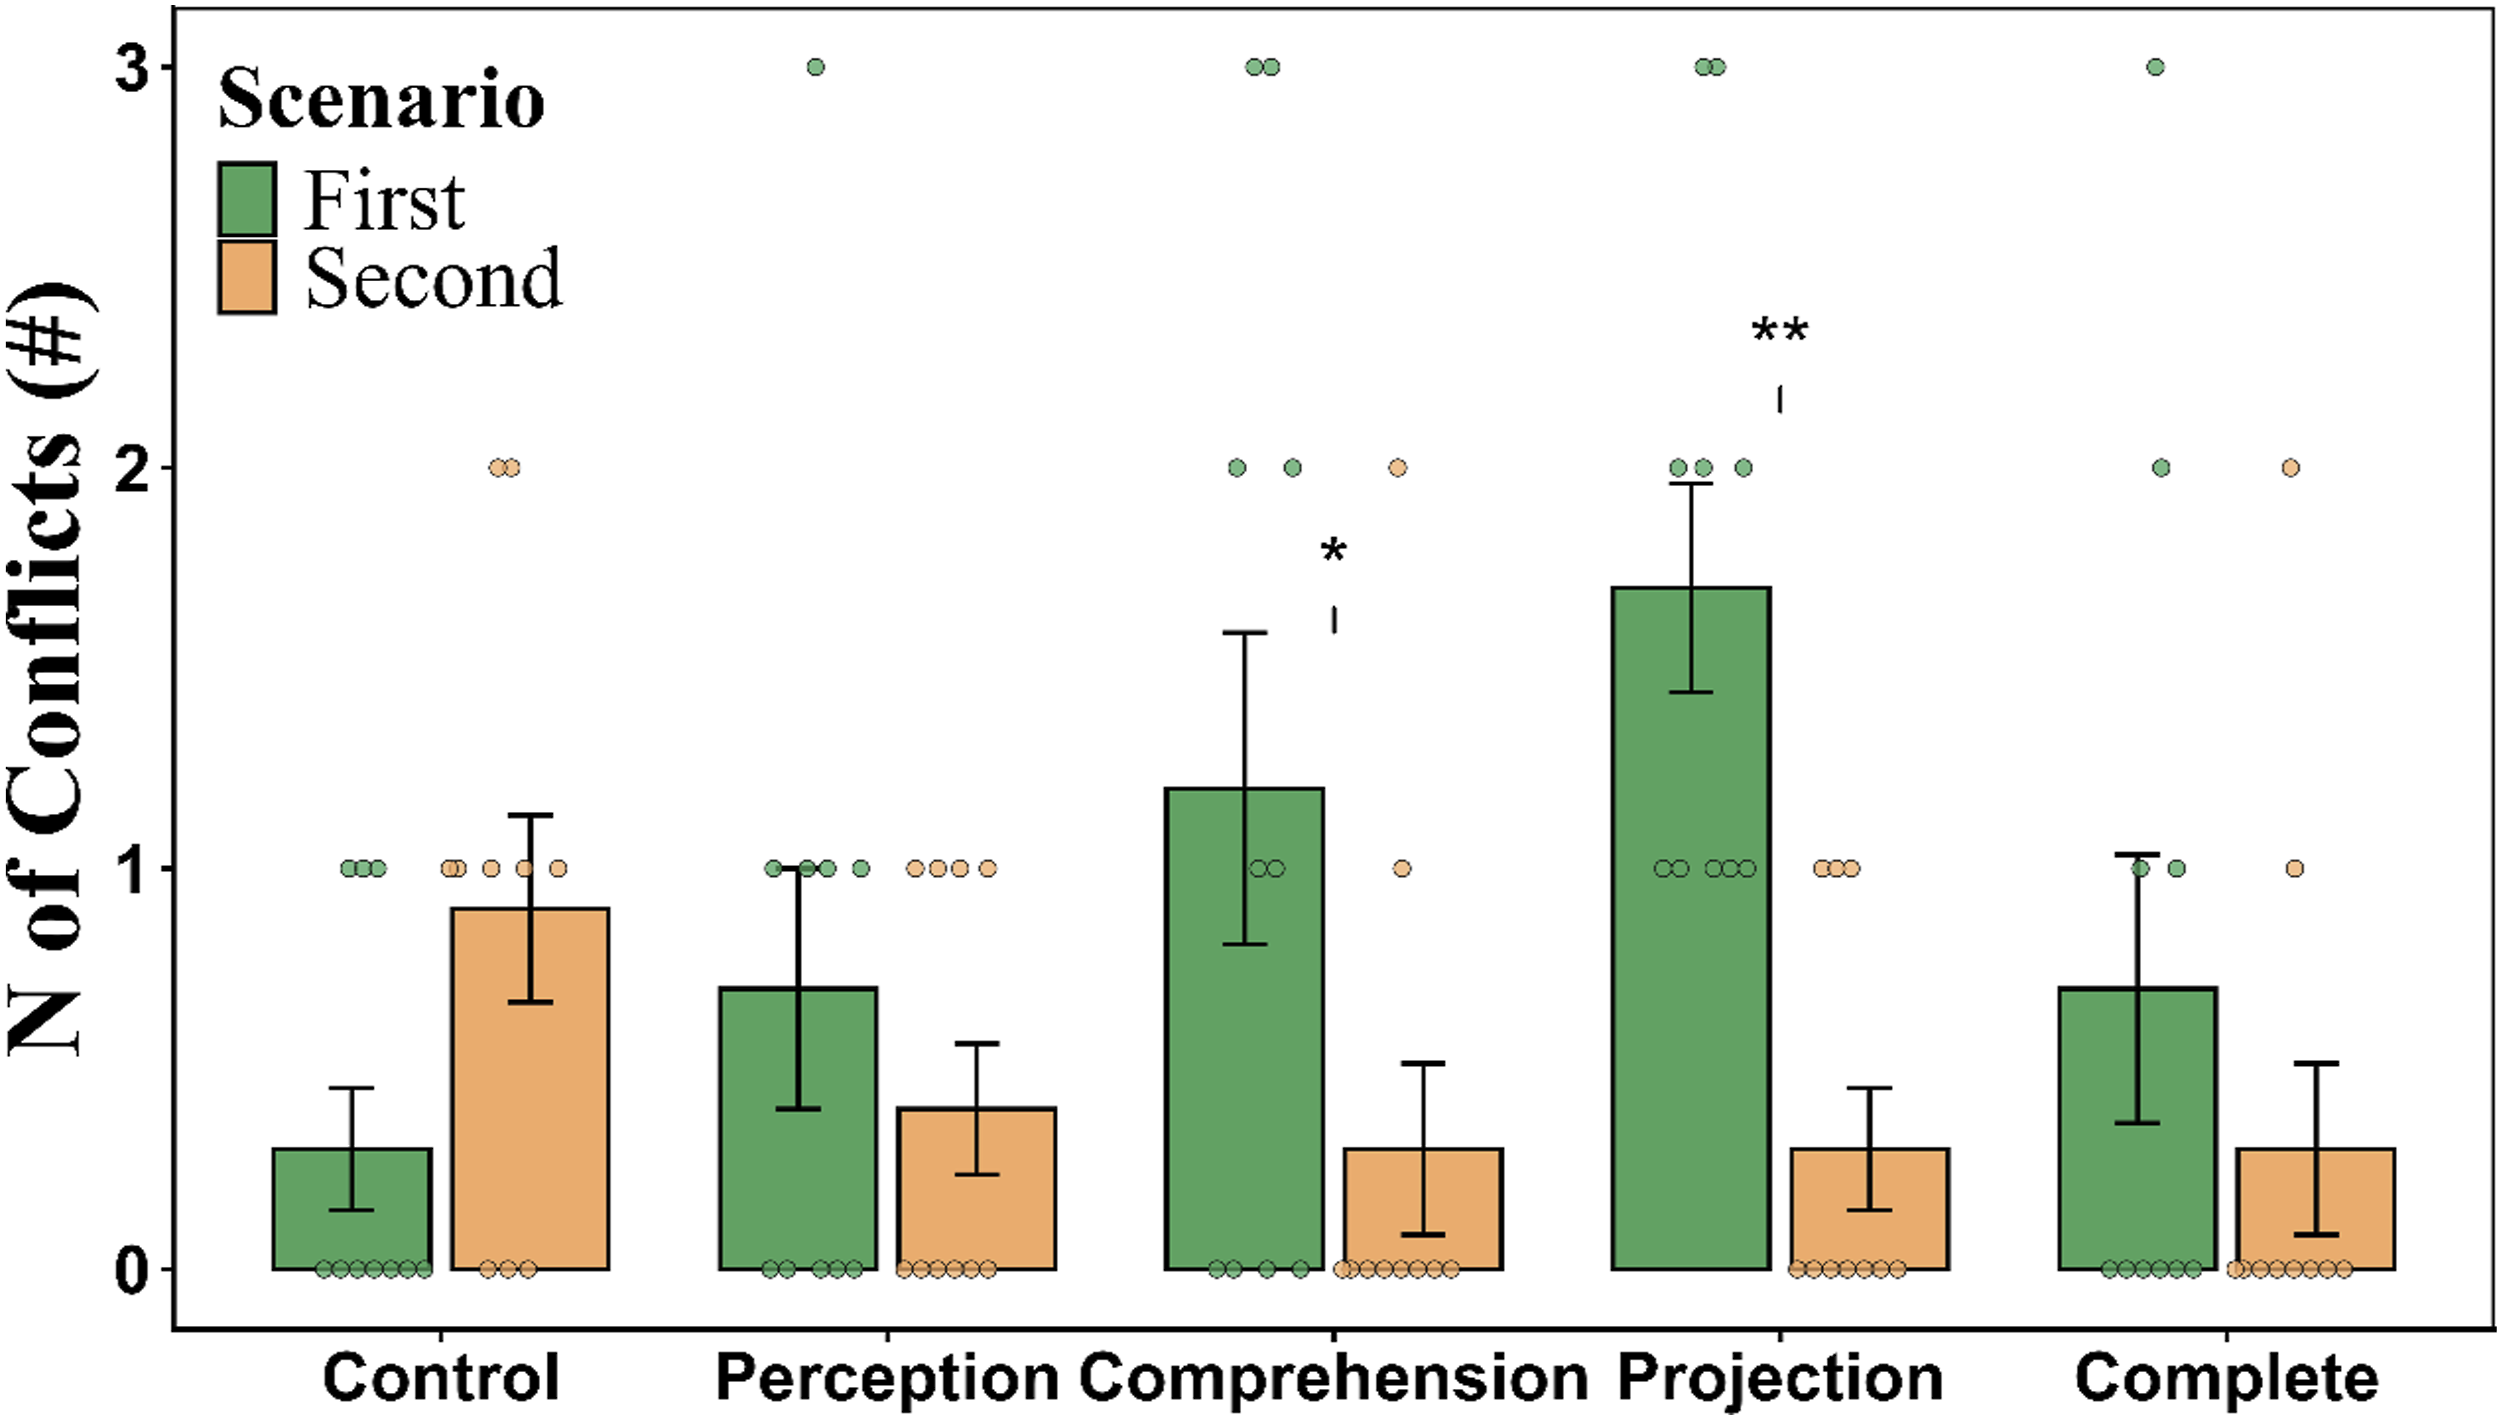
Number of Potential Conflicts
We modeled the same model as the number of conflicts but using the number of potential conflicts, instead. The fixed effects explained a very small portion of variance with a modest incrementation of explanatory power after including random effects (Table 1). None of the fixed effects showed a significant effect (Table 2). Overall, participants had 2.74 potential conflicts (SD = 1.16). The number of potential conflicts was only significantly and positively correlated with the number of conflicts (Table 4).
Number of Interventions
A generalized linear mixed model (Poisson family, log link) with a random intercept for Participant was used to model the number of interventions, with SA level group and Scenario included as fixed factors. The explanatory power by the fixed effects was very small. The random effects modestly increase this power (Table 1). None of the fixed effects were significant (Table 2). On average, participants performed 9.14 interventions (SD = 3.92). The number of interventions was only significantly and positively correlated with the response time to answer the probe (Table 4).
Mental Workload
Ordinal workload ratings (1–7 scale) were analyzed with a cumulative link mixed-effects model using a logit link and a random intercept for Participant. We used the SA level groups and the Scenario as a fixed effect. The Minute of the simulation was included as a covariate. The fixed predictors accounted for a modest portion of variance, but most of the variability in MWL is attributable to between-participant differences (Table 1). The Scenario showed a main effect (p < .001) (Table 2). Participant exhibited larger MWL in the second scenario (M = 3.56, SD = 1.47) than in the first scenario (M = 3.47, SD = 1.52). The interaction was highly significant (p < .001) (see Table 3). Basically, the Control group significantly (p < .001) increased the MWL from the first scenario without SPAM to the second scenario with SPAM. The opposite pattern happened to the Projection group (see Figure 6). We also found a strong effect of Minute of the simulation (p < .001). There was an incrementation of MWL as a function of the Minute of the simulation. Table 4 showed that the MWL was significantly and positively correlated with the response time to answer the call and response time to answer the probes. Mental workload as a function of the SA level groups and the two Scenarios. Note. Boxplots show the MWL across SA level conditions for both Scenarios. The Control group experienced significantly higher MWL in the first scenario compared to the second scenario (***p < .001). In contrast, the MWL was significantly lower in the second scenario than in the first scenario for the Projection group.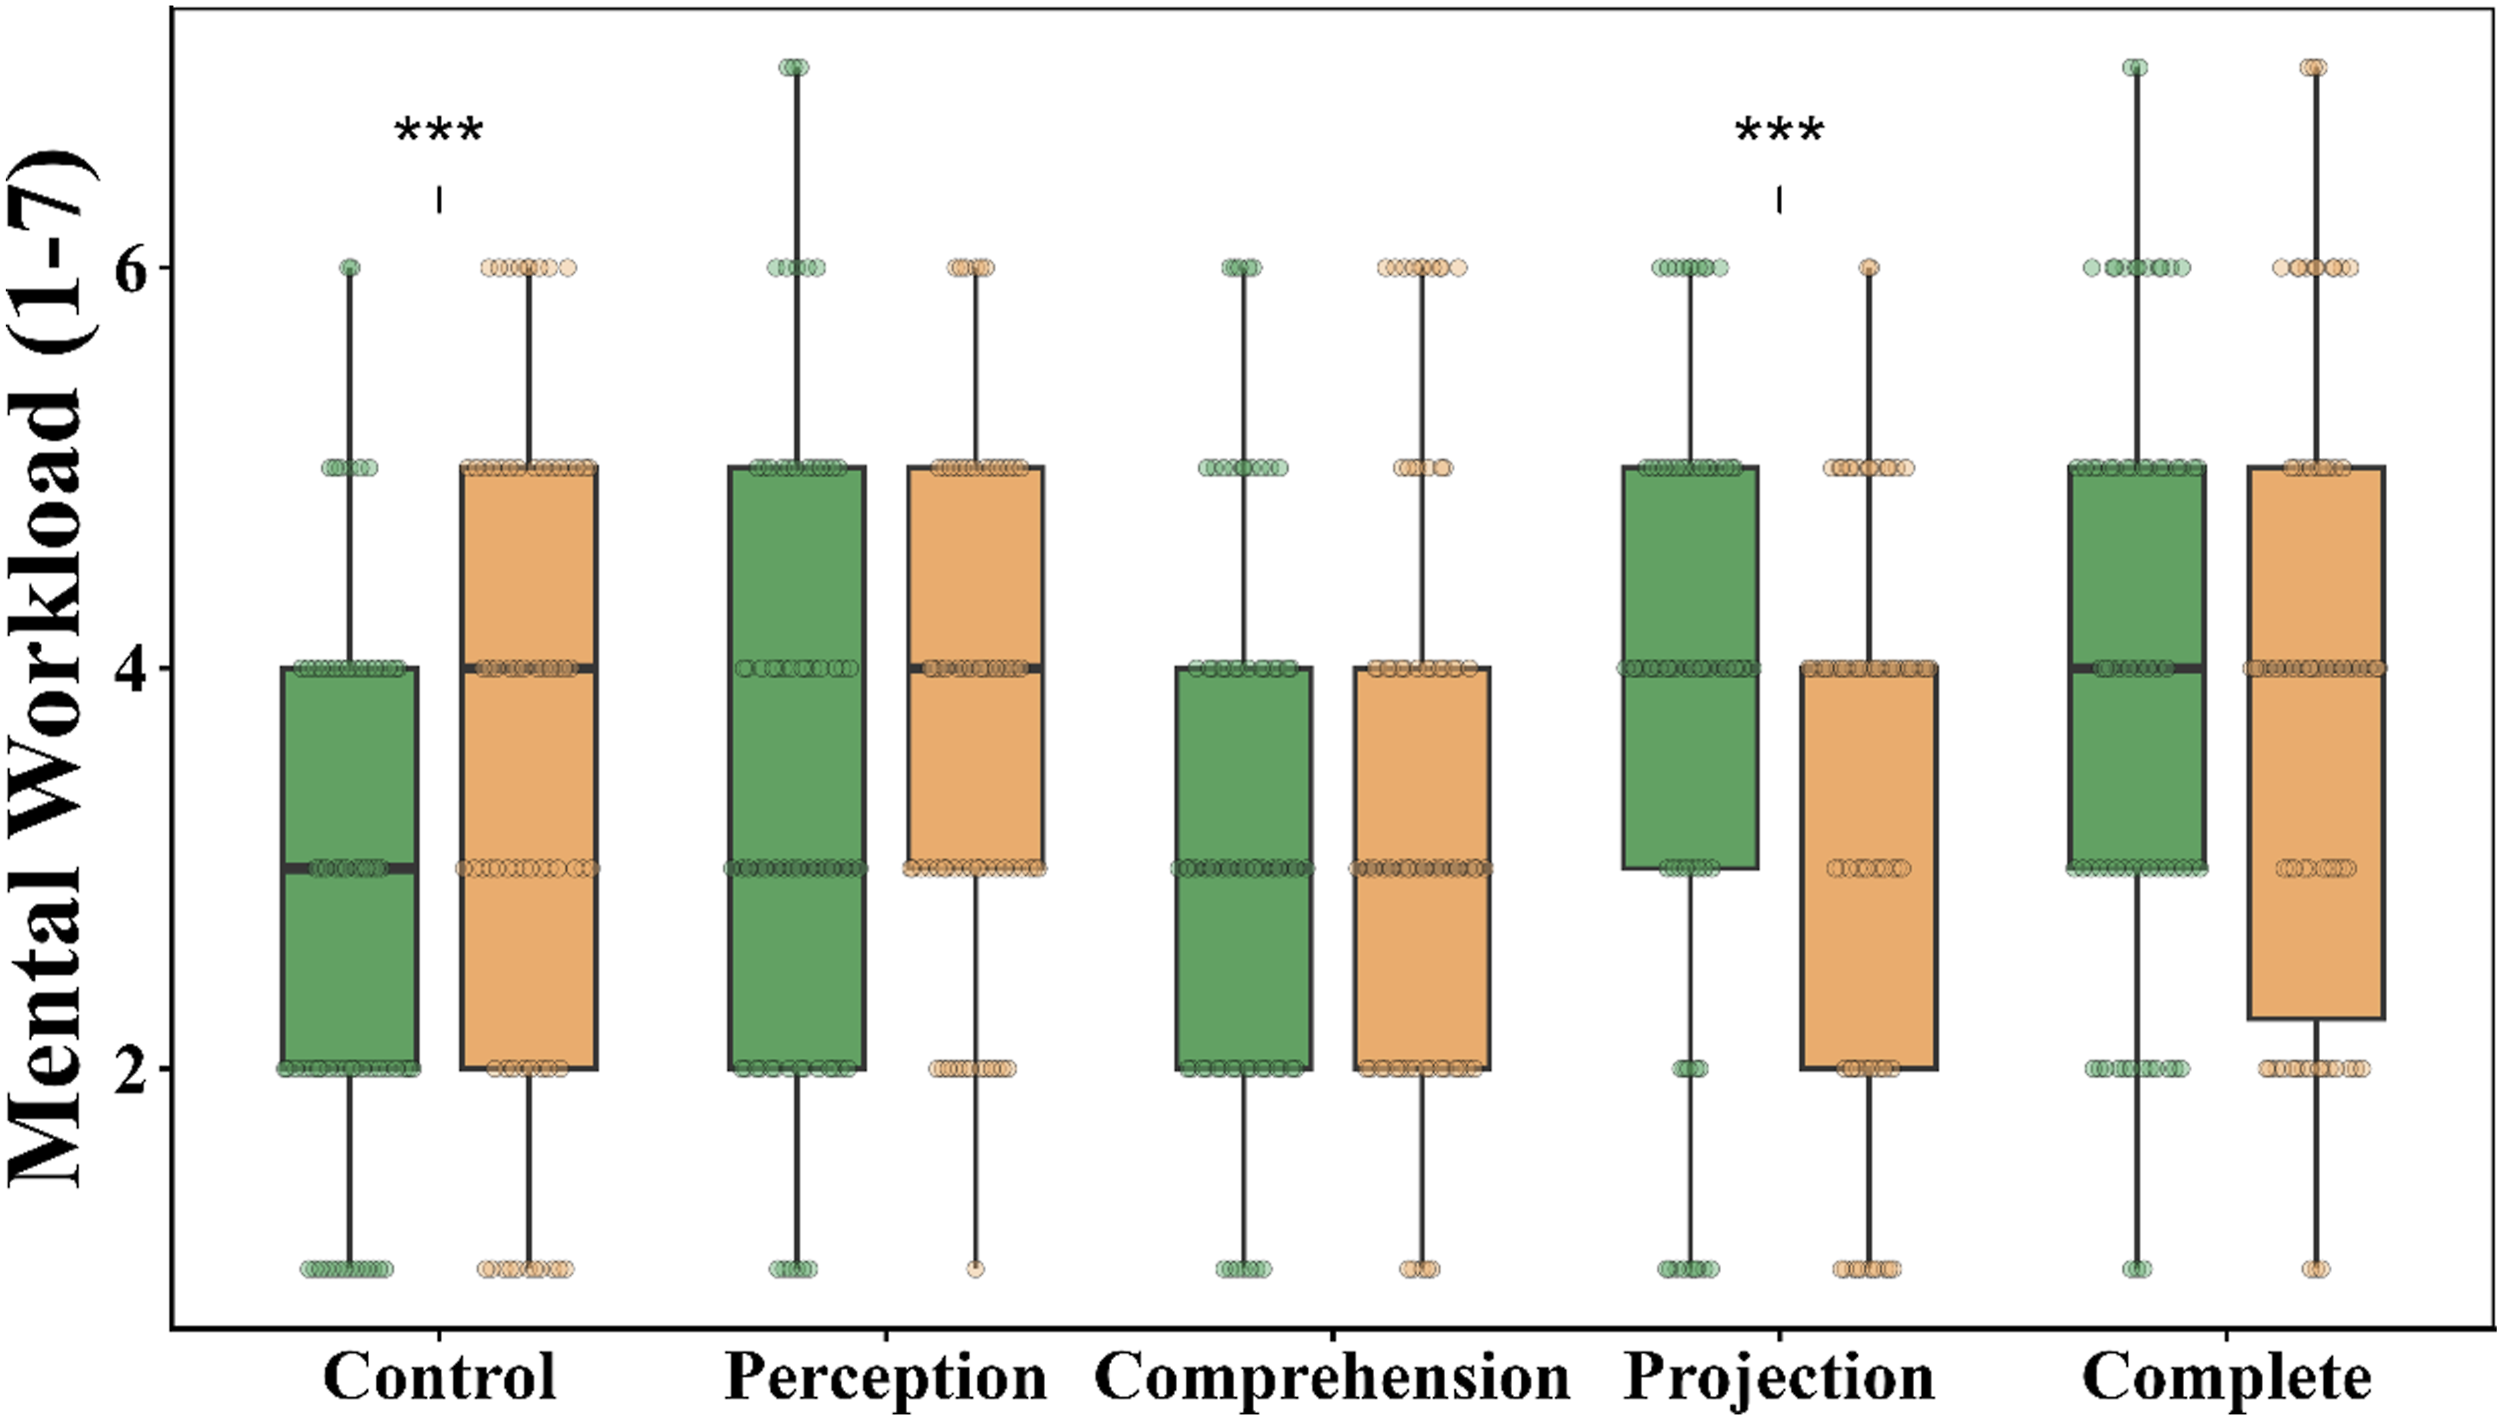
Discussion
This study aimed to test whether the exposure to SPAM probes at different levels of SA serves as a scaffold to the construction of SA for novice participants in the field. Previous research in SA has studied how certain attentional strategies can aid SA formation and called this a long-term working memory effect (Gonzalez & Wimisberg, 2007; Gutzwiller & Clegg, 2013; Sohn & Doane, 2004). Our objective is to determine the extent to which exposure to a real-time SA questionnaire via the SPAM method affects later SA formation and performance, given the attentional strategies used to answer the current probes. Additionally, we aimed to detect short-term dual-task interference in the ongoing SA probe scenario at different levels. This allows us to demonstrate consistency among different groups according to SA levels and as well as analyze the hierarchical structure of this cognitive construct.
To achieve these objectives, we developed a set of probes encompassing the three levels of SA: perceptual, comprehension, and projection. Participants were then assigned to different groups and exposed to these SA levels through a real-time SPAM questionnaire with the aim of observing how their task performance changed based on this exposure. Our findings align with existing literature on SPAM performance. On average, participants took 4.80 s to answer the call and 6.80 s to respond to each probe, with an overall accuracy rate of 87.50%. These results are comparable to those reported by Dao et al. (2011), in which experienced and active pilots took an average of 4.73 seconds to answer the call, 15.40 seconds to respond to each probe, and achieved 81% accuracy. Other studies have reported call response latencies ranging from 4 to 30 s regarding the SA level, with accuracy rates around 70–80% (see Dao et al., 2009; Durso et al., 1998; Loft et al., 2015, 2018; Trapsilawati et al., 2020).
Results of the first scenario showed that response time to each probe varied significantly as a function of the SA level. The complete questionnaire had an intermediate average response time, and the Projection group required the longest time to answer each probe. These results confirm that the questionnaire was able to access SA levels, as probes referring to the future of the scenario require a higher SA, as well as additional calculations and/or verifications (see Dao et al., 2009; Durso et al., 1998). This pattern of results was also supported by the significant effect of the Order of the probes, which was used as a covariate. The third probe took much longer to answer than the other probes since the participants had been exposed to a dual-task for longer. Also in the first scenario, the number of unsolved conflicts also increased as a function of the SA level of the probes. Again, the Projection level was the highest average. Most importantly, the Control group, which did not receive calls, had the fewest conflicts in the first scenario.
Taken together, the results on the first scenario showed that the SPAM probes produce an interference effect on the current scenario, confirming the dual-task interference reported in the literature (Pierce, 2012). Moreover, our results show that this interference depends on the SA level of the probes. The higher the difficulty of the questionnaire, the greater the dual-task interference, as evidenced by increased response time and unsolved conflicts. It is also important to note that the effect of SA levels did not differentially affect MWL in the first scenario. This finding confirms previous research on the reactivity effects of the SPAM method, which also found no effect on MWL (Keeler et al., 2015; Pierce, 2012; Silva et al., 2013).
To assess the question-behavior or training effect of the SPAM questionnaire at the different SA levels, participants performed a second scenario receiving a complete SPAM questionnaire covering the three SA levels. The results of the second scenario showed that the average response time to the call followed the same temporal pattern as the first scenario but significantly reduced. Whereas response time to the call is interpreted as related to MWL (Durso et al., 1998, 2017; Loft et al., 2015, 2018), their correlation in our study did not reach significance despite the correlation with response time to probes being significant, and also the one of response time to probes with MWL. Conversely, the fact that the temporal evolution of the response to calls resembles that of the first scenario, suggests that the quicker responses in the second scenario result from a general training effect in inexperienced participants. This demonstrates that both scenarios were structurally equivalent.
Concerning the response time to the probes, its evolution from the first scenario followed a complex pattern. On the one hand, the Perception and Comprehension groups increased their response time to probes, showing an increase in the difficulty of the probes, whereas the Projection and Complete groups reduced their response time. When the Projection group was exposed to the complete questionnaire in the second scenario, their response times decreased significantly. However, an interesting finding was that their response times in the second scenario remained significantly higher than those of the other groups, despite having the same complete questionnaire. It seems that the Projection group exhibited a question-behavior effect, devoting more time to answer each probe, following the pattern shown in the first scenario. In other words, the Projection group continued the verification strategy in the second scenario to respond to any SA level probes. This requires longer response times due to additional calculations and/or verifications (see Dao et al., 2009; Durso et al., 1998) to reply to any SA level.
The lack of difference in response time to probes between the Perception and Comprehension groups, coupled with the increased response time after being exposed to the projection level, indicates that there are specific differences between the SA level groups. In other words, although the relationship between SA levels appears to be hierarchical, the distance between them may not be linear (Endsley, 2015). According to our results, the perception and comprehension levels appear to be more closely related to each other, whereas projection occupies a higher tier. Based on the previous reasoning, it seems that the Perception and Comprehension groups did not generate a question-behavior effect from their response strategies during the first scenario.
The number of conflicts was positively correlated with the response time to each probe and negatively correlated with response accuracy. However, there were no significant differences between the SA level groups in the second scenario. This included the Comprehension and Projection groups, which significantly solved more conflicts in the second scenario. Interestingly, there was a non-significant trend toward a higher number of unsolved conflicts for the Control group in the second scenario. This occurred when they first faced the SPAM questionnaire. Although this effect did not reach significance (p = .09), we believe it was due to a dual-task interference similar to that experienced by the other groups in the first scenario. This assumption is coherent with results with the Complete group, which reduced its number of conflicts (although not significantly) from the first scenario to the second scenario.
As a general summary, performance in the second scenario does not support the existence of a question-behavior effect specific to the attentional strategies used to answer the probes in the first scenario. Only the Projection group seems to maintain these strategies in the second scenario, but only in terms of answering probes. The general trend is simply a learning process in which naive participants respond more quickly to the SPAM questionnaire and improve their performance by reducing the number of unsolved conflicts.
Some results do not depend on the different scenarios and are classified as effects from the SPAM questionnaire. First, response time to calls was not related to task performance. This finding aligns with prior research (Durso et al., 1998, 2017; Loft et al., 2015, 2018), suggesting that call response time correlates only with MWL, not task performance. Consistent with this interpretation, the type of SA exposure did not significantly influence call response times.
Another highly relevant measure for this study was the relation of the SPAM questionnaire and MWL, as assessed through the ISA questionnaire. What we found was that the variability in MWL was explained more by between-subject random effects than by our experimental factors. Nevertheless, the contribution of the fixed factors indicated that there was no overall effect of the SA level groups. This result aligns with prior research (Keeler et al., 2015; Pierce, 2012; Silva et al., 2013). There was, however, a significant effect of the scenario, with MWL increasing in the second scenario. This result may seem paradoxical considering the reduction in the number of conflicts observed in the second scenario. Nevertheless, in this second scenario, all participants received complete SA exposure. This particularly affected the Control group, as they had to simultaneously manage two tasks (handling the scenario and responding to the questionnaire) for the first time. As a result, MWL in the Control group increased significantly.
The study has some limitations. For example, the timing in which participants received the SPAM was not randomized. Participants could therefore anticipate receiving the call every 2 minutes. This was done to ensure that all participants were asked the same probes and were therefore comparable. However, it is possible that our results, particularly those regarding responses to the call, are biased by this limitation. Another limitation was the use of a rotated and inverted version of the first scenario for the second one. Although participants were unaware of the manipulation and we had previously demonstrated that the two scenarios did not significantly affect MWL or performance, manipulating the complexity of the second scenario could have produced differential effects on SA level groups. Finally, the most significant limitation was that the participants were completely inexperienced and specifically trained in the simulator for the study. While we were interested in developing SA from scratch without the influence of ATC training programs, our participants had no prior experience, which strongly affected the Projection group, which faced the most difficult probes and higher levels of SA. This was the only group that exhibited a question-behavior effect in the second scenario, which may be, at least in part, due to the inexperienced participants in the study.
Conclusion
Building and maintaining SA is key to improving task performance. Therefore, in addition to analyzing the development and characteristics of SA, it is important to understand how to promote and improve this cognitive construct. In other words, training programs are necessary to help trainees accelerate the development and maintenance of SA (Endsley & Robertson, 2000). In this regard, authors such as O'Brien and O'Hare (2007) have proposed a training system based on general cognitive functions that develop specific strategies for the better management of ATC tasks. As an alternative, we propose that the exposure to real-time questionnaires using the SPAM method might train participants to search for the specific information and produce estimations and calculations which could serve as specific training for SA formation. Additionally, probes at various SA levels could direct trainees toward similar levels in subsequent tasks.
We found that the SPAM questionnaire produced reactivity effects in the ongoing scenario, and that these effects were modulated by the SA level groups. However, our results do not support the question-behavior effect in the second scenario, which would form the basis of training. Only the higher SA level group, the Projection group, showed the hypothesized question-behavior effect. Contrary to our expectations, this small effect aligns with other researchers in different fields who have demonstrated non relevant reactivity effects of SPAM questionnaires (Bacon & Strybel, 2013; Morwitz & Fitzsimons, 2004; Sprott et al., 2006; Wilding et al., 2016), Therefore, our results have two primary practical implications. First, the study points to the necessity of more formal and systematic training to develop and improve SA, since reactivity effects produce small effects and are restricted to the projection level in the case of inexperienced users. Therefore, using SPAM to facilitate SA formation is not sufficient, whereas the cognitive skills training method developed by O'Brien and O'Hare (2007) appears to be more promising. Second, the fact that SPAM questionnaire reactivity results in only a small effect, mostly in the form of dual-task interference, supports the use of SPAM as a dynamic method of SA estimation during the ATC tasks.
Footnotes
Funding
Declaration of Conflicting Interests
The authors have declared that no competing interests exist.
Data Availability Statement
The data that supports the findings of this study are available on request from the corresponding author. The data is not publicly available due to privacy or ethical restrictions.