
Abstract
The increasing popularity of Artificial Intelligence (AI) emphasizes the need for a deeper understanding of the factors that can influence its use. Providing accurate explanations may be a critical factor to help establish trust and increase the likelihood of the operator following an AI agent’s recommendations. However, the impact of explanations on human performance, trust, mental workload (MW) and situation awareness (SA), and confidence are not fully understood. In this paper, we investigate the effects of providing explanations about the agent’s recommendations (of varying levels of accuracy) on human operator’s performance, trust, MW, SA, and confidence compared to an agent that provides no explanations. Thirty individuals were divided into three groups and randomly assigned to an agent accuracy level (high, medium, low). Each participant completed two sessions using the AI agent: one with explanations, one without explanations. In each session, the user’s performance was measured objectively (number of anomalies correctly diagnosed and time to diagnosis), trust, MW, SA, and confidence in their response were measured using surveys. Participants’ performance, trust, SA, and confidence were higher in the sessions when the agent provided explanations for its recommendations. Accuracy had a significant effect on performance, MW and user confidence but not on trust, or SA.
Keywords
Introduction
Artificial intelligence (AI) is a field of computer science that is concerned with the development of machines capable of performing complex tasks that typical require some decision-making to be accomplished. In other words, it aims at making machines or computers intelligent. It can enable machines to perform cognitive functions like problem-solving, decision-making, and comprehension of natural language. From a philosophical perspective, AI can enable people to live more meaningful lives without having to work as hard. One way to achieve this goal is through automation. AI and automation are two terms that are often used interchangeably but are distinct in many ways. Unlike automation, which is concerned with performing the same task over and over again, AI is focused on creating technology that can dynamically respond to new information and perform tasks without any human intervention. Thus, AI systems are intentionally designed to identify the best course of action when confronted with new data points or scenarios.
AI offers many opportunities for progress and innovation because it has the capability to solve some cognitive tasks much more quickly and efficiently compared to humans. AI agents in various forms (e.g., chatbots, recommender systems) can also assist humans in solving complex problems. These agents can be especially useful when they support users in complex, urgent, and safety-critical tasks. Consider an example of a space crew in a long-duration mission to Mars. Because of the long communication delays, the crew cannot rely on mission control for urgent events such as spacecraft emergencies (Love & Harvey, 2013). An AI agent could thus help crew members address these emergencies. Specifically, the crew must: (1) analyze a potentially large data stream of system measurements to detect and characterize an anomaly in terms of its signature (e.g., CO2 concentration is increasing, O2 concentration is decreasing); (2) identify the most likely root cause for the anomaly (e.g., failure of the Carbon Dioxide Removal Assembly); (3) define a course of action that will resolve the anomaly (e.g., clean or change a clogged filter). An AI agent could help with all those steps. More generally, AI agents can help increase crew autonomy in long-duration human exploration missions (Marquez et al., 2017) and in many other domains requiring operations in remote and harsh environments or suffering from limited communications, such as submarines or natural disasters.
One factor that is known to influence the use of AI agents and their acceptance is trust (Choung et al., 2023; Kelly et al., 2023). Trust has been defined as “the attitude that an agent will help achieve an individual’s goals in a situation characterized by uncertainty and vulnerability” (Lee & See, 2004). Just as human collaboration in urgent and safety-critical tasks would be difficult without some degree of trust between teammates, trust in intelligent agents is necessary for human-agent teams to work smoothly and effectively. The ability to communicate effectively plays a key role in the establishment and maintenance of trust. Specifically, the ability to explain to others the reasoning behind a decision is a critical aspect of human intelligence that is also a prerequisite for establishing a trusting relationship in social interactions between people—for example, a relationship between a doctor and their patient, a football player and their coach, or a company and its customers. Although these social aspects may be less important for AI systems, there are many arguments in favor of explainability in artificial intelligence (Adadi & Berrada, 2018; Amann et al., 2022; Ding et al., 2022; Hamon et al., n.d.; Hoffman et al., 2018).
Previous studies on the adoption of new technology in various domains show that more effort is needed to induce trust in order for it to be accepted and used (Fernandez et al., 2010; Jian et al., 2000; Molesworth & Koo, 2016; O’Donovan & Smyth, 2005; Wang & Benbasat, 2005). Agent transparency and performance (e.g., the accuracy of its recommendations) are important factors that drive user trust. More accurate systems naturally tend to be more trusted (Yin et al., 2019). But in some cases, building AI agents with higher accuracy may not be sufficient or even possible. Research has shown that having the AI agent provide explanations for its actions or recommendations can be a promising way to foster trust in the agent (Papenmeier et al., 2019; Zerilli et al., 2022). In the context of spacecraft emergencies, crew members may be more likely to follow the agent’s recommendations if they understand the reasoning behind them. Incorporating appropriate explanations into the intelligent agents can help the user to better understand the decisions and be more satisfied with the diagnosis (Alam & Mueller, 2021; Shin, 2021).
AI agents influence the cognitive states of human operators in various ways (Parasuraman et al., 2008; Yang et al., 2023). Agents that can adapt to changing environments or individual differences in human operators are seen as trustworthy and reliable members of human-agent teams (Feigh et al., 2012; Kim et al., 2020; Maes, 1993). However, before we can implement such adaptive AI agents, it is essential to understand how an operator’s cognitive states—trust, mental workload (MW), situational awareness (SA), and confidence—change in response to the information presented by these agents (Feigh et al., 2012; Schwarz & Fuchs, 2019). In high-stakes environments, such as space exploration missions, maintaining optimal levels of performance, trust, confidence, MW, and SA is crucial for safety (Kim et al., 2020; Parasuraman et al., 2000; Stanton et al., 2001).
Research suggests that “calibrated trust”—trust aligned with the system’s actual reliability—helps prevent both over-reliance and under-reliance on the agent (Collins & Juvina, 2021; Dzindolet et al., 2002; Gao et al., 2019; Parasuraman & Riley, 1997). A human operator’s trust, and as such, confidence in an AI agent can also fluctuate depending on the agent’s performance and problem-solving capabilities (Chong et al., 2022; Taudien et al., 2022). Forming a correct mental model of the agent’s error boundaries to know when to trust or distrust an agent’s recommendations, is key to success in AI-assisted decision-making. If the operator follows an agent’s recommendations when it is more likely to err, the outcome of the decision would suffer and may lead to catastrophic failures in time- and safety-critical applications. By exclusively focusing on optimizing the performance of the AI agent, developers of XAI systems often neglect the operator’s needs for developing a good mental model of the AI’s error boundaries through various explanation techniques. Therefore, understanding operator trust and confidence dynamics and how they are impacted in a decision-making task is key to minimizing erroneous reliance on the agent and improving human-AI team performance.
Situation awareness (SA), which has been studied within the field of human factors in the context of human-AI teams (Chen & Barnes, 2014; Endsley, 1995), describes the information requirements by the operators in decision-making scenarios. Explanations about AI agent’s behavior can contribute to a subset of operator’s SA such as understanding. The performance in human-AI teams can be improved through agent transparency that supports SA. However, even though SA supported by explanations is necessary, it is not solely sufficient to support team performance (Endsley, 1995). While SA defines the information an operator needs, MW considerations impact how and when this information should be provided (Parasuraman et al., 2008).
Previous studies have suggested that maintaining adequate levels of MW is essential. MW considerations impact operator attention and fatigue, which can be crucial for safety and performance. Sufficient levels of mental workload can prevent operator’s detachment from the task by encouraging more engagement in the task at hand, thereby avoiding performance decrements and human errors due to information underload (Young & Stanton, 2002), or more broadly, passive fatigue (Hancock & Desmond Paula, 2000). On the other hand, information overload can also cause performance decrements due to operator fatigue and slips (Hancock & Verwey, 1997; Van Acker et al., 2018; Yerkes & Dodson, 1908). If an agent’s explanations are too long or complex, they may contribute to information overload, increasing mental workload without necessarily boosting trust (Du et al., 2019) or SA (Borgo et al., 2018).
In sum, understanding how an operator’s cognitive states are influenced by interactions with the agent, through agent reliability and explainability, is vital for developing effective agents in safety-critical environments.
The Present Study
Despite all the relevant literature presented here, there is still much to be explored in the area of human-agent interactions in urgent decision-making tasks. Answers are still needed for questions such as: How would an agent’s explanations, for an accurate or inaccurate recommendation, affect human performance and trust in a time-critical task? Would they degrade or enhance the user’s situational awareness and cognitive load? Prior literature suggests that agent transparency, more specifically explanations provided by an agent, positively affect trust in automation, user confidence, and situational awareness at the costs of higher workload and longer decision-making times (Chong et al., 2022; Endsley, 2023; Ezenyilimba et al., 2023; Helldin, n.d.; Shin, 2021; Taudien et al., 2022; van de Merwe et al., 2022; Wright et al., 2020). As such, we hypothesize that these results would translate to our study as well. Thus, our primary hypothesis related to agent transparency is as follows: •
Although there is previous research establishing positive relationship between accuracy and trust (Papenmeier et al., 2019; Yin et al., 2019), the effects of agent accuracy on user SA and confidence are relatively under-explored. Some previous research has shown that accuracy has a positive impact on user trust, and performance, while low accuracy has a negative impact on workload and decision-making times (Chong et al., 2022; Entin & Entin, 1997; Yin et al., 2019). As such, in this study, we aim at exploring the relationship between varying levels of accuracy within the AI agent’s explanations and human operator’s task performance, trust, MW, SA, and user confidence. Therefore, our primary hypothesis related to accuracy is: •
We carefully designed various anomaly scenarios so that they would lead to different levels of accuracy and uncertainty in the agent’s recommendations. Accuracy is characterized by whether the agent provides a correct diagnosis to the user for a particular anomaly. In this study, accuracy is manipulated to be either high, medium, or low (100%, 75%, and 50% correct diagnoses respectively out of the total anomaly scenarios presented to the subject in a session). Uncertainty refers to the variability in the AI agent’s diagnosis. In the context of this task, is implemented in the agent’s recommendations, and is related to agent confidence, that is, how confident the agent is in its own diagnosis. In this study, all subjects experience some scenarios with high uncertainty, and some with low uncertainty. Daphne (Dutta et al., 2020) is used as a representative intelligent agent for anomaly diagnosis in the context of spacecraft environmental control and life support systems (ECLSS). Two different versions of Daphne were developed for the study—one version that provides no explanations for its recommended diagnosis (other than qualitative confidence scores for the most likely root causes of the anomalies), and a second version that provides knowledge-driven explanations based on expert knowledge as well as data-driven explanations based on a database of past anomalies. Thirty participants used these two versions of the agent within the context of diagnosing 16 time-critical ECLSS anomalies. We studied the effect of explanations and accuracy of diagnosis on user confidence, task performance, and trust, MW, and SA.
Methods
Participants
We recruited N = 30 participants. Participants were required to be 18 years or older, have a working knowledge of English, and be comfortable using a standard computer mouse and keyboard. The eligibility criteria required that the participants have a college degree or higher in a STEM major*. Moreover, those with prior knowledge of following procedures in an operational or professional setting were preferred. This preference was added to select subjects to be as close to “astronaut-like” as possible. Recruitment was done by soliciting individuals from Texas A&M University (TAMU) population using a university-wide email network. The demographics were as follows: 17 subjects identified as men, 13 identified as women. The mean age of the population was 30 years with a standard deviation of 9.8 years. The participant pool consisted of 5 people with a PhD degree, 8 people with a Master’s degree, and 17 people with a Bachelor’s degree. Finally, most of the participants had some prior professional experience throughout their careers. These professional experiences included working as a professor, software engineer, structural engineer, petroleum engineer, supply chain lead, phlebotomist, Disaster Response and Recovery in the US military, pilot, and certified SCUBA instructor for human spaceflight program at NASA JSC. None of the participants had any prior experience or knowledge about Daphne. The experiment was approved by the TAMU Institutional Review Board according to the Declaration of Helsinki, and informed consent was collected from each participant before the beginning of the experiment.
Experimental Design
Figure 1 shows an overview of the experimental design. First, participants were randomly assigned to one of three groups (10 participants per group) with different agent accuracy: (1) high accuracy (100% accuracy), (2) medium accuracy (75% accuracy) and (3) low accuracy (50% accuracy). The participants in each group were tasked to diagnose 16 anomalies in two consecutive sessions of 8 anomalies: one session with explanations and one without explanations (order counterbalanced). Therefore, for subjects in the medium accuracy group, for example, Daphne would provide an incorrect diagnosis in 2 out of 8 scenarios in each explanation condition. The order of the incorrect anomalies in each session was randomized. Moreover, in each session, regardless of accuracy, 4 out of the 8 anomaly scenarios were high uncertainty scenarios. In these high uncertainty scenarios, Daphne provides a low-confidence recommendation because there is more than 1 potential root cause with the same confidence level. The remaining 4 scenarios were low uncertainty scenarios, in which Daphne provides a high-confidence recommendation since there is a single “Very Likely” root cause and the others are less likely. The order of the high/low uncertainty scenarios in each session was randomized. Even though the uncertainty levels vary within a session, every subject sees the same amount of high versus low uncertainty scenarios. Therefore, in this paper we will focus on the effects of explanations and accuracy. Experimental design.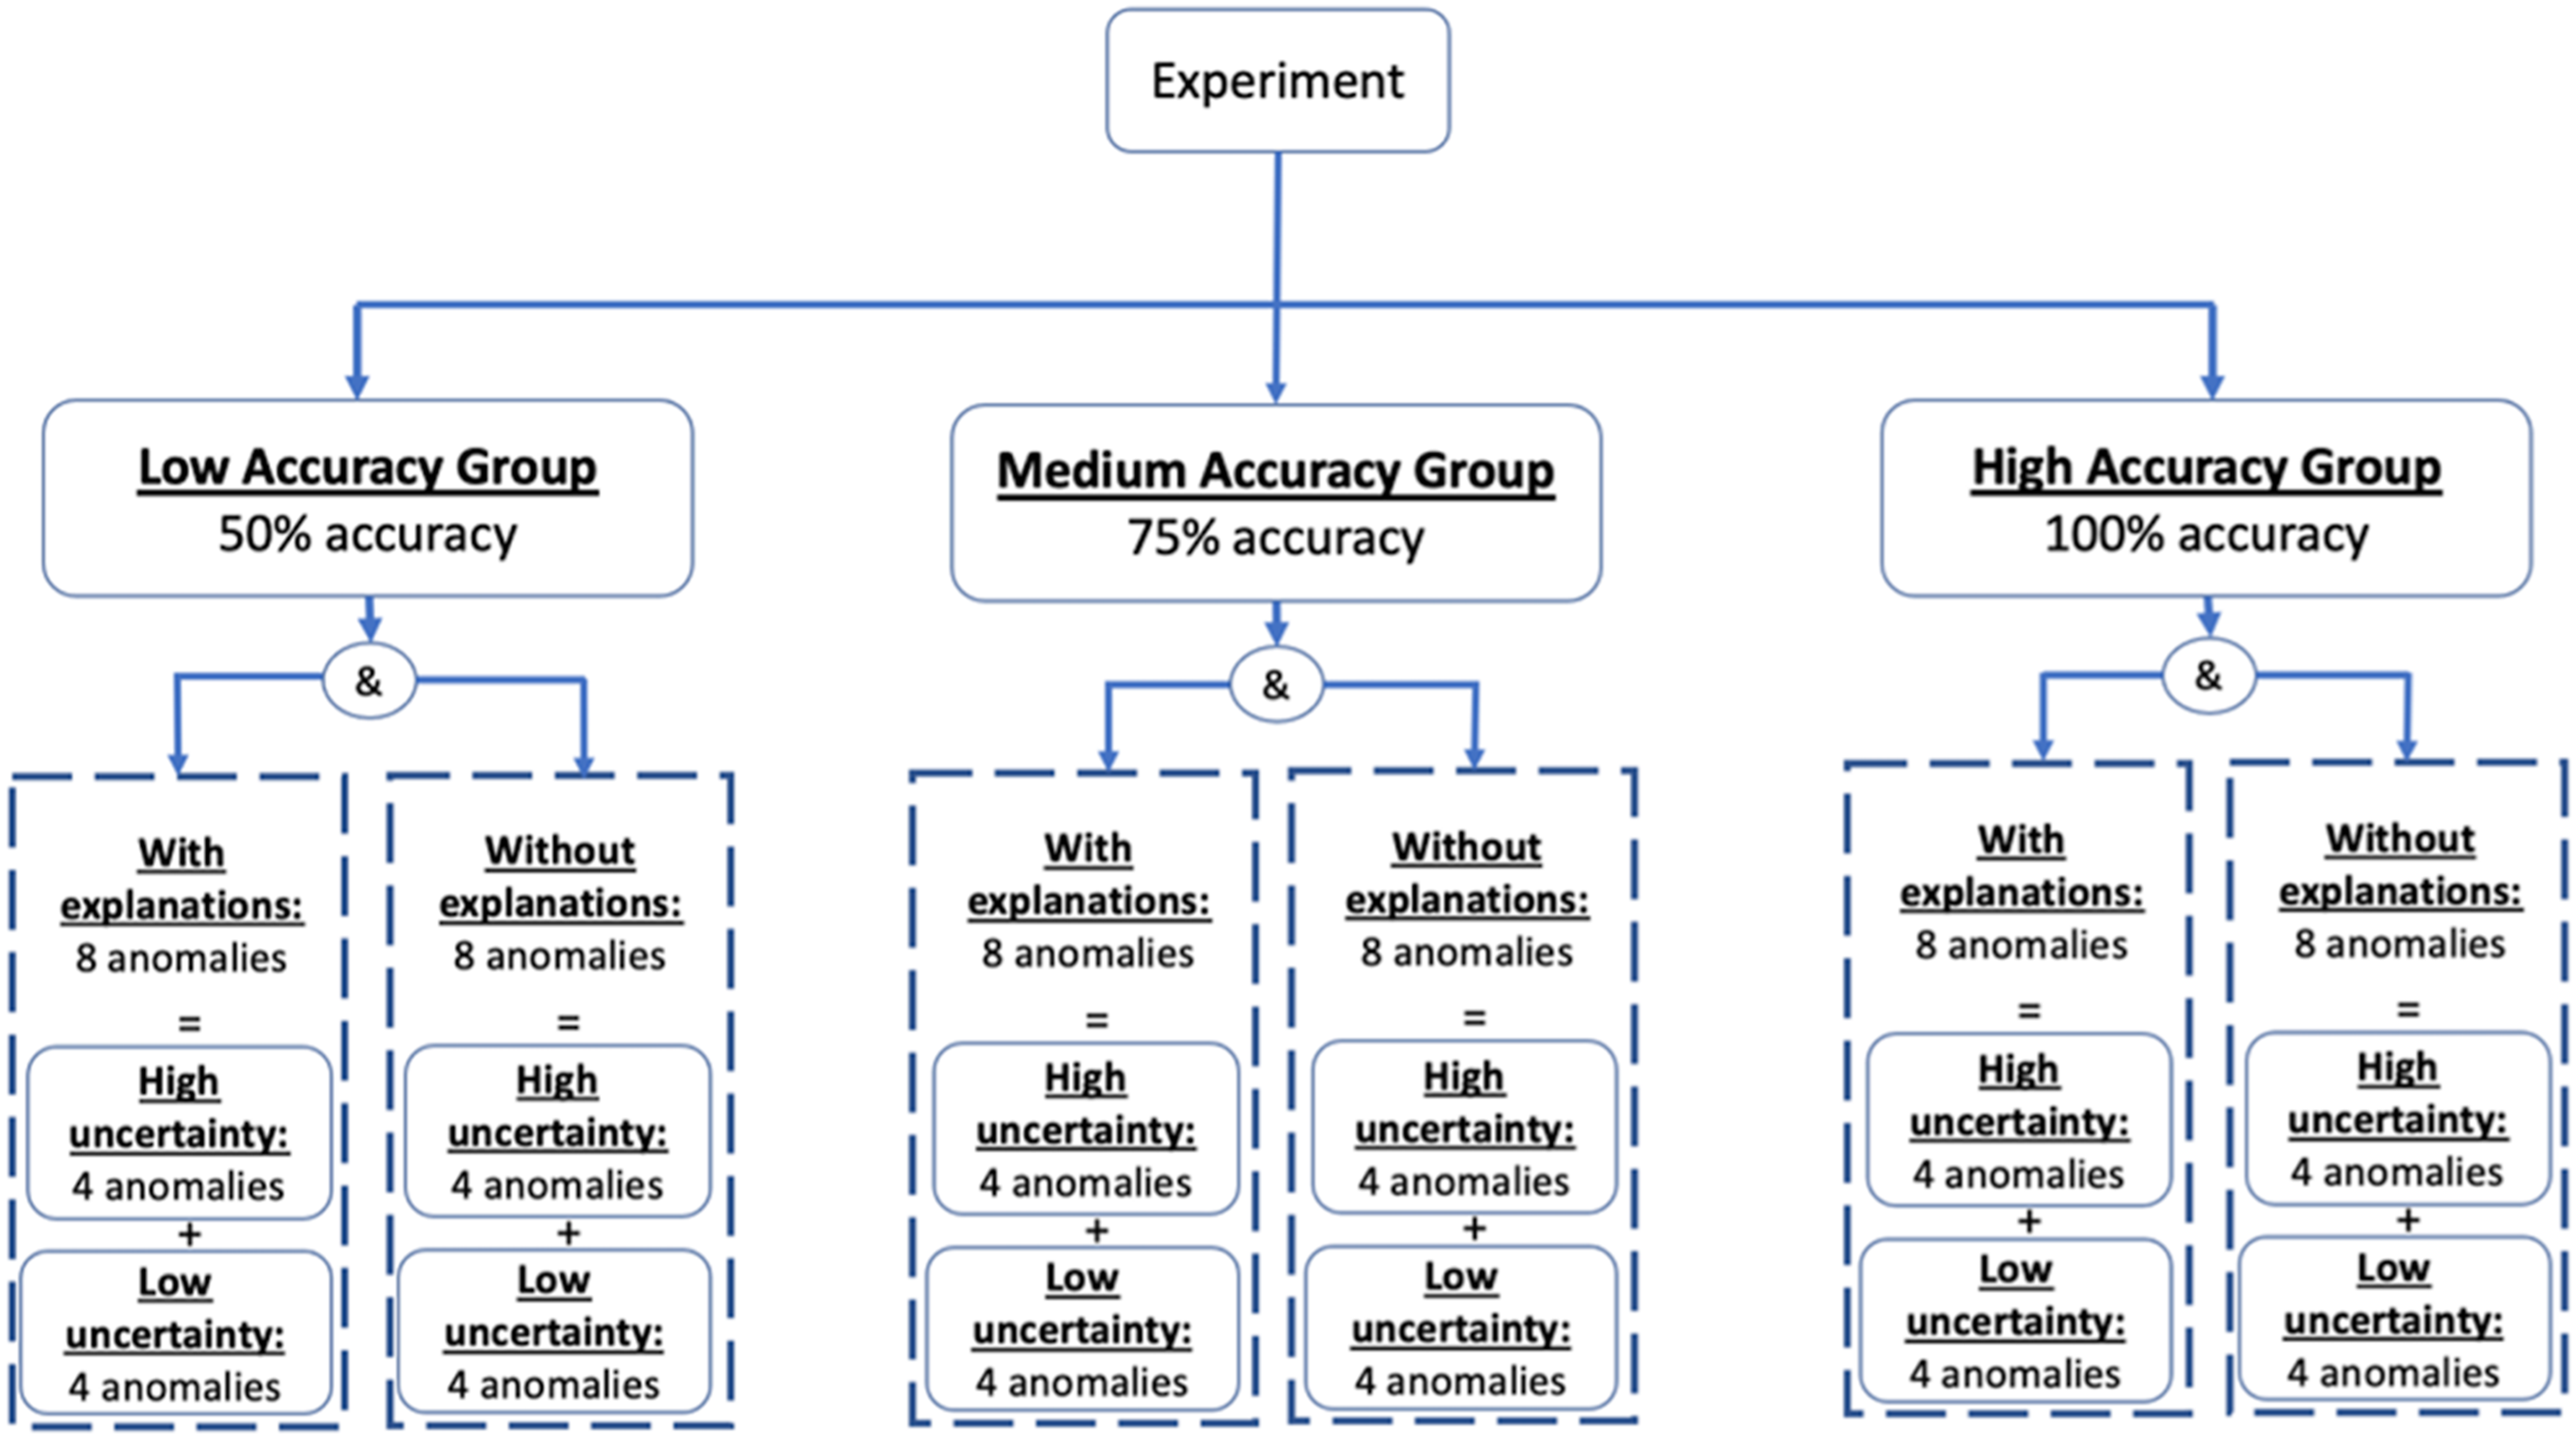
Experimental Materials
AI Agent: Daphne
We developed an AI agent for anomaly treatment during Long Duration Exploration Missions (LDEMs), called Daphne (Dutta et al., 2020). Daphne has various capabilities or “skills” to help the user treat time-critical anomalies encountered in the Environment Control and Life Support Systems (ECLSS) of a spacecraft. More specifically, Daphne has 3 skills: (1) Detection (real-time data monitoring and analysis), (2) Diagnosis (identification of the root cause), and (3) Recommendation (proposition of a course of action, that is. a procedure, for anomaly resolution). Daphne’s skills are supported by three data sources: (1) a real-time telemetry feed from the Habitat System Simulator (HSS). The HSS, developed by NASA JSC, is a simulator that allows its user to simulate the values of various habitat parameters and manually introduce anomaly scenarios in the telemetry feed; (2) A knowledge base containing domain-specific information about commonly occurring and known ECLSS anomalies along with their signatures, recommended procedures, necessary equipment, risks, etc.; (3) A historical anomaly database that contains (synthetic) historical information about anomalies that were encountered in ECLSS systems during previous missions, their root cause, start and end dates and times, their signature, and the ways they were resolved.
The standard workflow of resolving an anomaly with Daphne is as follows. A few seconds after an anomaly scenario is introduced through the HSS simulator, Daphne detects the anomaly and presents its signature to the user as a list of symptoms (i.e., parameters and the type of threshold that they exceeded). The user selects the symptoms (or a subset of those if they suspect that a symptom could be false, for example, a faulty sensor that gives a saturated reading) and clicks the Diagnose button. Daphne responds by providing a list of a few possible root causes, sorted in order of their likelihood score. These likelihood scores are calculated based on the overlap between the symptoms in the current anomaly signature and the signatures in the known anomalies in the knowledge base. Additional details can be found in our previous work (Dutta et al., 2022). The user then selects the potential root cause they think is the most likely, given their own knowledge in addition to Daphne’s recommendation. Upon selecting a root cause, Daphne provides a recommended procedure to resolve it.
For the purposes of this study, two different versions of Daphne’s front end were developed: one version for the control session without descriptive explanations for diagnosis as shown in Figure 2(a), and a second version for the treatment session that included descriptive explanations for diagnosis in the diagnosis window as shown in Figure 2(b). The version of Daphne used in the control session only shows the user qualitative likelihood scores for the potential root causes (i.e., “Very Likely,” “Likely,” and “Somewhat Likely”). In this version, the user does not have any further information about where these scores come from or “how” these diagnoses were made. While one could argue that the likelihood scores are somewhat of an explanation, the information provided is clearly limited and does not provide the user with a justification of these qualitative likelihood scores provided by Daphne. In the treatment condition, in addition to the qualitative scores provided in the control session, the user also has access to additional explanations. There are two types of explanations shown to the user in the Diagnosis window in the sessions with explanations. Both of these explanations appear to the user simultaneously for an anomaly scenario: • Knowledge-driven explanations show the user how the symptoms of the current anomaly compare to those of the known anomalies. This information comes from the knowledge base, which is assumed to come from experts—hence the name knowledge-driven. The information is presented to the user in the form of a Symptom Comparison Table as shown in Figure 2(b). • Historical Data-driven explanations are based on information from a synthetic historical database of past anomalies. This Historical Anomaly database contains information of specific instances of past anomalies, including their signature, the start and end dates and times of occurrences, their actual root cause, and the steps that were taken to resolve those instances of anomalies. An example of data-driven explanations is shown at the bottom of Figure 2(b). Daphne’s user interface for sessions with and without explanations. Only anomaly diagnosis window is shown. (a) Anomaly diagnosis window in sessions without explanations. (b) Anomaly diagnosis window in sessions with explanations.
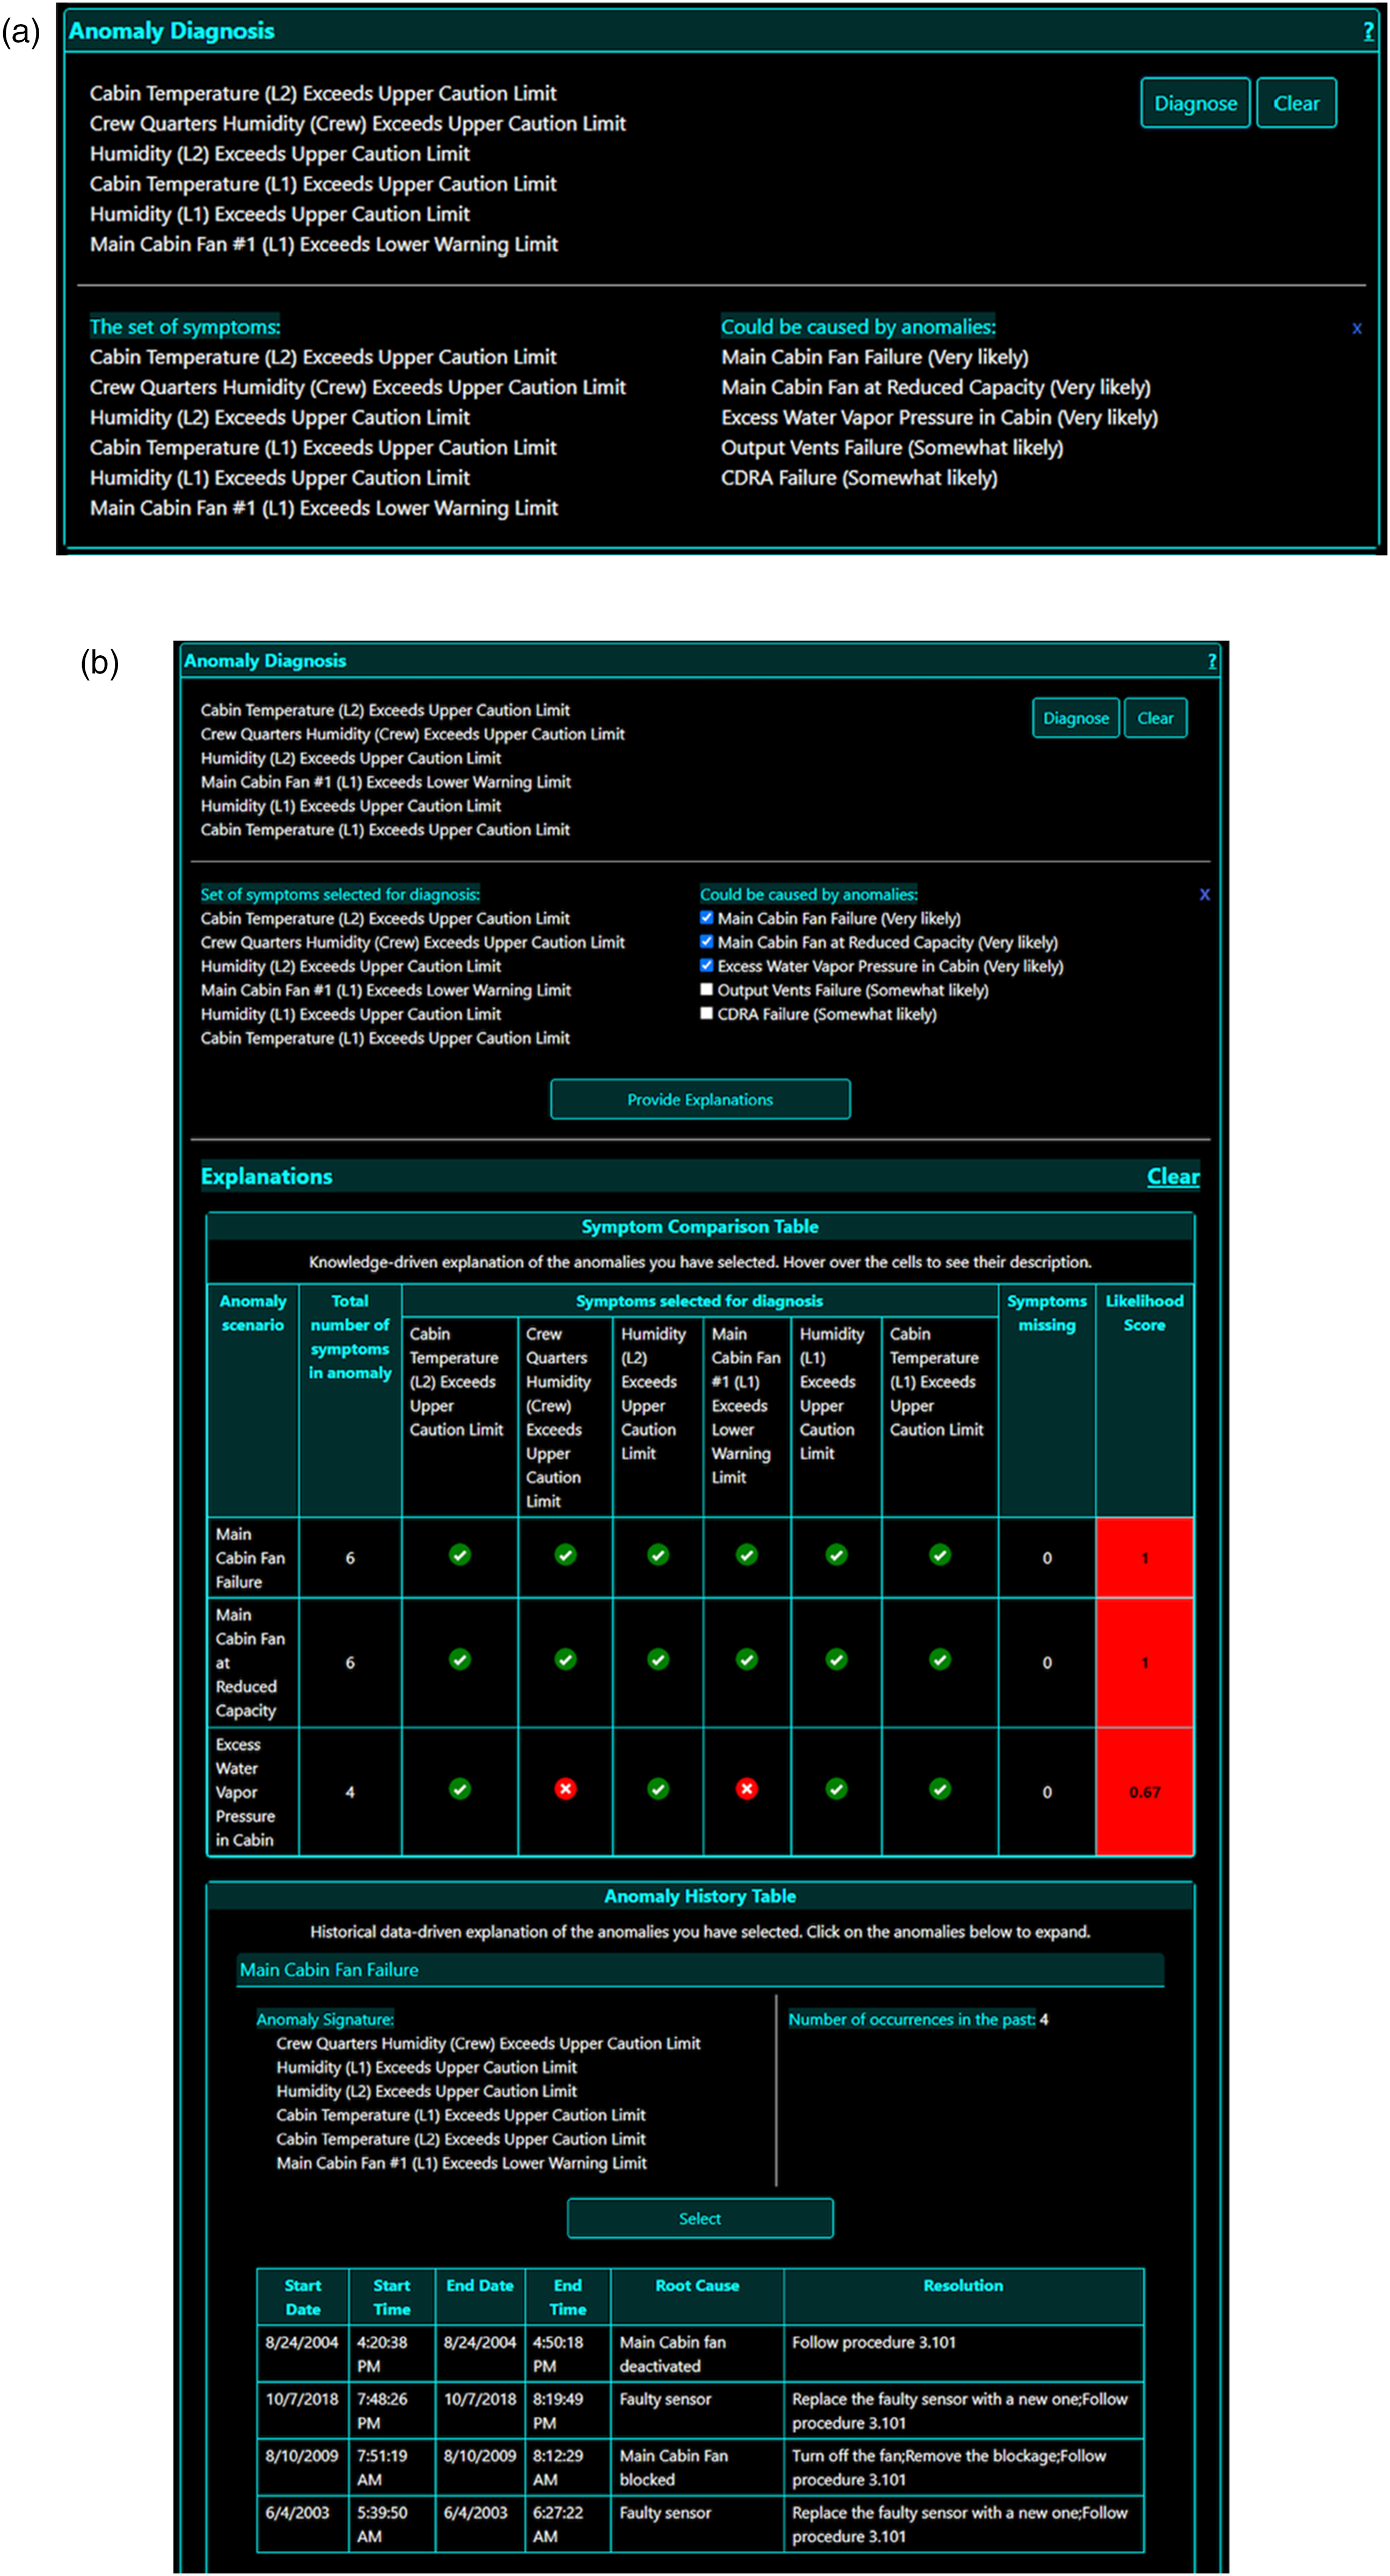
Note that both the explanations that appear on the Diagnosis window are of the same anomalies—the anomalies that are present in Daphne’s diagnosis based on their likelihood scores. During pilot studies, it was found that displaying 2 types of explanations would create too many confounding variables due to the fact that some operators preferred historical explanations for making their decisions. To reduce the effects of operator preferences on the metrics, the subjects were told during training that they should inform their diagnosis using Knowledge-driven explanations only that is Symptom Comparison Table (Figure 2(b)). Future studies will be conducted to investigate the effects of types of explanations on the operator’s behavior.
Anomaly Scenarios
To perform the experiment, we developed 30 unique anomaly scenarios in collaboration with NASA Johnson Space Center for their HERA (Human Exploration Research Analog) research Campaign 6 (HERA Research by Campaign | NASA, 2024). Twenty-six of those scenarios were used for the experiment: 8 anomalies per session (4 high uncertainty and 4 low uncertainty), other 4 scenarios were used for training and backup. The scenarios were designed such that these anomaly scenarios have varying degrees of inaccuracies and uncertainties associated with them. A scenario is considered accurate in Figure 3 if the root cause that has the highest likelihood score in Daphne’s diagnosis (or presented first in the case of multiple equally likely scenarios) is the correct diagnosis. A scenario is considered inaccurate if the root cause that is most likely or shown at the top is the incorrect diagnosis. To simulate a low accuracy scenario, we designed a scenario that did not have the same signature as in the same anomaly in Daphne’s knowledge graph and which, given its modified signature, would lead to a misdiagnosis. A few example anomaly scenarios with varying degrees of accuracy and uncertainty.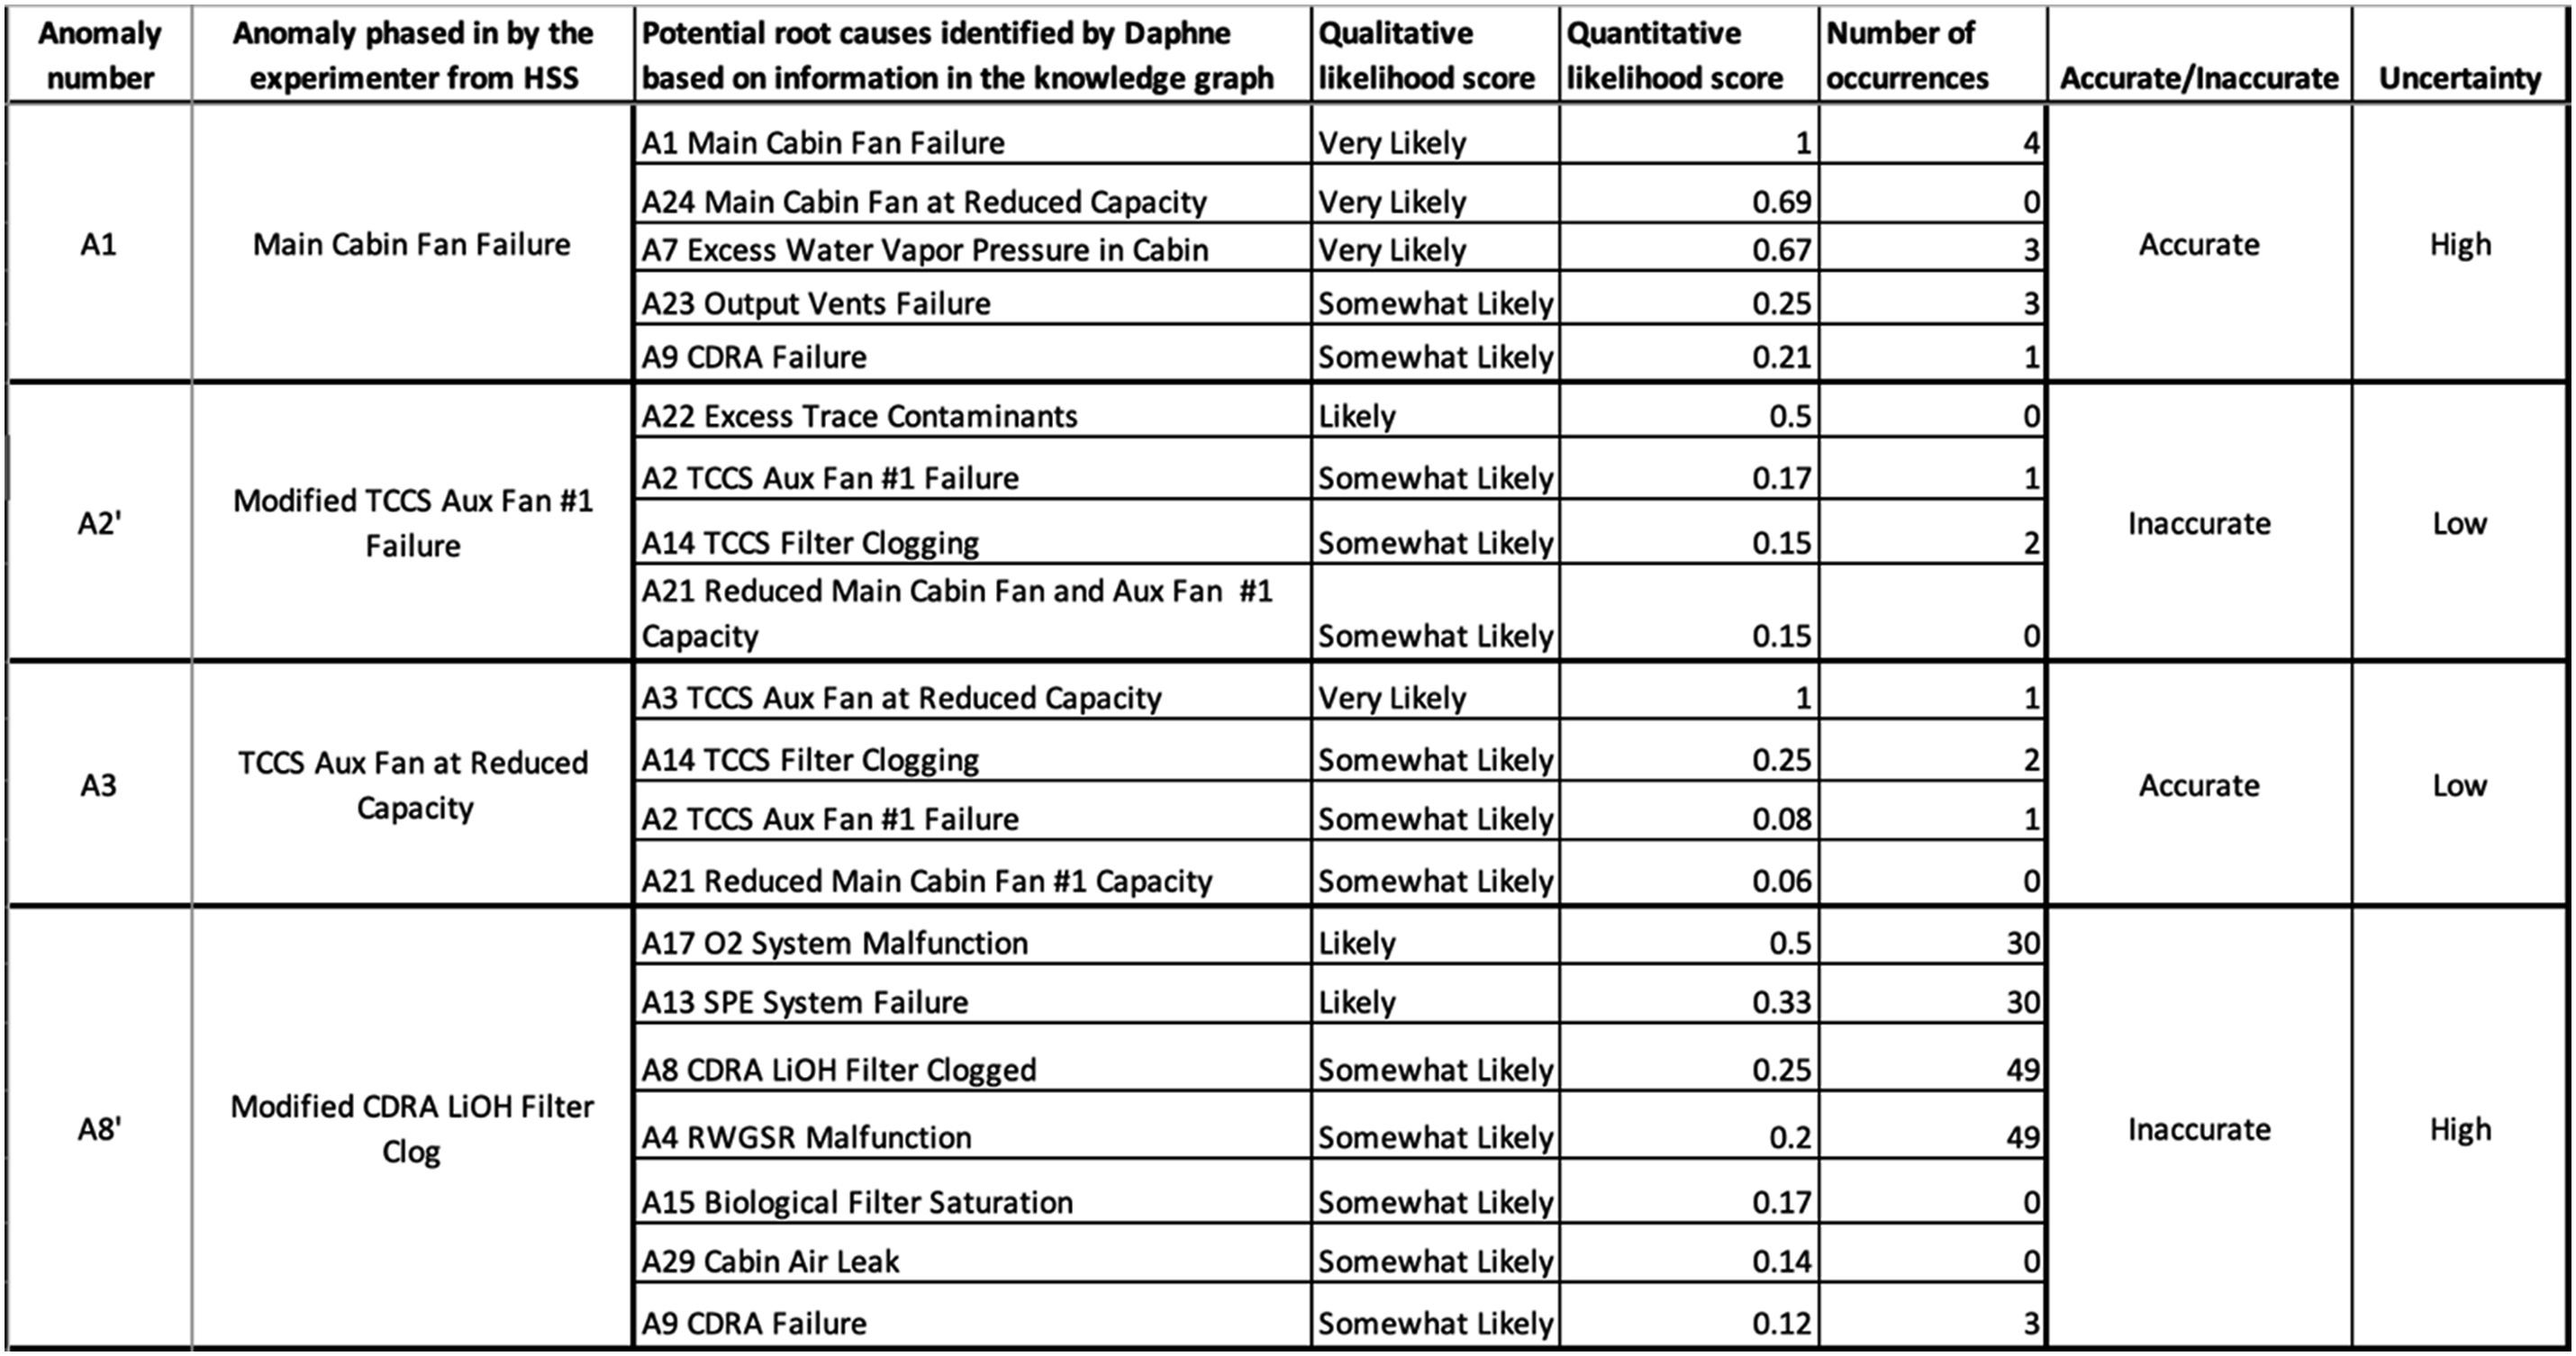
There are 2 levels of uncertainty based on the qualitative likelihood score: (1) high: Daphne characterizes more than 1 root cause with equal qualitative likelihood score, (2) low: there is one root cause with higher likelihood than all others. To simulate a high uncertainty scenario, we designed a scenario where the qualitative score would be the same for 2 or more anomalies in Daphne’s knowledge graph. An anomaly scenario can have a combination of different levels of accuracy and uncertainty associated to it. For example, a high uncertainty inaccurate scenario would yield a diagnosis report with more than 2 equally likely root causes but any of those root causes, if selected by the subject, would yield an incorrect diagnosis for the scenario. The order in which these anomaly scenarios were presented to the users was randomized, but at the end of each 8-anomaly session, the total number of accurate/inaccurate scenarios was consistent with the group accuracy level, and the number of scenarios with high/low uncertainty was the same (4 and 4) for every subject.
Experimental Procedure
The entire experiment took place virtually via a Zoom session and took about 2 hours per subject to complete. The subjects were provided a 13-page manual a day before the experiment to familiarize themselves with different subsystems of the ECLSS, their functionalities, and the measurements that they affect. This document also provided the subjects information about Daphne and different aspects of the experiment. After the signed consent form was obtained, the experiment began with a 20-minute tutorial during which the subjects first watched a video that explained them the process of anomaly resolution in real-time on Daphne’s GUI and how to use the information provided on each component for anomaly diagnosis. The subjects were also explained how Daphne uses off-nominal measurements to calculate the likelihood scores and provide recommendations to the user. The subjects were then asked to resolve two test anomaly scenarios without any help from the experimenter or the training materials. Then, the subjects were asked to complete a quiz that consisted of 10 short answer questions about the tool and the experiment. Any subject who was unable to get a score of 8 or more correct answers on the quiz was removed from consideration. This was done to record their baseline knowledge level and to ensure that all the subjects had sufficient understanding of the experiment to continue. Then, each subject performed two experiment sessions, one session without descriptive explanations and a second session with explanations. These sessions were performed on the same day, back-to-back, and their order was randomized and counterbalanced to minimize learning effects. Each session lasted about 40 minutes and included 8 anomaly scenarios with various degrees of accuracy and uncertainty as explained above. The subjects were not aware of the total number of anomaly scenarios that they were to diagnose in a session. However, they were aware of the time they were allotted for diagnosing each anomaly (3 minutes) and the time remaining on the clock for each scenario as indicated on the top of Daphne GUI 2b. This was done to simulate a sense of urgency similar to real-life scenarios.
For each anomaly scenario, the experimenter introduces the anomaly scenario from the HSS simulator, and the subject attempted to diagnose it based on the root causes provided by the Daphne agent in the allotted time. Since the focus of the experiment was on the diagnosis step, subjects were not asked to actually conduct any of the steps in the resolution procedures. They simply indicated their selected procedure for the selected root cause by marking it as completed in Daphne. After the subject resolved an anomaly, they were prompted to provide their level of confidence in their own diagnosis. Once they provided their confidence level, Daphne told the subject whether their selected diagnosis was correct or incorrect by a prompt on their screen. Then, the subject was asked to fill out a short post-anomaly survey that measured their satisfaction and trust in Daphne. After they finished the survey, a short random wait time (less than 30 seconds) was added before the next anomaly was introduced and the procedure was repeated for the other anomaly scenarios. Once a subject finished all 8 anomaly scenarios in a session, they were asked to complete a post-session survey that measured their trust, MW, SA, and satisfaction. The same process was repeated for the second session. Throughout the entire experiment session, the subjects’ activities on their screen and their video feed were being observed and recorded. This was done primarily so that the experimenter can observe the subjects and ensure that they are not getting unintended assistance. All subjects were provided a base compensation for their time in this study and for every anomaly correctly diagnosed, the subject earned extra compensation that was added to the base amount.
It is important to note that the subjects were free to choose any of the anomalies in the system and did not have to rely on Daphne’s diagnosis to make their selection. They were given an ECLSS manual prior to the experiment to familiarize themselves with the system, its subsystems and various parameters that affect these systems. On Daphne, the Sensor data window can be used to view the telemetry feed from the ECLSS system. The subjects can plot the measurements coming in from various sensors across the ECLSS systems and chose the parameters that they would like Daphne to diagnose. Moreover, in the Anomaly Response window, all the procedures of all the commonly known anomalies are available for the subject to select from and submit as their final answer. Also, the explanations and accuracy are independent variables in the experiment, so the fact that explanations were provided does not mean that the agent was recommending the correct diagnosis.
Dependent Variables
Dependent variables included measures of performance, confidence, and trust, MW, and SA during the anomaly resolution tasks, and these were collected through a combination of objective and subjective measures.
Performance was measured using: (1) the number of anomalies that participants correctly diagnosed within the time provided, and (2) mean time taken to diagnose the anomalies. For every anomaly correctly diagnosed in the allotted time, the subject was given a score of 1. If the subject ran out of time or selected an incorrect procedure, it was considered a failure scenario, and they were given a score of 0. The number of anomalies correctly diagnosed was a sum of all the individual anomaly scores for a subject. The time to diagnosis was measured from the time the anomaly was injected to the time where the user marked their selected procedure as done. The mean time to diagnose the anomalies was calculated by averaging the total time it took for the subject to diagnose all the anomalies, accurately or inaccurately, in a session. All times were recorded through an internal script written in Daphne’s code base.
Trust in Daphne was measured once after each session was complete, using Jian’s Trust in Automation survey (Jian et al., 2000). Jian’s survey consists of 12 questions. The first 5 questions are about the level of agreement with negative question prompts that measure the user’s distrust in the system. The next 7 questions are positive prompts and are used to calculate the user’s trust in the system. Each question is rated on a 7-point Likert scale. The positive trust score is calculated by adding the scores of all the individual trust questions, and the negative trust score is obtained by adding all the scores of the inverted distrust questions. The overall trust score is measured by summing the positive trust and distrust scores.
MW was measured after each session using the NASA Task Load Index (TLX) questionnaire (Hart & Staveland, 1988). Subjects completed this questionnaire after each of the two experimental sessions. NASA TLX measures six dimensions of workload on a scale from 1 to 100: mental demand, physical demand, temporal demand, performance, effort, and frustration. Weighting factors were also obtained to discern which dimensions contributed more to the workload of the task. The overall MW was calculated as a weighted 7 average of all six workload dimensions.
SA was measured after each session using the Situational Awareness Rating Technique (SART) (Taylor, 2017), which consists of 10 questions on a Likert scale of 1–7. The SART rating scale has 3 dimensions or sub-scales: (1) attentional demand (3 questions), (2) attentional supply (4 questions), and (3) understanding (3 questions). Each of these dimensions’ scores is calculated by adding the scores of the questions in that dimension. Then, the total situational awareness score is calculated using the formula: Situational Awareness = Understanding – (Attentional Demand – Attentional Supply).
In addition to the primary variables above, user confidence was also measured. Confidence was obtained post anomaly diagnosis using a prompt on Daphne’s interface after the subject submitted their diagnosis response for the anomaly scenario. The prompt asked the user “How confident do you feel in your anomaly diagnosis?” and provided a 7-point Likert scale to the user to fill in their response. The score submitted by the user is their confidence score.
Statistical Analysis
Statistical tests were performed using the R Statistical Software (version 4.3.2; R Foundation for Statistical Computing, Vienna, Austria). Data were tested for normality using the Shapiro-Wilk test and homoscedasticity using the Levene’s test, for applications of corresponding statistical procedures. To investigate the effects of agent explanations and accuracy on the metrics of performance, trust, MW, SA, and confidence, two-factor mixed ANOVA were implemented when normality was satisfied to test the main and interaction effects of the independent variables on the dependent variables. If normality was not satisfied, the non-parametric Wilcoxon signed-ranked test was implemented instead. Further, a one-way between-subjects ANOVA was performed on the metrics in the 3 accuracy groups (high, medium, and low accuracy) to investigate which accuracy group had the biggest change in the performance between the sessions. In addition, post-hoc analysis was performed using pairwise t-tests with a Bonferroni correction to account for the repeated tests bias. When the data did not satisfy the normality assumptions, the non-parametric test Kruskal–Wallis (KW) test was used. In all cases, significance was taken at α = 0.05 level. Data are presented as mean ± SE. For all measures, Cohen’s d effect size was calculated.
Results
Performance
The total number of anomalies correctly diagnosed by participants in each experimental condition is shown in Figure 4(a). A two-way mixed ANOVA revealed that there was a significant main effect of transparency on number of anomalies diagnosed [F(1, 54) = 8.92, p = .004]. On average, participants diagnosed more anomalies with explanations (5.96 ± 0.29) than without explanations (5.10 ± 0.20). The effect size for this analysis (d = 0.64) was found to exceed Cohen’s (1988) convention for a medium effect (d = 0.50). There was a significant main effect of accuracy on the number of anomalies diagnosed [F(2, 54) = 11.96, p < .001]. Post-hoc comparisons using t-tests with Bonferroni corrections indicated that the mean scores for Low Accuracy group was significantly different from Medium and High Accuracy groups. The total number of anomalies correctly diagnosed by participants in each accuracy group is shown in Figure 5(a). On average, the subjects in the Medium Accuracy group diagnosed the most anomalies (6.2 ± 0.22), followed by the High Accuracy group (5.85 ± 0.26), and Low Accuracy group diagnosed the least number of anomalies (4.55 ± 0.24). The interaction effect between transparency and accuracy was not found to be statistically significant [F(2, 54) = 2.86, p = .065]. Results (n = 30) in each experimental session (without explanations vs. with explanations): (a) Number of anomalies correctly resolved (out of 8 anomalies); (b) Mean time to diagnose an anomaly (out of 180 seconds); (c) Trust in automation; (d) Mental workload; (e) Situational awareness; and (f) Confidence. In all cases, dotted gray lines represent individual participants, and solid black lines represent the average (±SE) across participants. (a) p < .01, (b) p = .84, (c) p = .01, (d) p = .18, (e) p = .02, and (f) p = .02. Results (n = 30) in each experimental session (without and with explanations), for each accuracy group (low accuracy, medium accuracy, high accuracy): (a) Number of anomalies correctly resolved (out of 8 anomalies); (b) Mean time to diagnose an anomaly (out of 180 seconds); (c) Trust in automation; (d) Mental workload; (e) Situational awareness; and (f) Confidence. (a) p < .01, (b) p = .95, (c) p = .79, (d) p = .03, (e) p = .94, and (f) p = .02.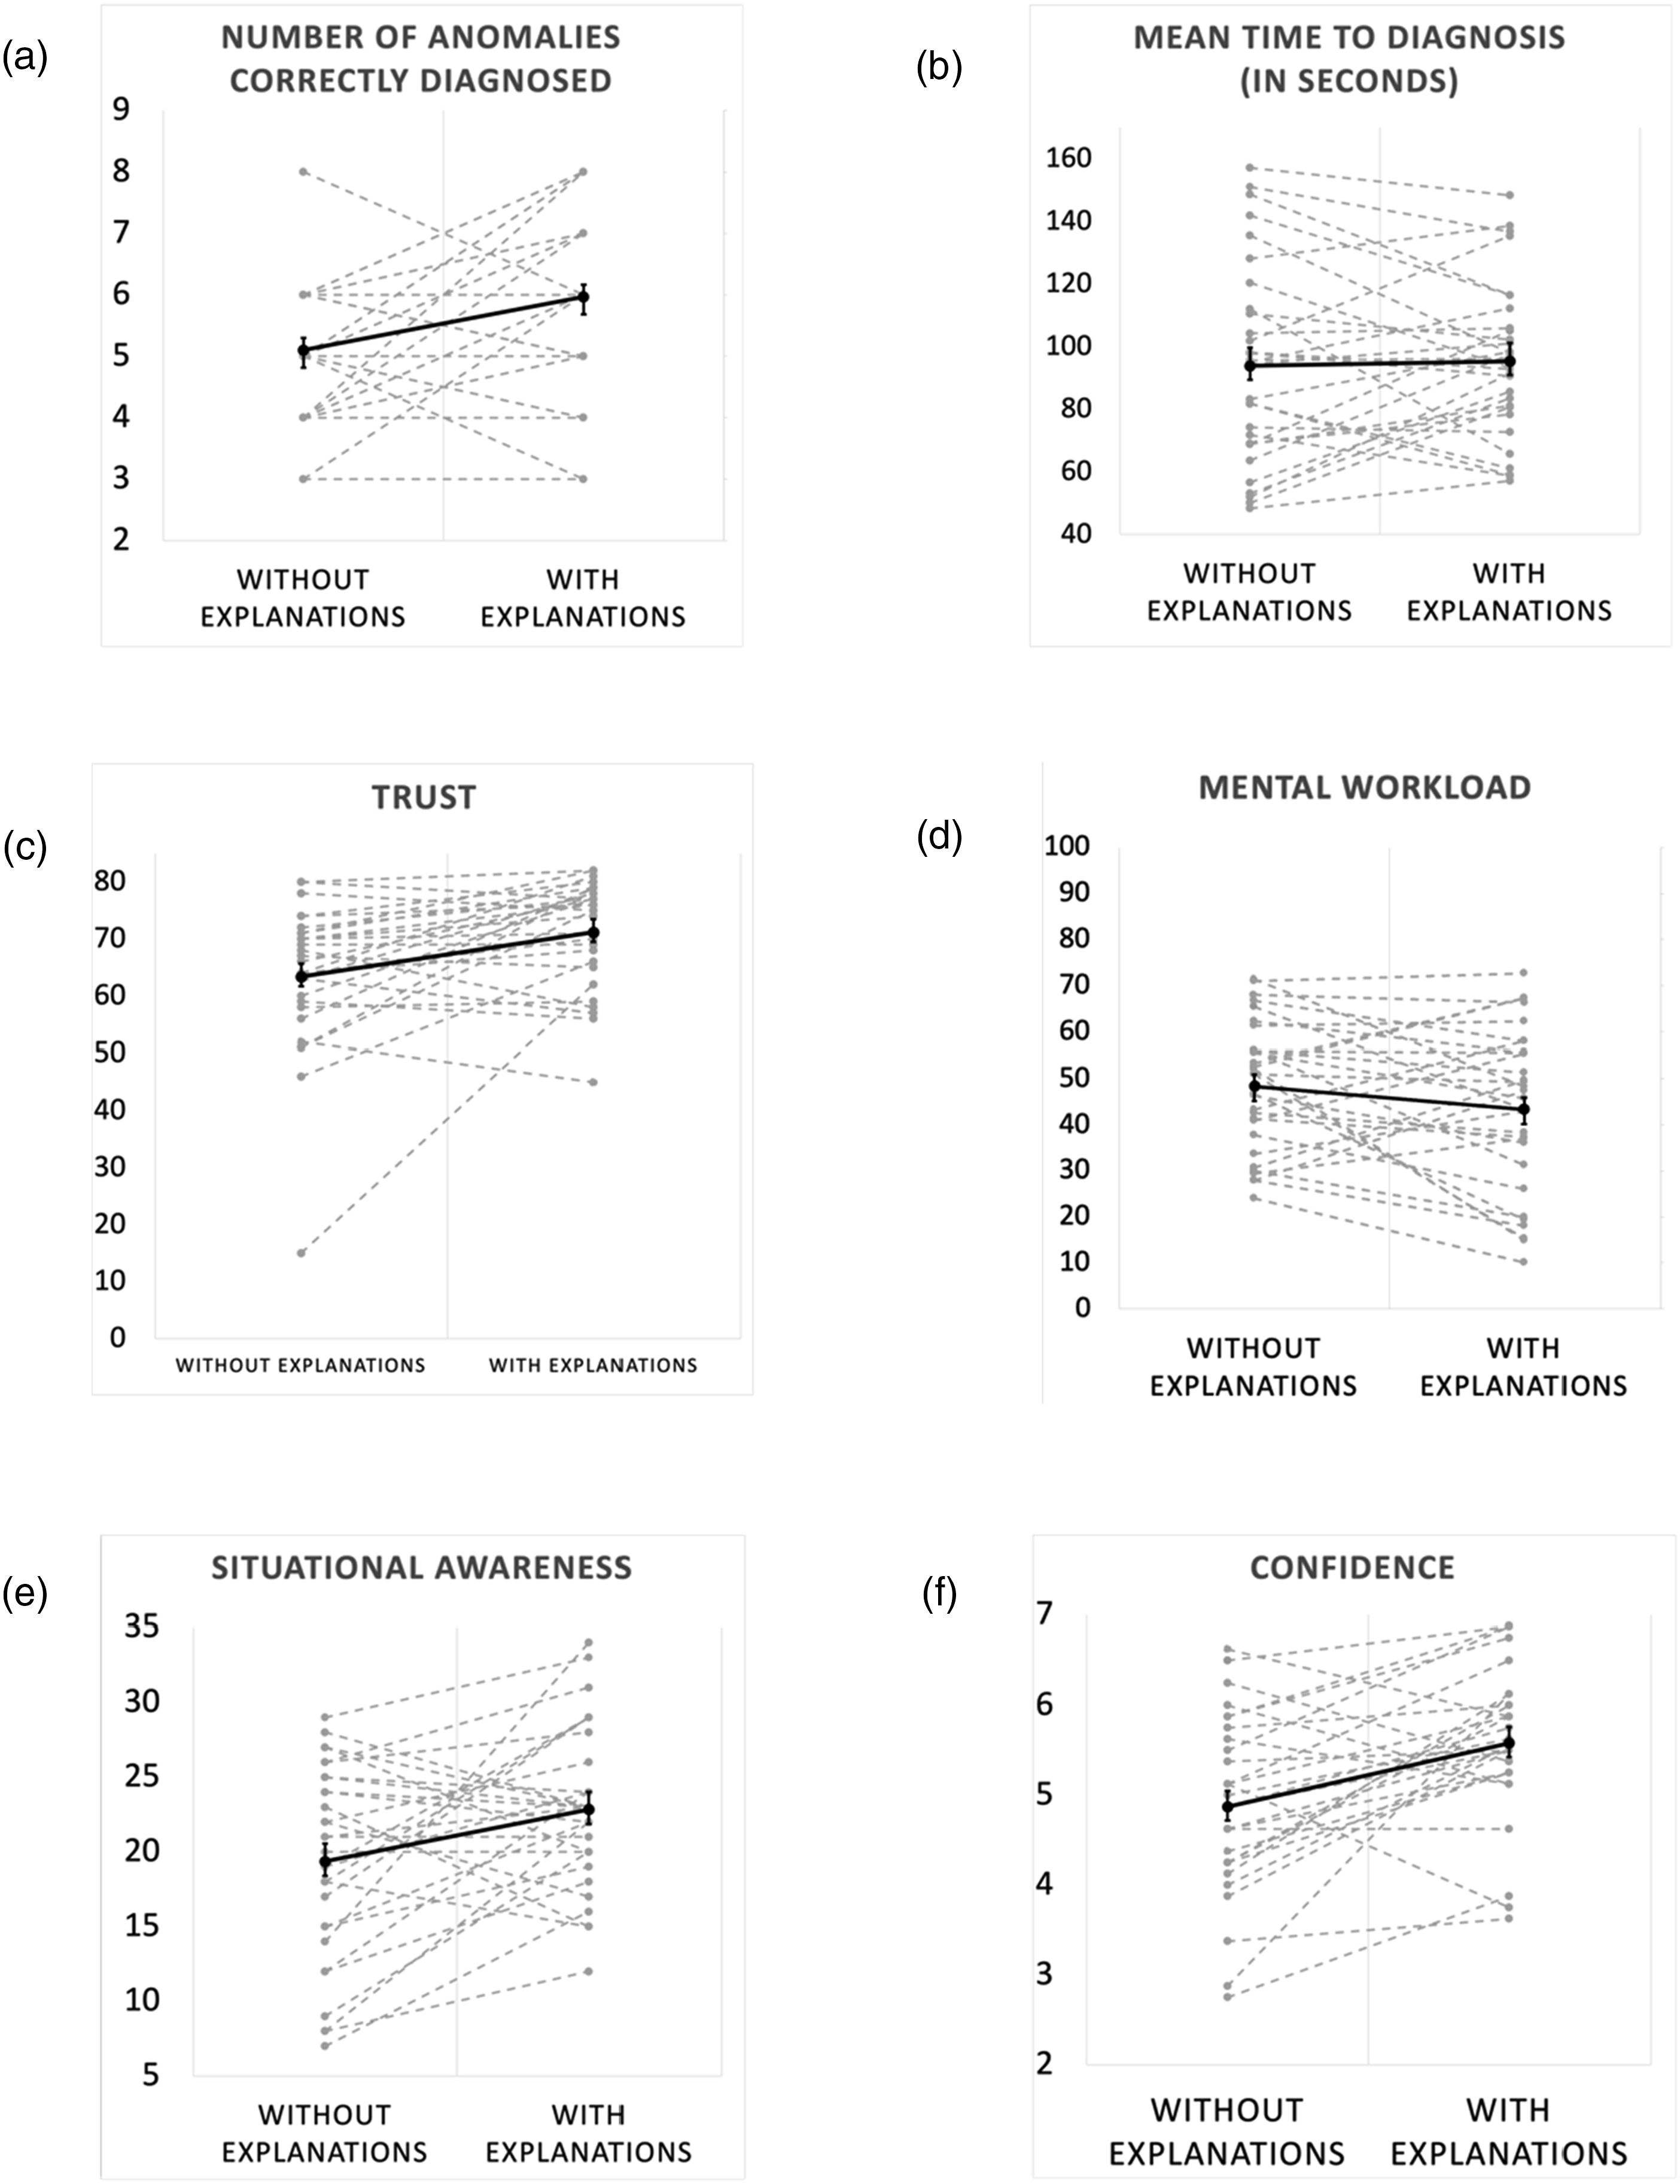
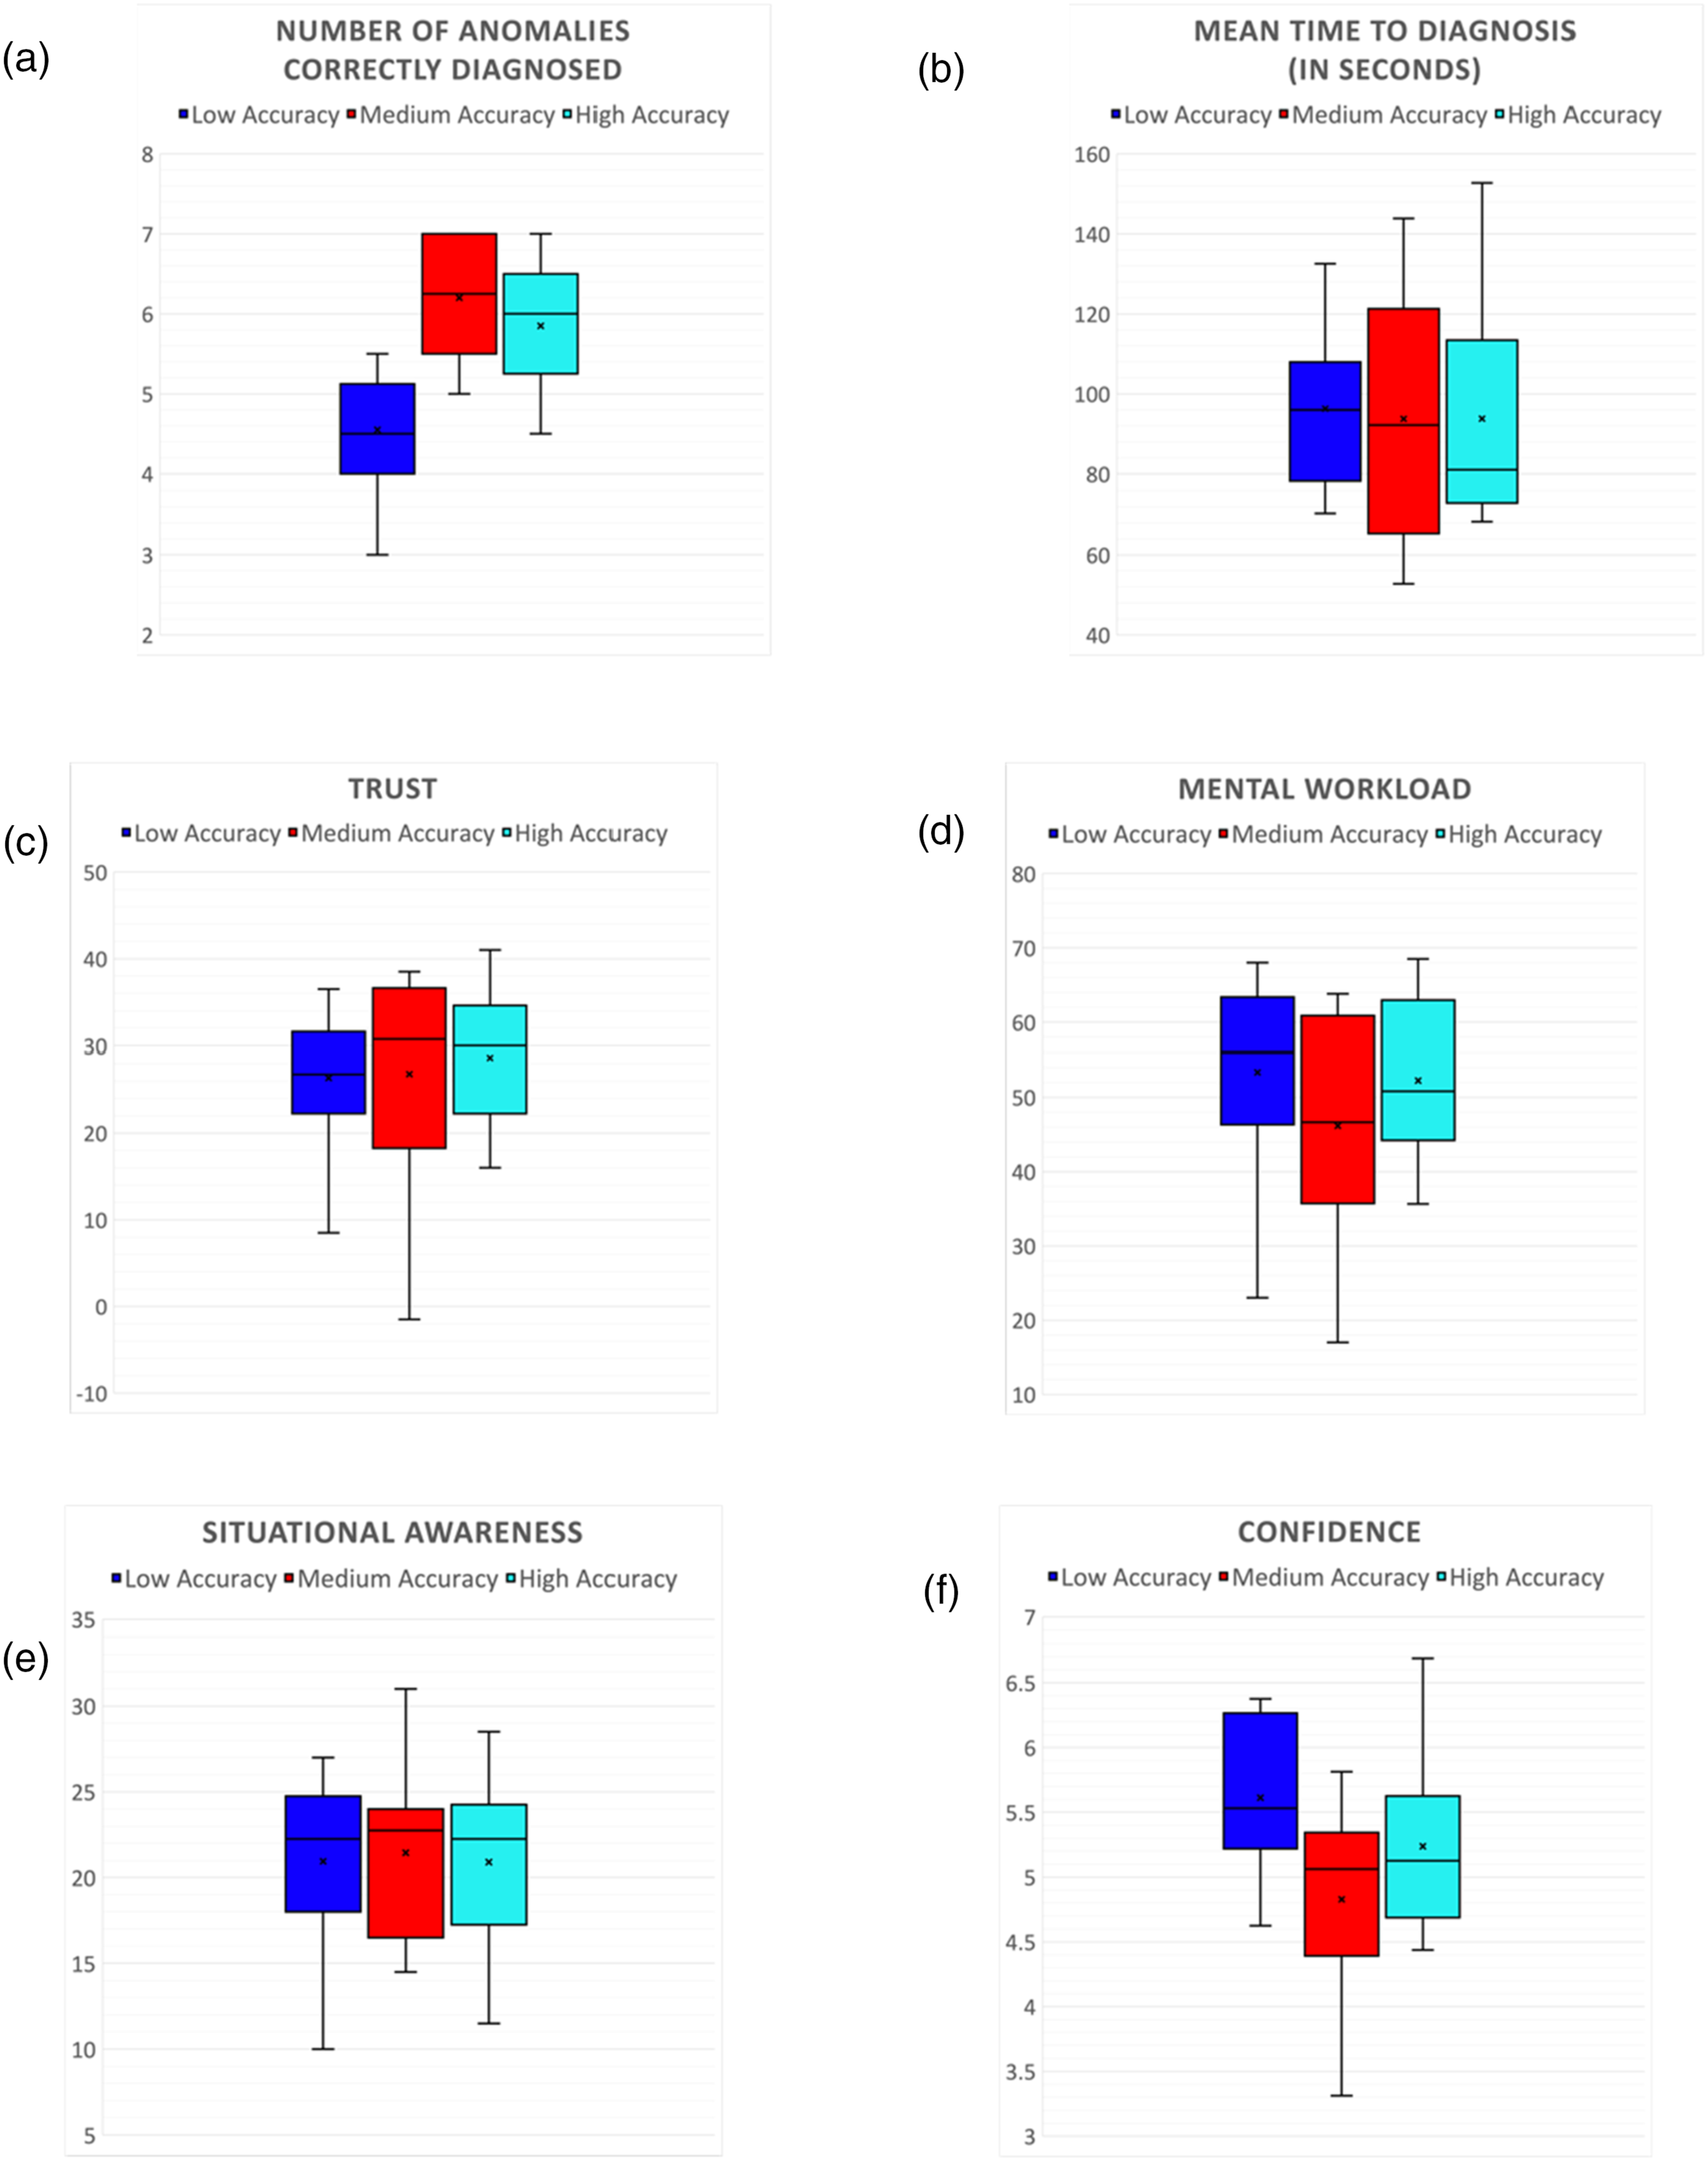
The mean time taken by the subjects to diagnose all anomalies (out of the max 180 seconds) is shown in Figure 4(b). A two-way mixed ANOVA revealed that the main effect of transparency on the time taken to diagnose the anomalies was not significant [F(1, 54) = 0.03, p = .84]. On average, the participants took longer to diagnose anomalies with explanations (95.35 ± 4.44) than without explanations (93.86 ± 5.85). The main effect of accuracy on the time taken to diagnose the anomalies was also not significant [F(2, 54) = 0.04, p = .95]. The mean time taken to diagnose all anomalies (out of the max 180 seconds) by participants in each accuracy group is shown in Figure 5(b). On average, the subjects in the High Accuracy group took the least amount of time to diagnose anomalies (93.79 ± 9.17), followed by the Medium Accuracy group (93.75 ± 9.63), and Low Accuracy group took the longest time to diagnose anomalies (96.28 ± 6.19). The interaction effect between transparency and accuracy was not found to be statistically significant [F(2, 54) = 0.02, p = .97].
Trust
In the statistical analysis conducted for Trust, outliers were identified in boxplot analysis, resulting in the identification of one extreme value. We performed the analysis both including and excluding the outlier from the analysis. The results showed that removing the outlier did not significantly affect the outcome of the results. Subsequently, this outlier was excluded from further analysis. Figure 4(c) summarizes the results of the Jian’s trust in automation survey score. A two-way mixed ANOVA revealed that there was a significant main effect of transparency on trust [F(1, 54) = 7.11, p = .01]. On average, participants trusted the AI agent more in sessions with explanations (71.16 ± 1.69) than in sessions without explanations (63.36 ± 2.31). The effect size for this analysis (d = 0.70) was found to exceed Cohen’s (1988) convention for a medium effect (d = 0.50). The main effect of accuracy on trust was not found to be significant [F(2, 54) = 0.23, p = .79]. Figure 5(c) shows the average values of trust reported by the subjects in each accuracy group. On average, the subjects in the High Accuracy group were most trusting of the agent (68.65 ± 2.41), followed by the Medium Accuracy group (66.8 ± 3.89), and Low Accuracy group was the least trusting group (66.35 ± 2.54). The interaction effect between transparency and accuracy was not found to be statistically significant [F(2, 54) = 0.65, p = .52].
Mental Workload
Figure 4(d) shows the results of the analysis of MW. A two-way mixed ANOVA revealed that the main effect of transparency on MW was not significant [F(1, 54) = 1.76, p = .18]. The overall MW was found to be lower in the sessions with explanations (43.34 ± 3.22) compared to when explanations were not available (48.41 ± 2.54). The main effect of accuracy on MW was found to be significant [F(2, 54) = 3.65, p = .03]. The mental workload reported by the participants in each accuracy group is shown in Figure 5(d). On average, the subjects in the Low Accuracy group (47.86 ± 5.02) had the highest MW, followed by High Accuracy group (47.2 ± 3.85), and Medium Accuracy group (42.56 ± 4.51) had the lowest MW of the three groups. However, post-hoc comparisons using t-tests with Bonferroni corrections indicated that the mean scores for the groups were not different. The interaction effect between transparency and accuracy was not found to be statistically significant [F(2, 54) = 2.92, p = .05].
Situational Awareness
Figure 4(e) summarizes the results of the SART survey. A two-way mixed ANOVA revealed that the main effect of transparency on SA was significant [F(1, 54) = 5.21, p = .02]. The total SA was found to be significantly higher in the sessions with explanations (22.83 ± 0.98) than in the sessions without explanations (19.36 ± 1.18). The effect size for this analysis (d = 0.58) was found to exceed Cohen’s (1988) convention for a medium effect (d = 0.50). The main effect of accuracy on SA was not found to be significant [F(2, 54) = 0.05, p = .94]. The SA reported by the participants in each accuracy group is shown in Figure 5(e). On average, the subjects in the Medium Accuracy group (21.45 ± 1.58) had the highest SA, followed by Low Accuracy group (20.95 ± 1.61), and High Accuracy group (20.9 ± 1.58) had the lowest SA of the three groups. The interaction effect between transparency and accuracy was not found to be statistically significant [F(2, 54) = 0.053, p = .94].
Confidence
Figure 4(f) summarizes the aggregated score of every subject’s self-reported confidence score post-anomaly diagnosis. A two-way mixed ANOVA revealed that the main effect of transparency on confidence was significant [F(1, 54) = 10.22, p = .002]. User confidence was found to be significantly higher in the sessions with explanations (5.58 ± 0.15) than in the sessions without explanations (4.87 ± 0.17). The effect size for this analysis (d = 0.78) was found to exceed Cohen’s (1988) convention for a medium effect (d = 0.50). The main effect of accuracy on user confidence was found to be significant [F(2, 54) = 4.16, p = .02]. Figure 5(f) shows the average confidence reported by the subjects in each accuracy group. On average, the subjects in the Low Accuracy group (5.61 ± 0.18) had the highest confidence, followed by High Accuracy group (5.23 ± 0.22), and Medium Accuracy group (4.82 ± 0.26) had the lowest confidence of the three groups. Post-hoc comparisons using t-tests with Bonferroni corrections indicated that the mean scores for the groups were not different. The interaction effect between transparency and accuracy was not found to be statistically significant [F(2, 54) = 1.34, p = .26].
Discussion
Impact of Explanations
Overall, results show that explanations have a strong positive effect on performance, trust, situational awareness, and confidence, thus supporting H1. In fact, results show a stronger influence of explanations than accuracy on most metrics. Breaking it down by metric, performance results reveal that users’ task performance is improved when an intelligent agent like Daphne provides explanations to the user. This is also consistent with previous literature (Linder et al., 2021; Schemmer et al., 2022; Silva et al., 2023). Explanations helped users diagnose more anomalies accurately without significantly impacting the time to diagnosis compared to when no explanations are provided. This may be because all the important relevant information that can help the user make an informed decision for diagnosing an anomaly is provided to the user in a concise tabular form in the sessions with explanations. A significant part of the cognitive effort of gathering relevant information about an anomaly, organizing it appropriately, forming a mental model of the diagnostic process, and generating and ranking promising anomaly options is already performed for them in the session where Daphne provides descriptive explanations for diagnoses. This was confirmed by the analyzing the subjects’ MW. Although agent transparency did not affect subjects’ MW significantly, on further analyzing the sub-dimensions of MW, we found that the “effort” sub-dimension was lower in sessions where Daphne provided explanations (57.66 ± 4.56) compared to when it didn’t (66.33 ± 3.66). A simple paired t test confirmed that this result is significant (p = .015). We also see an increasing trend in average MW of subjects in the sessions with explanations. Although the user has all the information they need to diagnose an anomaly in a readily available form in sessions with explanations, they still must process all the information on the screen in a limited amount of time. This can lead to a compounded effect due to temporal and performance pressure on the subjects. Prior research has shown that MW can increase as the amount of information that is displayed to an operator increases (Mercado et al., 2016). This is due to an increased demand in information-processing, especially when MW and effort required for the task are high (Helldin & Avhandling, 2014; Zuk & Carpendale, 2007). While our data did not show a significant impact in MW from explanations, a larger sample could have shown a significant effect.
Trust results also show an improvement with explanations, which is also consistent with the literature. Faithful explanations enhance the user’s understanding of the system and increase user’s reliance on the agent (Lipton, 2016; Vilone & Longo, 2021), leading to an improvement in trust and building user’s confidence in the agent and their own decisions over time. SA results support hypothesis H1 that the explanations will improve the SA of the subjects. Results suggest that the subjects had a significantly higher Understanding in sessions with explanations (13.46 ± 3.13) compared to the session without explanations (10.86 ± 3.70). This may be because the symptom comparison table in session with explanation provides a list of symptoms that contribute to the likelihood score calculation for the probable anomalies in Daphne’s diagnosis. Having this data-driven information readily available to the user helps them understand how Daphne prioritizes the anomalies. This result is in line with previous works in the field of automation and explainable AI (Avetisyan et al., 2022; Paleja et al., 2022). Confidence was also found to be significantly higher in sessions with explanations as hypothesized in H1, which is consistent with the literature (Le Bras et al., 2018).
Impact of Accuracy
Results show that subjects in the Low Accuracy group solved fewer anomalies than the High and Medium accuracy groups. In addition, the Low accuracy group also took longer time on average to diagnose anomalies, although not significantly so. Post-hoc analysis revealed that Low Accuracy group was significantly different from Medium and High Accuracy groups for number of anomalies diagnosed. However, the trends suggest that Medium Accuracy group did better in the tasks than the High Accuracy group. This result is not consistent with our hypothesis. This could be due to the users being disengaged from the task in High Accuracy scenarios. In our study, the users were more engaged in the task in the Medium Accuracy group compared to the High Accuracy group, where the users quickly learned that the AI agent’s recommendations were always accurate leading them to get disengaged from the task. Medium Accuracy seemed to be the sweet spot where the users performed well compared to the other groups. Previous literature has shown that there is a direct relationship between operator engagement and performance (Hancock & Verwey, 1997; Van Acker et al., 2018; Yerkes & Dodson, 1908). Operator performance increases with arousal up to a certain point. Too high or too low of an arousal, physiological or mental, could be detrimental to task performance. The results for Trust did not satisfy our hypothesis in H2. Even though the trends suggest that the High Accuracy group had the highest average trust, followed by Medium Accuracy and Low Accuracy, the results were not significant enough to make a conclusion. These results are not consistent with previous work on the topic (Papenmeier et al., 2019; Yin et al., 2019). One reason to explain this could be that the difficulty of the anomaly scenarios was too high for the subjects to ascertain Daphne’s reliability. Previous studies have shown that users tend to rely more on the decision-aids such as AI, when the task gets increasingly more difficult, irrespective of the accuracy of these aids (Elder et al., 2024; Parkes, 2017). In our study, the difficulty of the anomaly scenarios, including the uncertainty of the diagnosis within a session, could be masking the effects of accuracy of Daphne, making the subject comply with Daphne’s suggestions. Another reason could be the way we designed the inaccurate scenarios in our system. We created an inaccurate scenario by taking an existing scenario and making some changes to its parameters in Daphne’s database so that it would lead to an “incorrect diagnosis” when the experimenter injects the anomaly from the simulator. However, from the point of view of Daphne and the user, this is a scenario that exists, but it does not match any known signatures. The results for MW and SA are the most puzzling and do not satisfy H2 at all. MW trends show that the users experienced high MW in Low Accuracy (53.36 ± 4.16) groups, followed by High Accuracy (52.26 ± 3.67) and then the Medium Accuracy (46.16 ± 4.88) groups, although not significantly so. SA was found to be the highest in Medium Accuracy Group (21.45 ± 1.58), followed by Low Accuracy (20.95 ± 1.61) group and the High Accuracy group (20.90 ± 0.58), which had the lowest SA. For MW, high cognitive load for Low Accuracy group makes sense. High Accuracy group having a higher cognitive load than Medium Accuracy group could be explained by the fact that users in High Accuracy group may be expecting the AI agent to be inaccurate, since the subjects did not know which group they were placed. For SA, again, it seems like Medium Accuracy (75% accuracy) group was the sweet spot for the users. The users in Low Accuracy group (5.61 ± 0.18) had a high confidence compared to the users in the Medium (4.82 ± 0.26) or High Accuracy (5.23 ± 0.2) groups. These effects of accuracy on user confidence as hypothesized in H2 were only partially significant, possibly due to a small sample size. These results are not consistent with our hypothesis H2. Results suggest that agent accuracy has a significant effect on user confidence as well as hypothesized in H2. These results are consistent with previous research on this topic (Chong et al., 2022; Ma et al., 2024). However, even though the trends show that Low Accuracy group had the highest user confidence compared to the other two groups, the post-hoc results were inconclusive on which groups were significantly different.
Interaction Between Transparency and Accuracy
Interaction effects between transparency and accuracy was not found to be significant for any of our independent variables.
Summary
In summary, our experiment was able to establish a relationship between an agent’s explanations and operator performance in AI-assisted anomaly diagnosis tasks. The results reveal that the transparency (in the form of explanations) of an AI agent has a larger and significant influence on performance, trust, SA, and confidence of a user than its accuracy. Results also indicate that explanations improve user’s performance, trust, and SA without significantly affecting the mental workload.
Limitations and Future Work
While our research suggests how impactful the role of explanations can be in diagnostic decision-making tasks, there are several limitations in our study. First, we only used two specific types of explanations: knowledge-driven and historical data-driven explanations. While these types of explanations were reasonable for the task, other explanations could be developed and may have different effects. For example, if the explanations provided too much information, it could lead to information overload. Moreover, the effect of other approaches to achieve transparency that do not require explicit explanations should be explored in future work. Previous work (Poursabzi-Sangdeh et al., 2021) has shown that having depth in explanations is not enough to improve a user’s trust in a model. A combination of various types of explanations, for example, graphical, feature importance, interactive, example-based can help the users identify important features, trends, or outliers in data, facilitating a deeper understanding of the agent’s outputs. Moreover, the amount of detail in an adequate explanation likely depends on the amount of time the user will have to read the explanation. If the goal of the user is to discover new information or analyze the information presented by the agent for an urgent time-critical task, then textual and tabular explanations like the ones designed for our experiment might not be the most efficient way to represent knowledge to the user.
Another limitation of our study was in the choice of the anomaly scenarios. We developed the anomaly scenarios, to the best of our ability, to be realistic and of equal difficulty levels for a given level of uncertainty. However, it is difficult to assess the difficulty of diagnosis of an anomaly 11 scenario based on its number of symptoms, its similarity to other potential anomalies, user’s preference of type of explanations provided, and so on. In general, it is hard to know if the results would hold for other anomaly scenarios that were more or less complex.
In this study, the main measures of trust, MW, and SA were taken after every session as opposed to after every anomaly. As a result, scenario uncertainty (i.e., agent confidence) was only studied as a secondary objective due to the limitations in the experimental design. Future work should investigate more deeply how uncertainty affects performance and trust including its interaction with explanations and accuracy. Future work should also include a more fine-grained anomaly-level study how user’s trust evolves over time depending on explanations, accuracy, and uncertainty in addition to investigating how the independent variables affect the reliance of the operator while making their decisions. Finally, the interaction between the agent and the human in this study was very simple and linear. Future work should study modes of human-agent collaborative diagnosis based on a more iterative process of accumulating evidence in which the agent can suggest actions to the user to gather more evidence and refine its diagnosis.
Conclusion
This work described the impact of explanations provided by an intelligent agent and their accuracy on users’ performance, trust, MW, and SA within the context of a time- and safety-critical cognitive task, namely, diagnosis anomalies in spacecraft during long-duration exploration missions. Results suggest that providing explanations is a promising approach for intelligent agents to improve human performance SA, trust, and confidence without significantly affecting their MW in anomaly diagnosis tasks.
Applications
The goal of this study is to contribute to the development of intelligent diagnostic agents that are reliable and trustworthy for space applications. Intelligent agents like Daphne have an important role to play in future space missions that require more crew autonomy. The findings from this study will inform the development of standards and guidelines for the design and operation of intelligent assistants during time-sensitive crewed operations in space. The results from this study may also help formulate guidelines for the development of diagnostic and decision-making tools in other domains where similar human-computer interactions take place, such as in other remote and hazardous environments.
Footnotes
Acknowledgments
The authors would also like to thank the reviewers whose valuable comments improved this article.
Declaration of Conflicting Interests
The author(s) declared no potential conflicts of interest with respect to the research, authorship, and/or publication of this article.
Funding
This work is part of the Human Capabilities Assessments for Autonomous Missions (HCAAM) Virtual NASA Science Center of Research (VNSCOR), funded by the NASA Human Research Program, grant no. 80NSSC19K0656. The authors would like to thank all the participants for their time and commitment to this study.