
Abstract
Background. Three-dimensional (3D) photography provides a promising means of breast volumetry. Sources of error using a single-captured surface to calculate breast volume include inaccurate designation of breast boundaries and prediction of the invisible chest wall generated by computer software. An alternative approach is to measure differential volume using subtraction of 2 captured surfaces. Objectives. To explore 3D breast volumetry using the subtraction of superimposed images to calculate differential volume. To assess optimal patient positioning for accurate volumetric assessment. Methods. Known volumes of breast enhancers simulated volumetric changes to the breast (n = 12). 3D photographs were taken (3dMDtorso) with the subject positioned upright at 90° and posteriorly inclined at 30°. Patient position, breathing, distance and camera calibration were standardised. Volumetric analysis was performed using 3dMDvultus software. Results. A statistically significant difference was found between actual volume and measured volumes with subjects positioned at 90° (P < .05). No statistical difference was found at 30° (P = .078), but subsequent Bland–Altman analysis showed evidence of proportional bias (P < .05). There was good correlation between measured and actual volumes in both positions (r = .77 and r = .85, respectively). Univariate analyses showed breast enhancer volumes of 195 mL and 295 mL to incur bias. The coefficient of variation was 5.76% for single observer analysis. Conclusion. Positioning the subject at a 30° posterior incline provides more accurate results from better exposure of the inferior breast. The subtraction tool is a novel method of measuring differential volume. Future studies should explore methodology for application into the clinical setting.
Introduction
Breast reconstruction forms a significant aspect of the breast cancer treatment process and has shown to improve breast cancer outcomes. 1 Standards have evolved to such that surgeons are expected to create breast mounds that appear natural, aesthetically pleasing and correspond to the premorbid or contralateral breast.2,3 Patients often undergo revision and symmetrisation procedures in order to achieve the desired outcome, which has shown to influence the psychosocial well-being of patients.4,5 Despite these demands, the available methods for objective aesthetic evaluation of breast reconstruction remain limited. 6
Breast volume is a potentially useful metric that can guide surgical practice; however, obtaining an accurate and reproducible measurement remains a challenge.7-9 Whilst numerous methods of volumetric assessment of the breast are described, traditional methods are limited in their reliance on predefined geometric shapes, lack of correspondence to individual breast anatomy and underestimation of lateral breast tissue.10-16 Computed tomography 17 and magnetic resonance imaging (MRI) 10 are considered the most accurate; however, the cost, radiation exposure and expertise required for volumetric analysis are limiting factors. 18 Furthermore, the time constraints of a busy clinic and the inconvenience or discomfort caused to patients make these methods impractical in a clinical setting.
Advancements in three-dimensional (3D) surface imaging technology have provided an alternative means of volumetric assessment that has been used to good effect in specialties such as craniomaxillofacial surgery. 19 Compared to other methods, 3D photography is attractive in that it is non-invasive, acquisition time is speedy and there are a variety of software tools designed to aid analysis. 20 Breast volume can be obtained using a single 3D image onto which breast boundaries are manually delineated. The posterior boundary of the chest wall is generated by software to calculate breast volume. This method, henceforth referred to as the “single-surface method”, purposes to give an “absolute volume” (AV) of the breast. AVs can help surgeons to objectively assess breast asymmetry and guide selection of reconstruction modalities. However, there are inherent limitations to this method, including the lack of accuracy in outlining breast boundaries and the requirement for computer software to predict chest wall curvature. When used to assess a change in volume (eg after reconstruction) by subtracting 2 volumes obtained using this method, the error incurred is 2-fold. We present a novel method that bypasses these limitations using the subtraction tool between two 3D surface images to obtain a “differential” breast volume.
Methods
Six volunteers (n = 12 breasts) of breast cup sizes A to DD and no history of breast surgery were recruited for the study. Four pairs of breast enhancers of varying sizes (Jo Thornton 21 ) were used to simulate 5 volumetric changes of the breast. The breast enhancers were held adjacent to the breast using a brassiere that allowed visualisation of the medial contours of the breast. 3D photographs were taken using the 3dMDtorso static system (3Q Technologies Inc, Atlanta, Georgia), designed to capture 190° of the torso and breast in a single synchronised capture at a speed of 1.5 ms. 22
3D Photograph Acquisition Protocol
Subjects were positioned at a standardised distance away from the camera, ensuring that the lateral borders of the breast were visualised. The camera was calibrated prior to the acquisition of photos using a standardised calibration target. Bony landmarks and breast borders were marked using white stickers. The folding method described by Lee et al 23 was adopted to outline the superior borders of the breast. Subjects were seated with their arms folded at the back of the chair. Prior to photo acquisition, subjects were asked to breathe in and out for 3 seconds, and photographs were taken with the subject held in expiration at the end of the 3 seconds. Two different positions were explored to determine its effect on accuracy. Subjects were placed upright with the back of the chair angled at 90°, then posteriorly inclined at 30°.
Volumetric Analysis
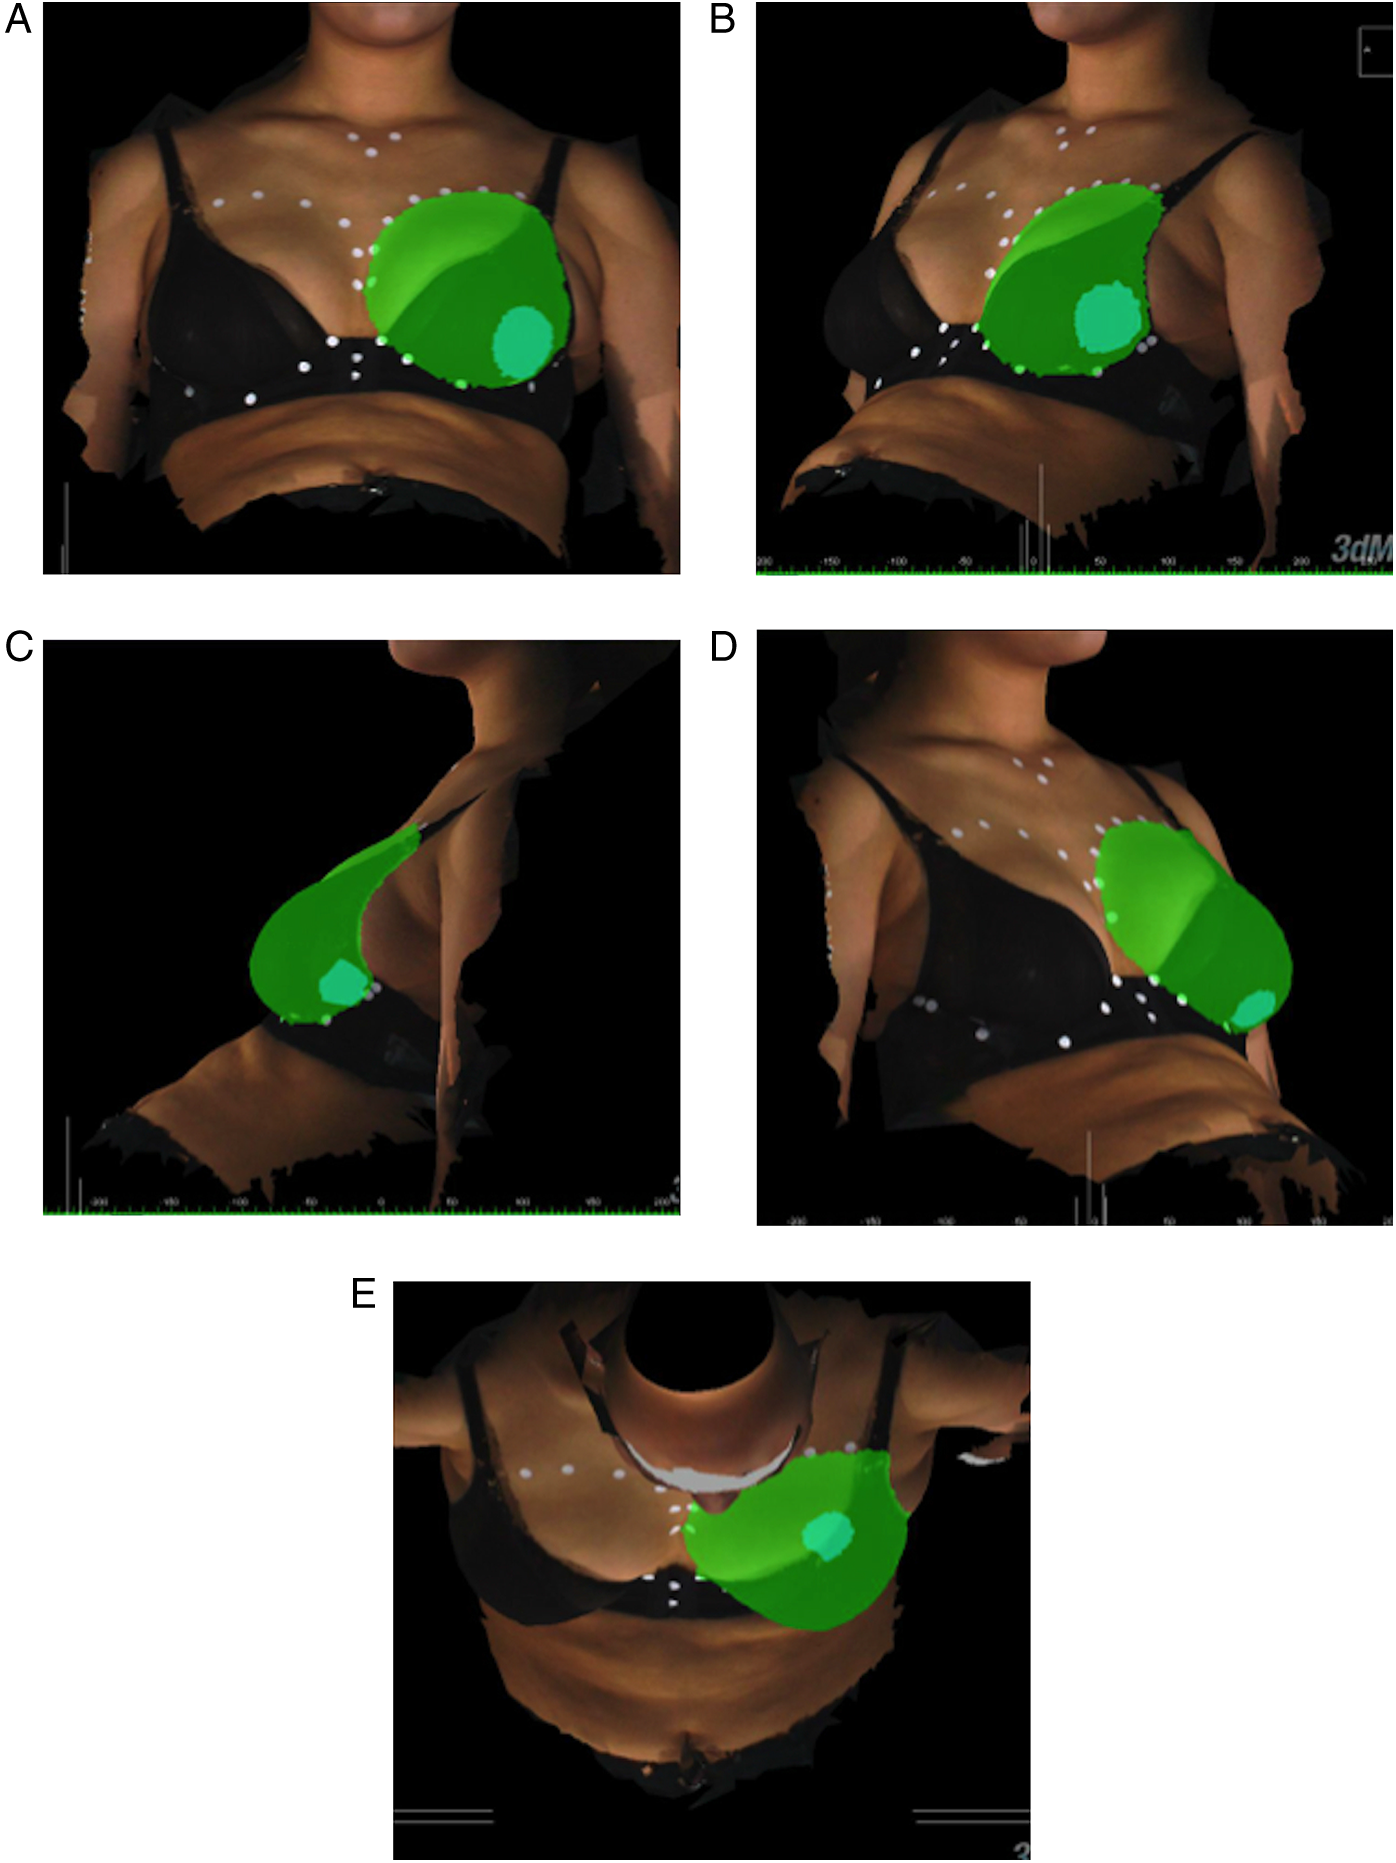
3dMDvultus software was used to calculate differential breast volume. Two images were selected and designated as a pre- and post-operative surface (Figures 1A and 1B). The surfaces were aligned manually in different angles (Figures 1C and 1D). Surface alignment was assessed qualitatively using the “Surface Difference Tool”, which computes surface difference statistics into a colour histogram to visualise overall surface deviation (Figure 2). A quantitative measure of variation was given using the “Surface Registration Tool”, which generates a root mean square (RMS) error value. An RMS cut-off value of <.5 mm was used to indicate an acceptable level of variation in the sternal region, selected as an area that is not expected to change with volumetric changes of the breast. The surface area of the breast was demarcated in anterior-posterior, oblique, lateral and superior views using the surface markings to guide surface area selection (Figure 3). Superimposition process using 3dMDvultus software. Three-dimensional images are shown in (A) oblique view, (B) lateral view, (C) anterior–posterior view and (D) horizontal view. Pre- and post-operative images are selected (A and B) and superimposed using arrow keys as shown in (C and D). Surface difference colour histogram. In well-aligned surfaces, the colour histogram can illustrate volumetric changes as shown here with increasing volumes of breast enhancer added (A-C). Volumetric analysis using 3dMDvultus software. The process of surface selection for volume calculation is illustrated in sequential order (A) anterior–posterior view, (B) oblique view, (C) lateral view, (D) contralateral oblique view and (E) horizontal view.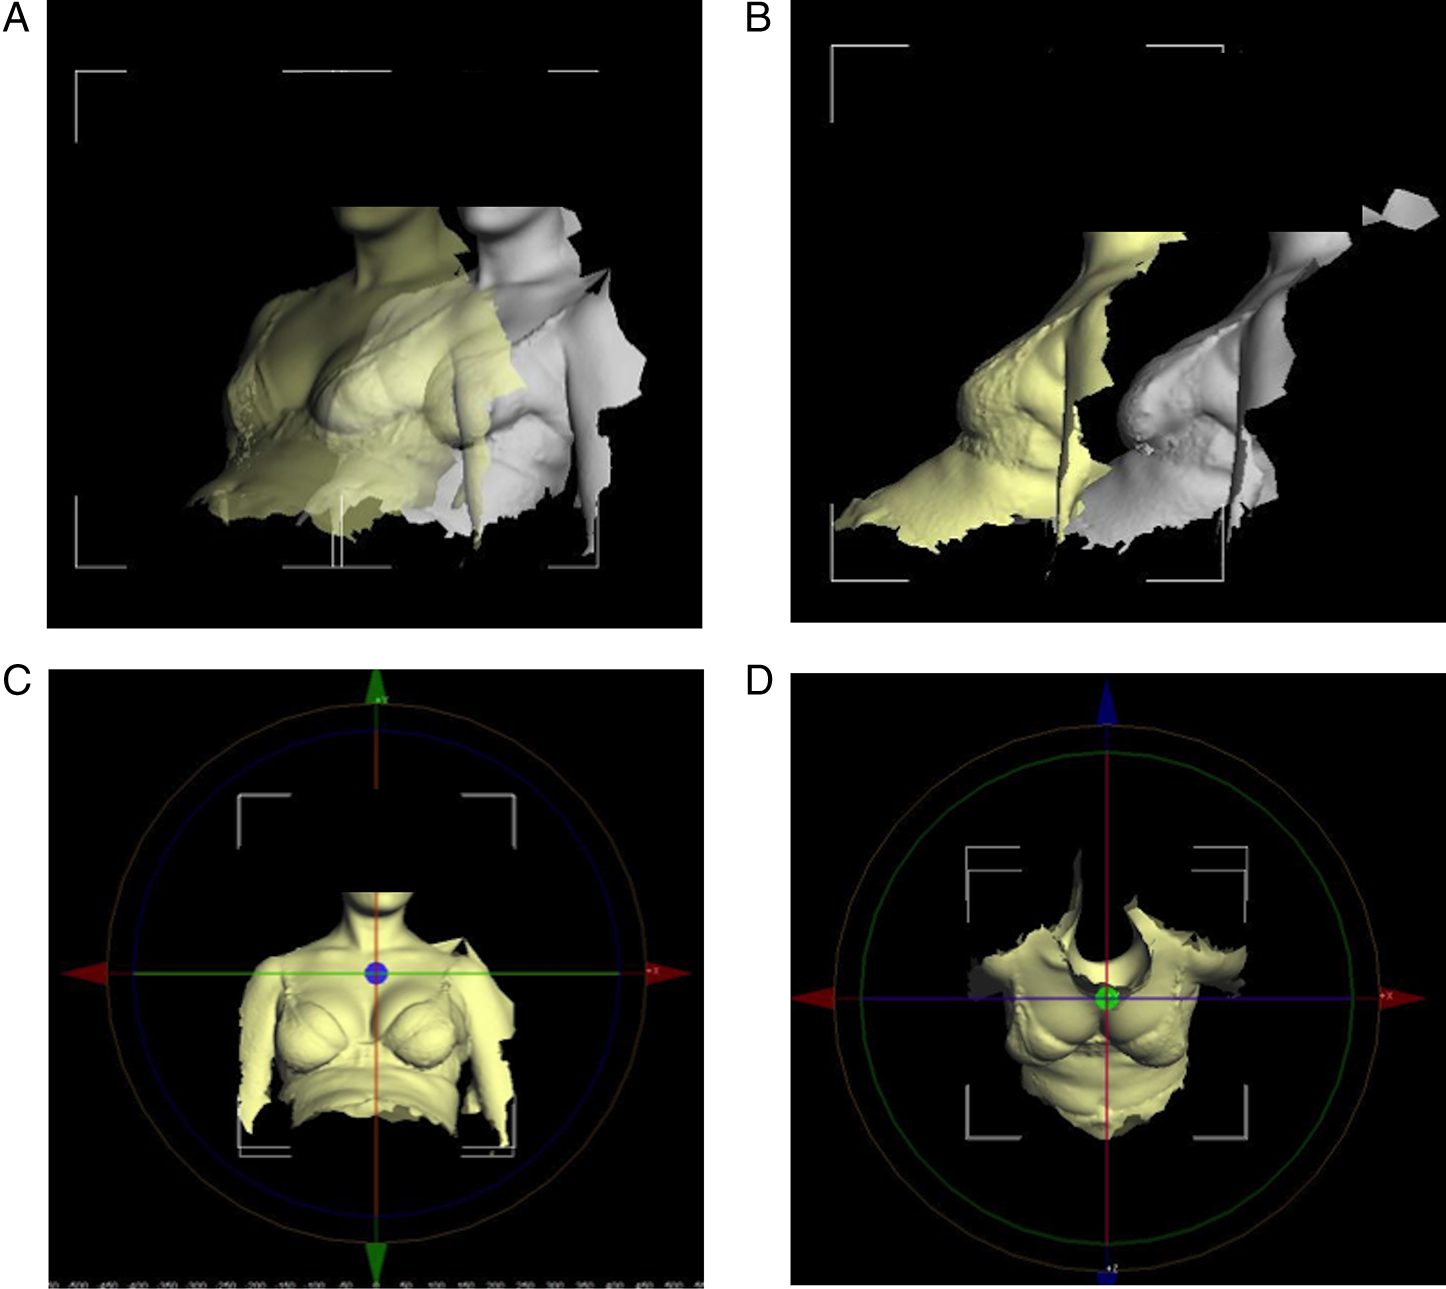

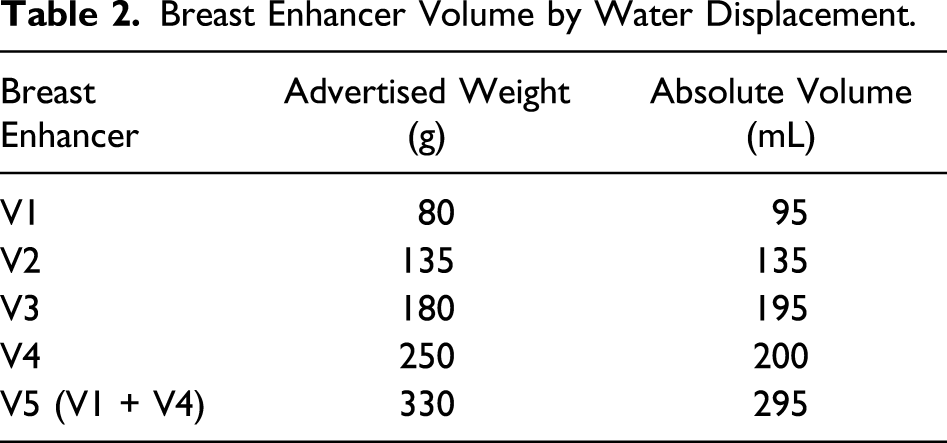
Breast enhancer AVs were obtained using the water displacement technique. For the purpose of blinding, this was performed only when all volumetric analyses were completed.
Statistical Analysis
Statistical analysis was performed using SPSS Version 24 for Windows. All tests were performed two-tailed, and a value of P < .05 was considered as statistically significant. Accuracy of the measured volumes as compared to the breast enhancer AVs was assessed using the paired Student’s t-test, where a P-value of <.05 would indicate a systematic difference between the volumes. The Bland–Altman plot was used to assess the agreement between measured and AVs. The Pearson correlation coefficient was used to assess the strength of correlation between measured and AVs. Univariable and multivariable linear regressions were performed to adjust for independent variables including subject age, body mass index (BMI), breast cup size, breast enhancer volume and RMS value. A multivariate analysis was performed if 2 or more independent variables were found to be significant. Reproducibility was assessed using the coefficient of variation (CV), expressed as a percentage of mean measured volume.
Results
Subject Demographics.
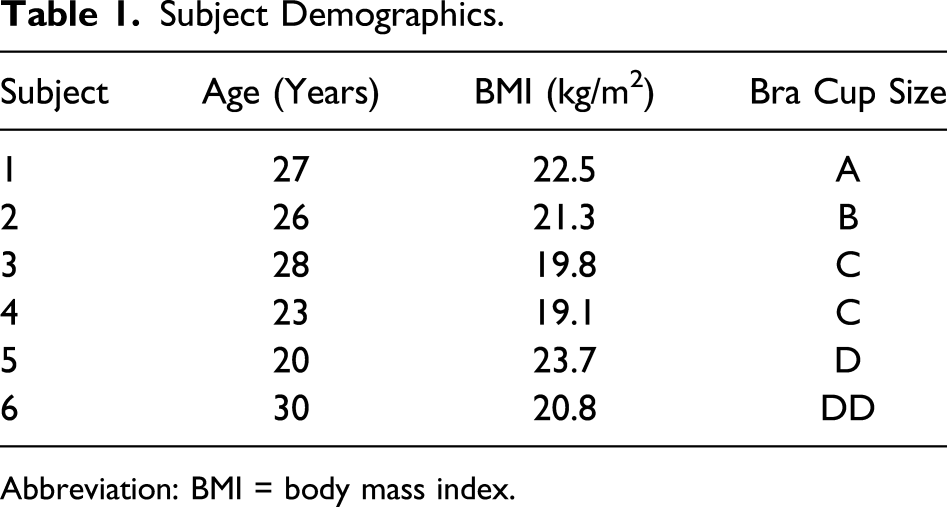
Abbreviation: BMI = body mass index.
Breast Enhancer Volume by Water Displacement.
Volumetric Analysis
Summary of Descriptive Data.
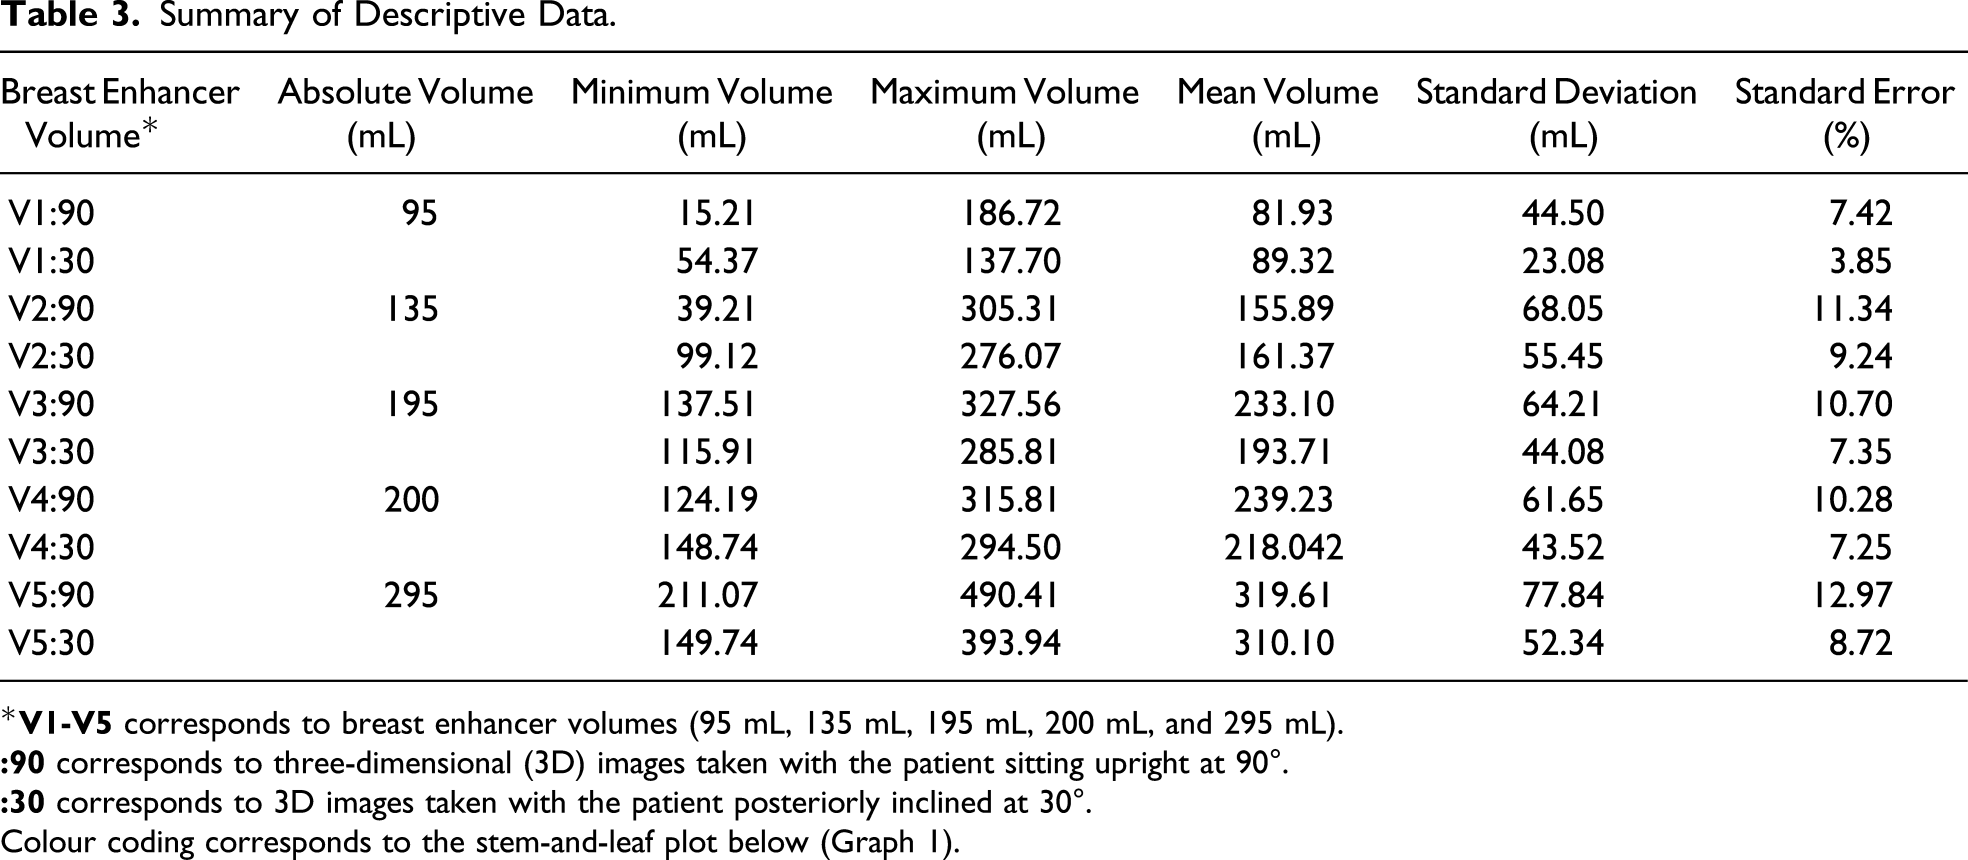
*
Colour coding corresponds to the stem-and-leaf plot below (Graph 1).
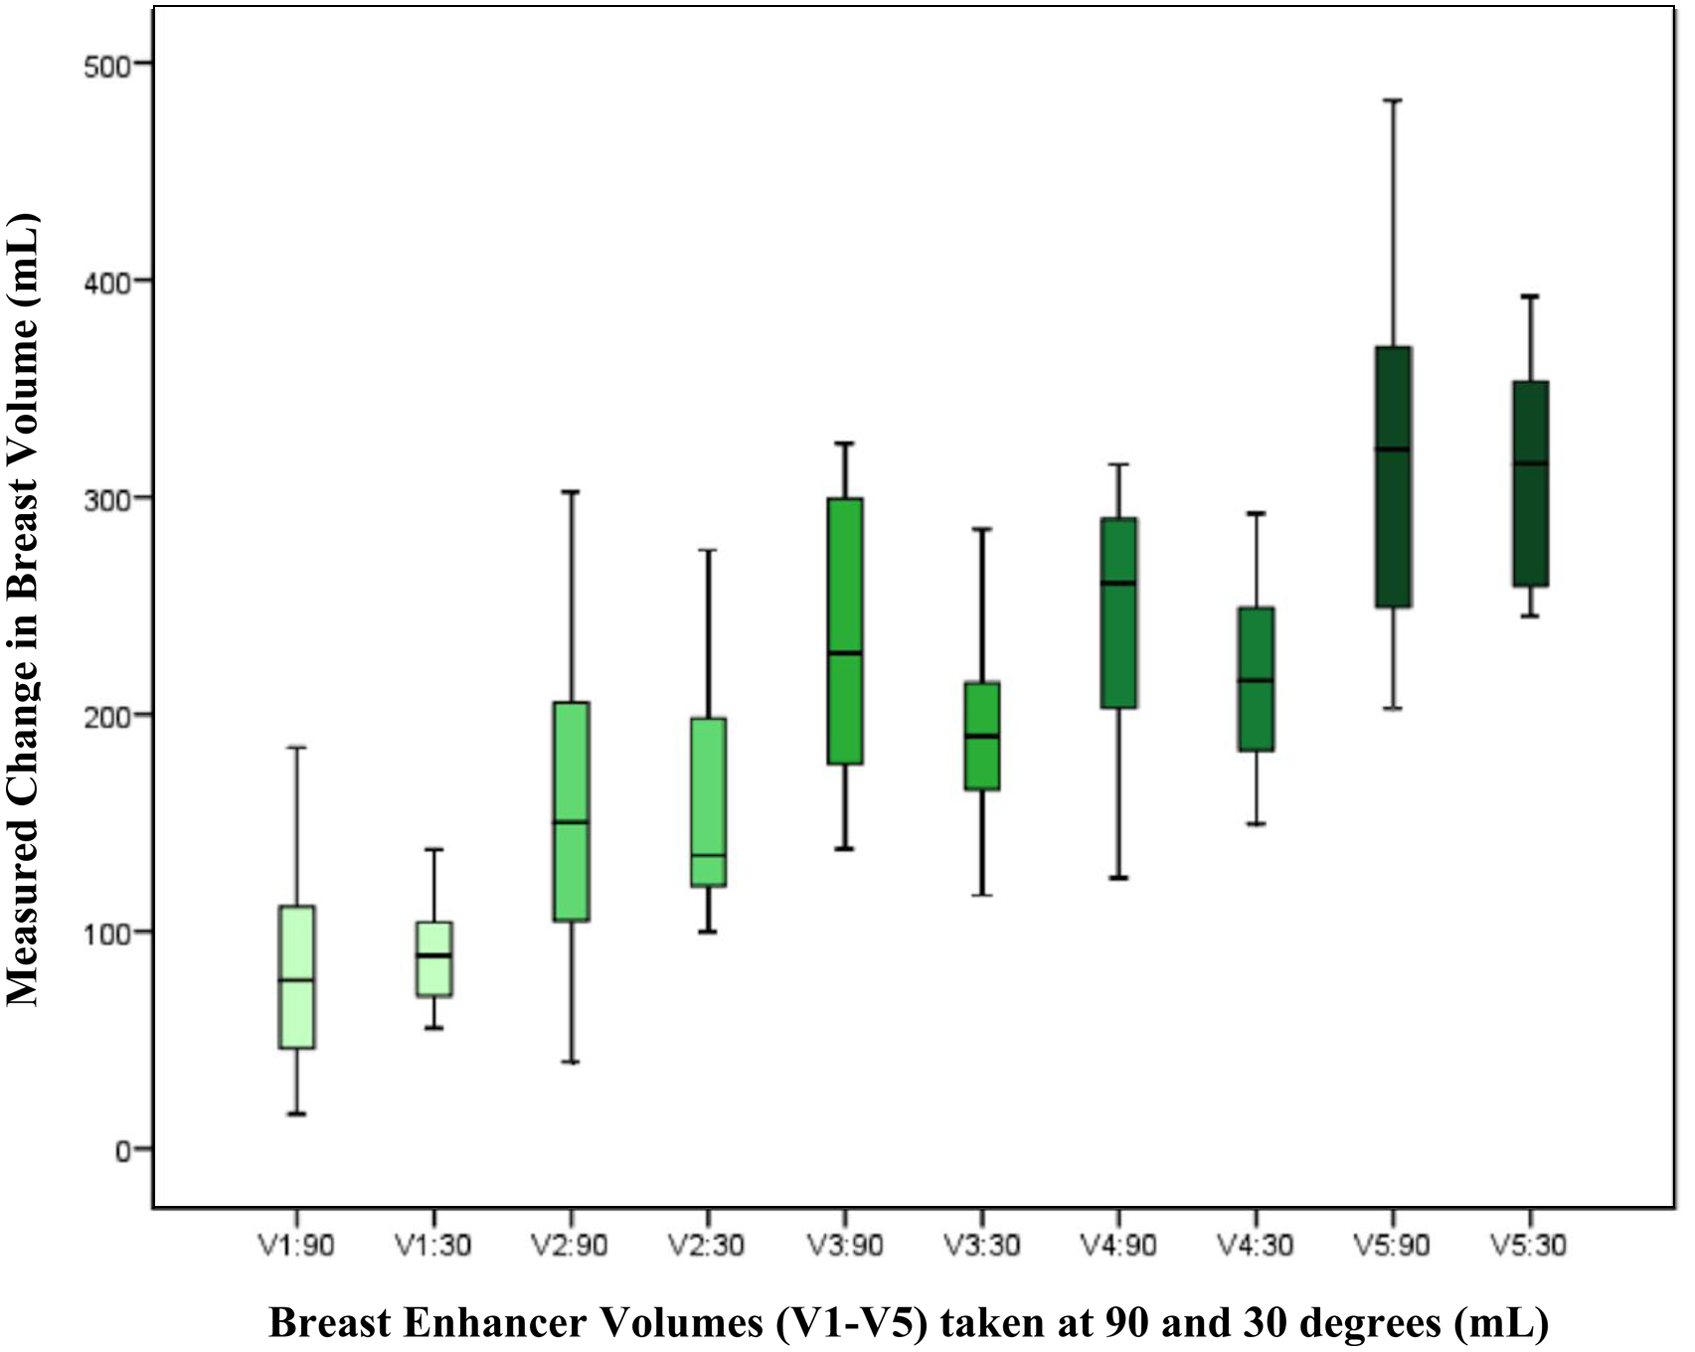
Stem-and-leaf plot showing the measured volumes obtained by 3D photography for each breast enhancer volume statistical analysis.
Accuracy
Paired t-test showed a statistically significant difference between the measurements of volume at 90° (V90) compared to the AV (P < .05, 95% CI −38.92 to 4.39). There was however no statistically significant difference between the measurements taken at 30° (V30) compared to AV (P = .078, 95% CI −22.25 to 1.23).
As there was a significant difference shown for AV and V90, the Bland–Altman plot was only performed to assess the level of agreement for AV and V30 (Graph 2). A mean relative difference of −10.51 mL and 95% CI of −99.57 to 78.56 was plotted. Linear regression analysis gave a statistically significant result (β = −.174; SD 15.19; P < .05), indicating evidence of proportional bias, although visually this is not obviously apparent. Bland-Altman plot comparing absolute volume and measured volumes at 30° (V30).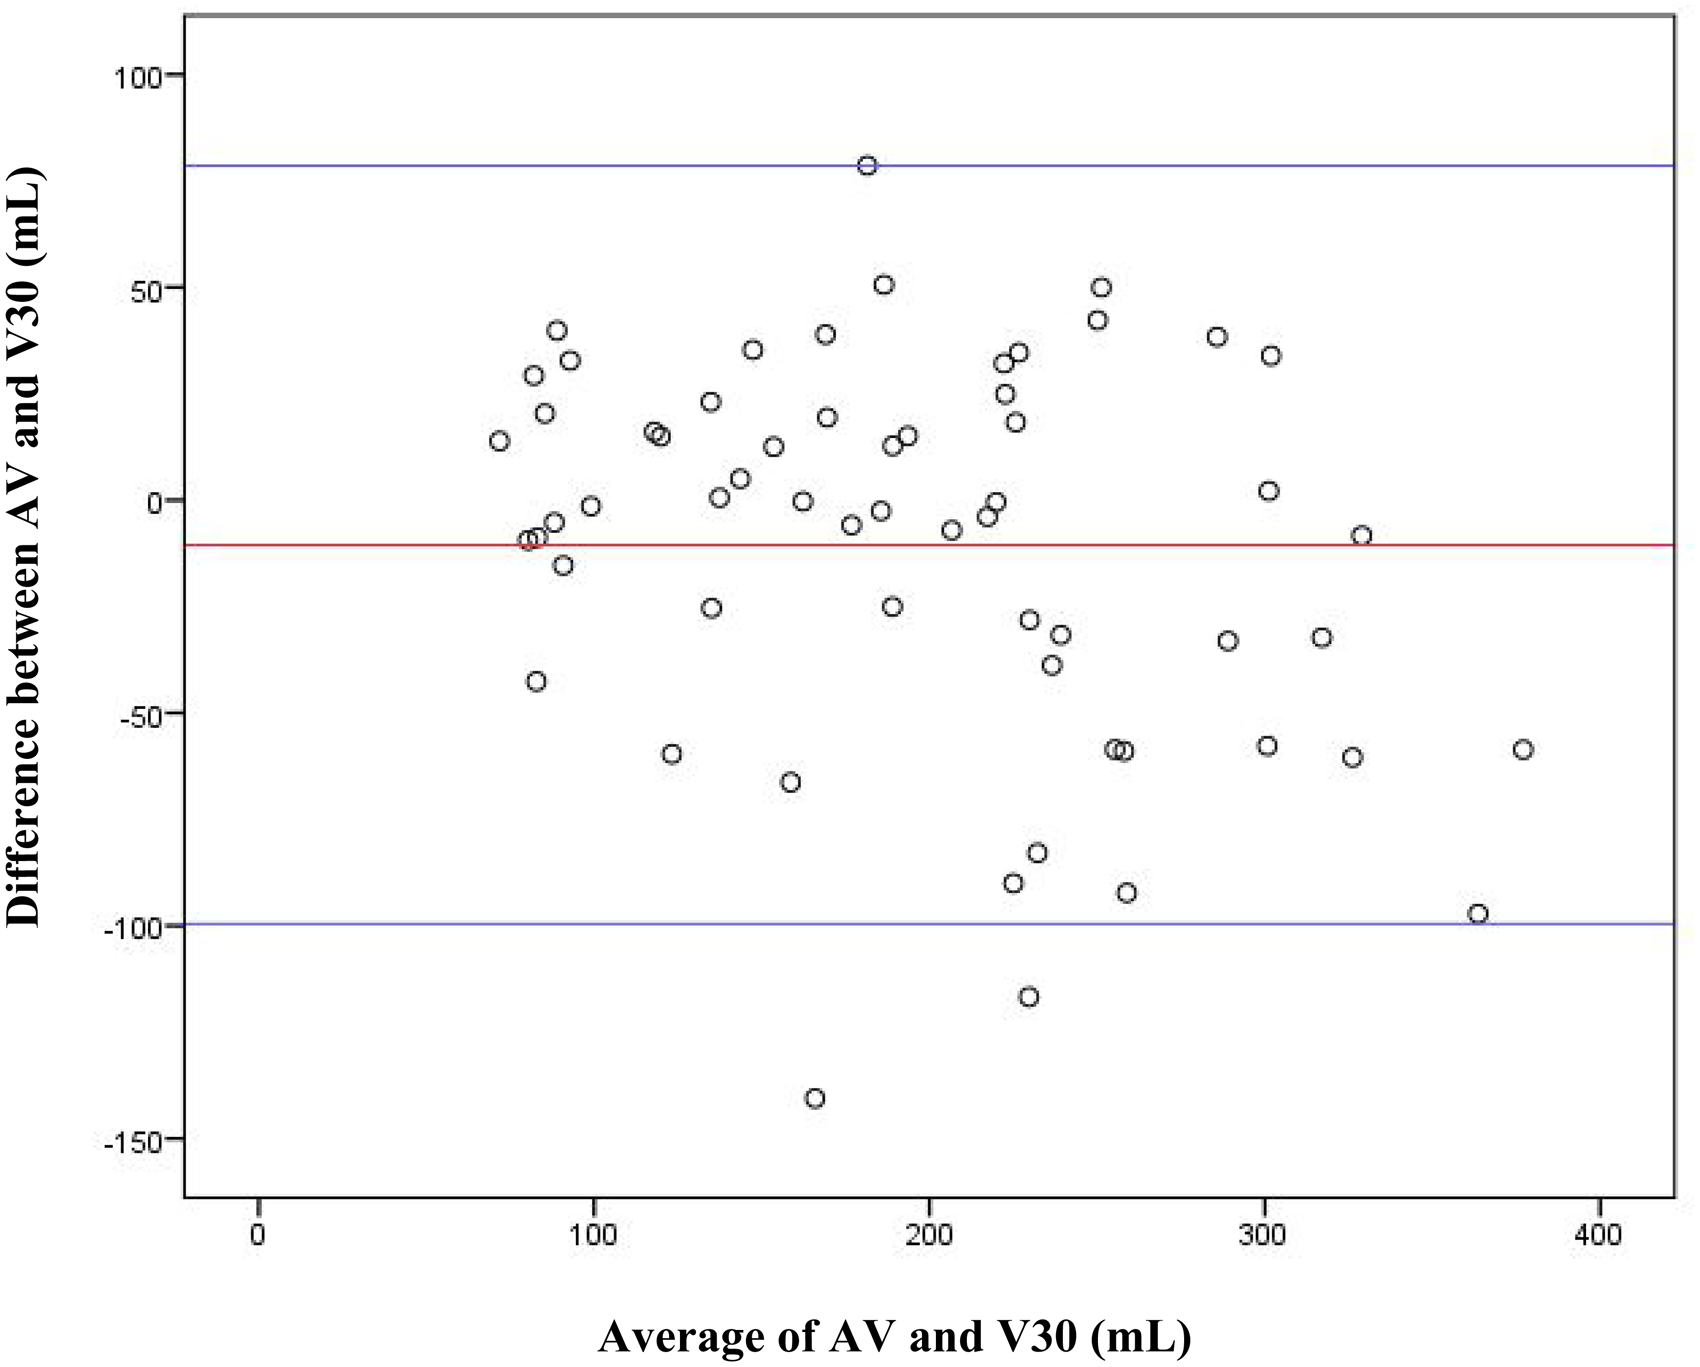
Correlation
Pearson correlation demonstrated a good positive correlation between AV and V90 (r = .770, P < .001) and AV and V30 (r = .846, P < .001). This is demonstrated graphically in Graph 3. Pearson correlation coefficient comparing absolute volumes (AV) to measured volumes at 90 degrees (V90) and 30 degrees (V30).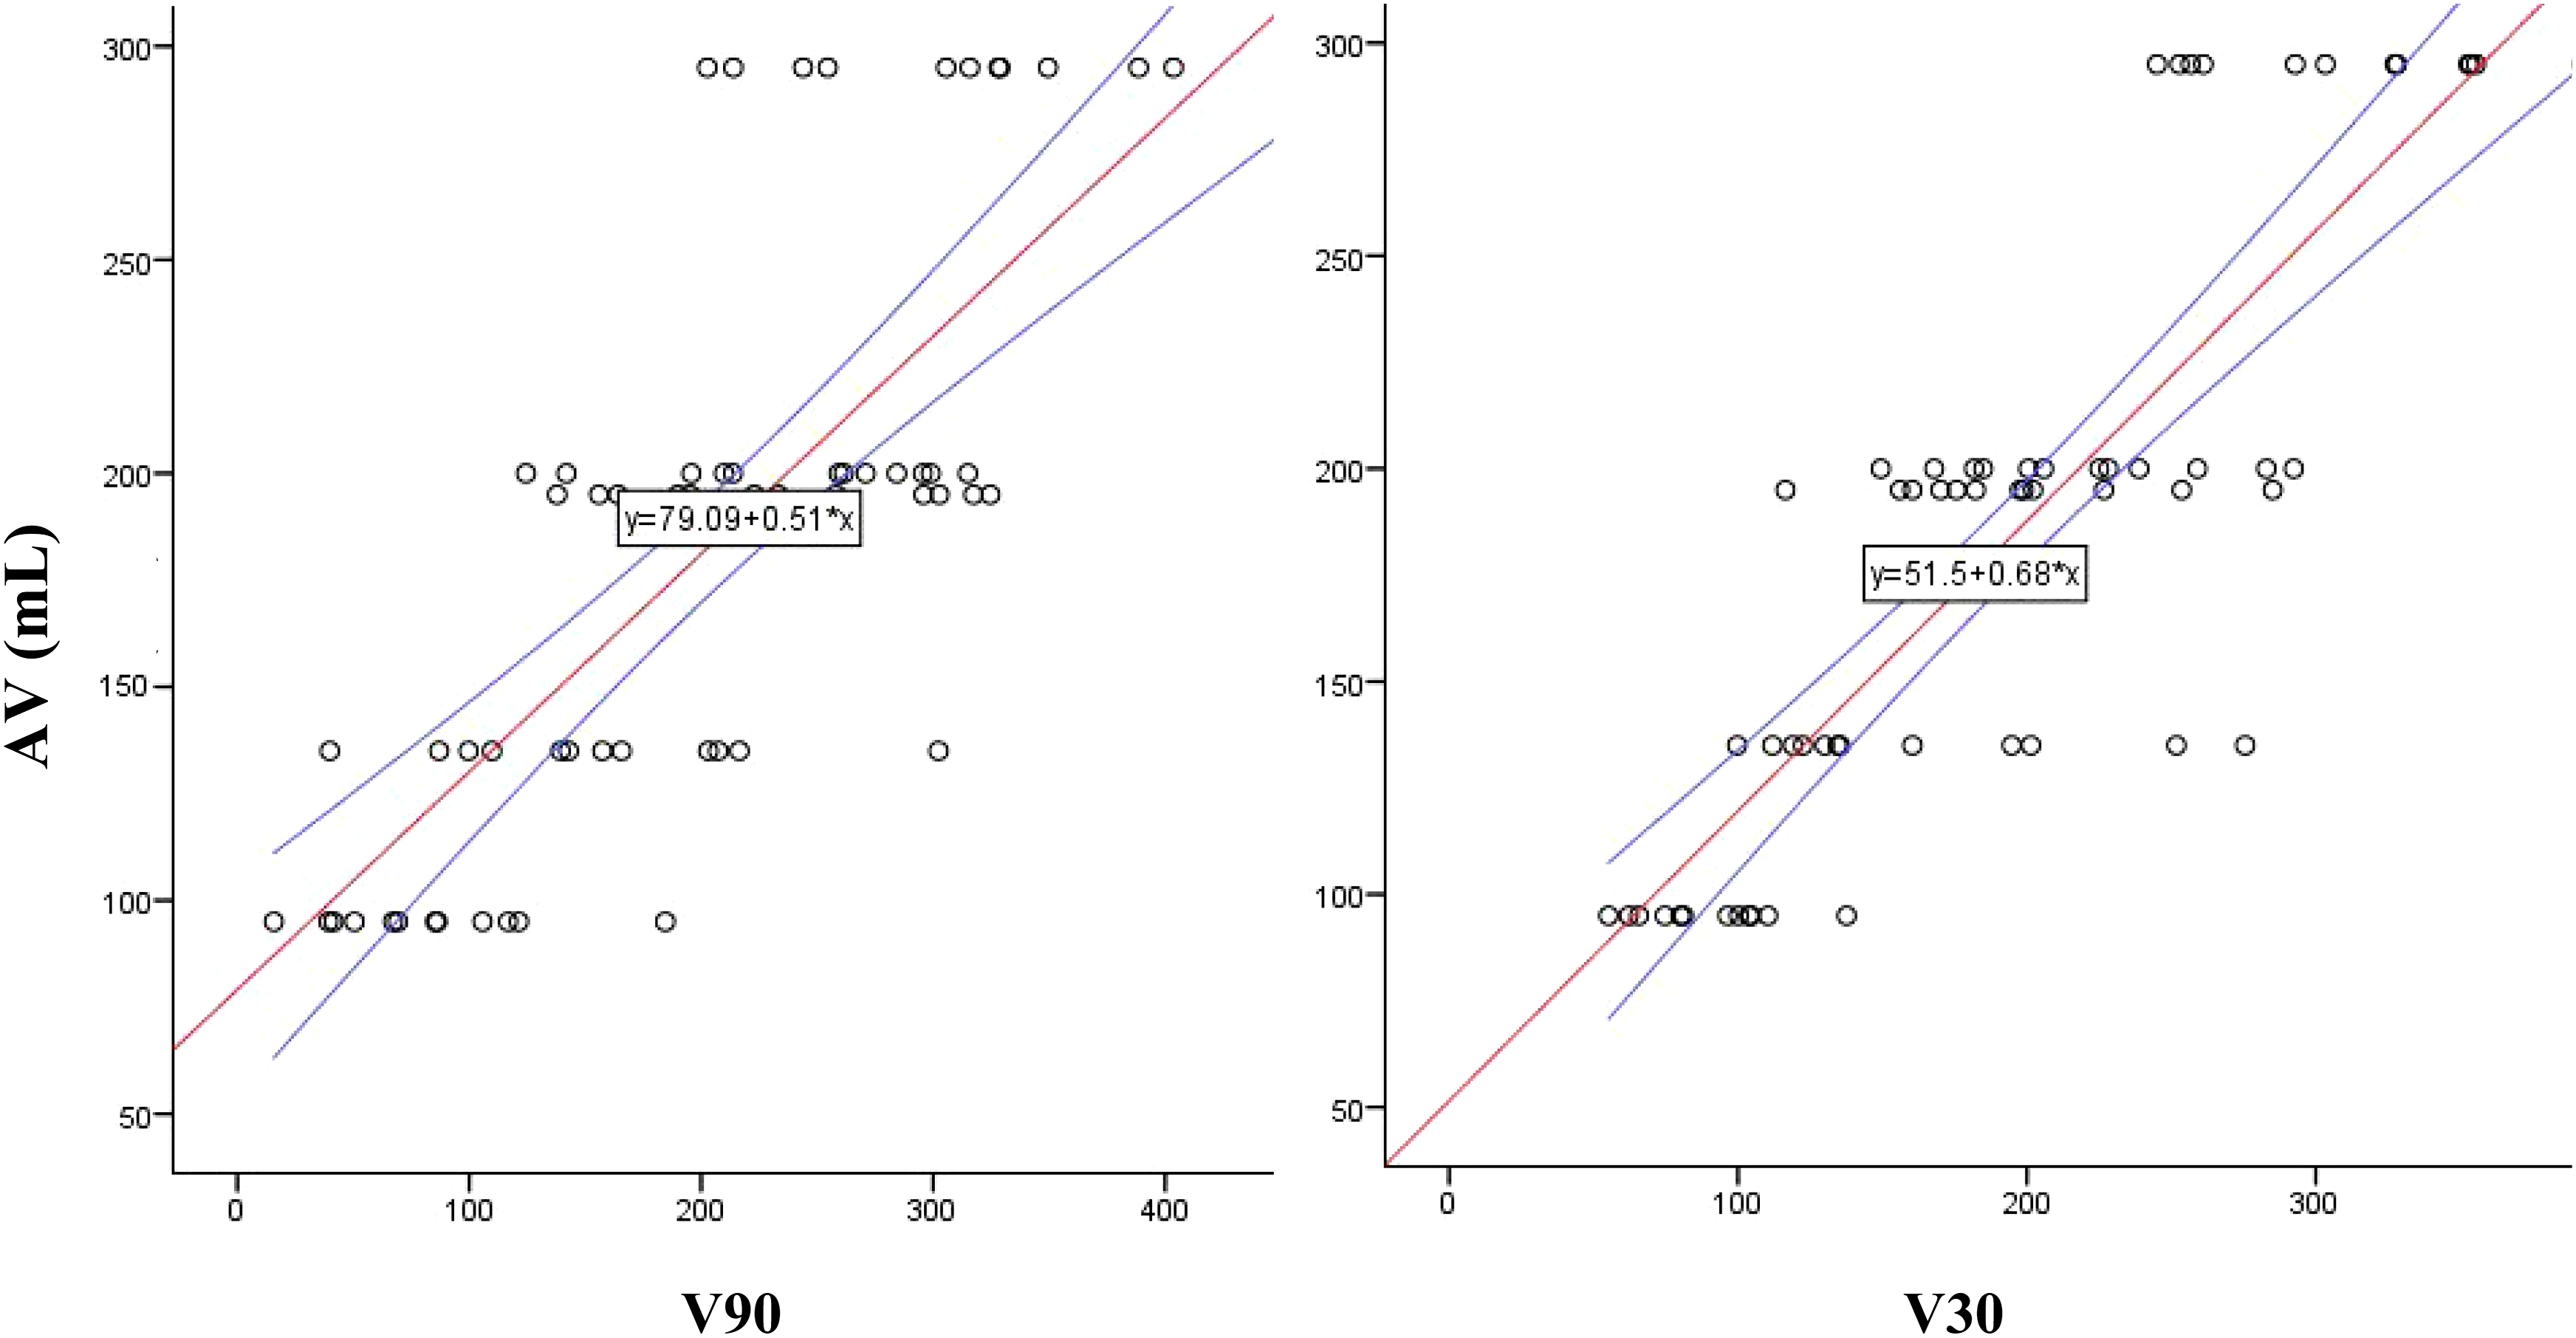
The mean breast enhancer volume AV was defined by the following equations

Linear regression analysis
Linear Regression of Independent Variables.
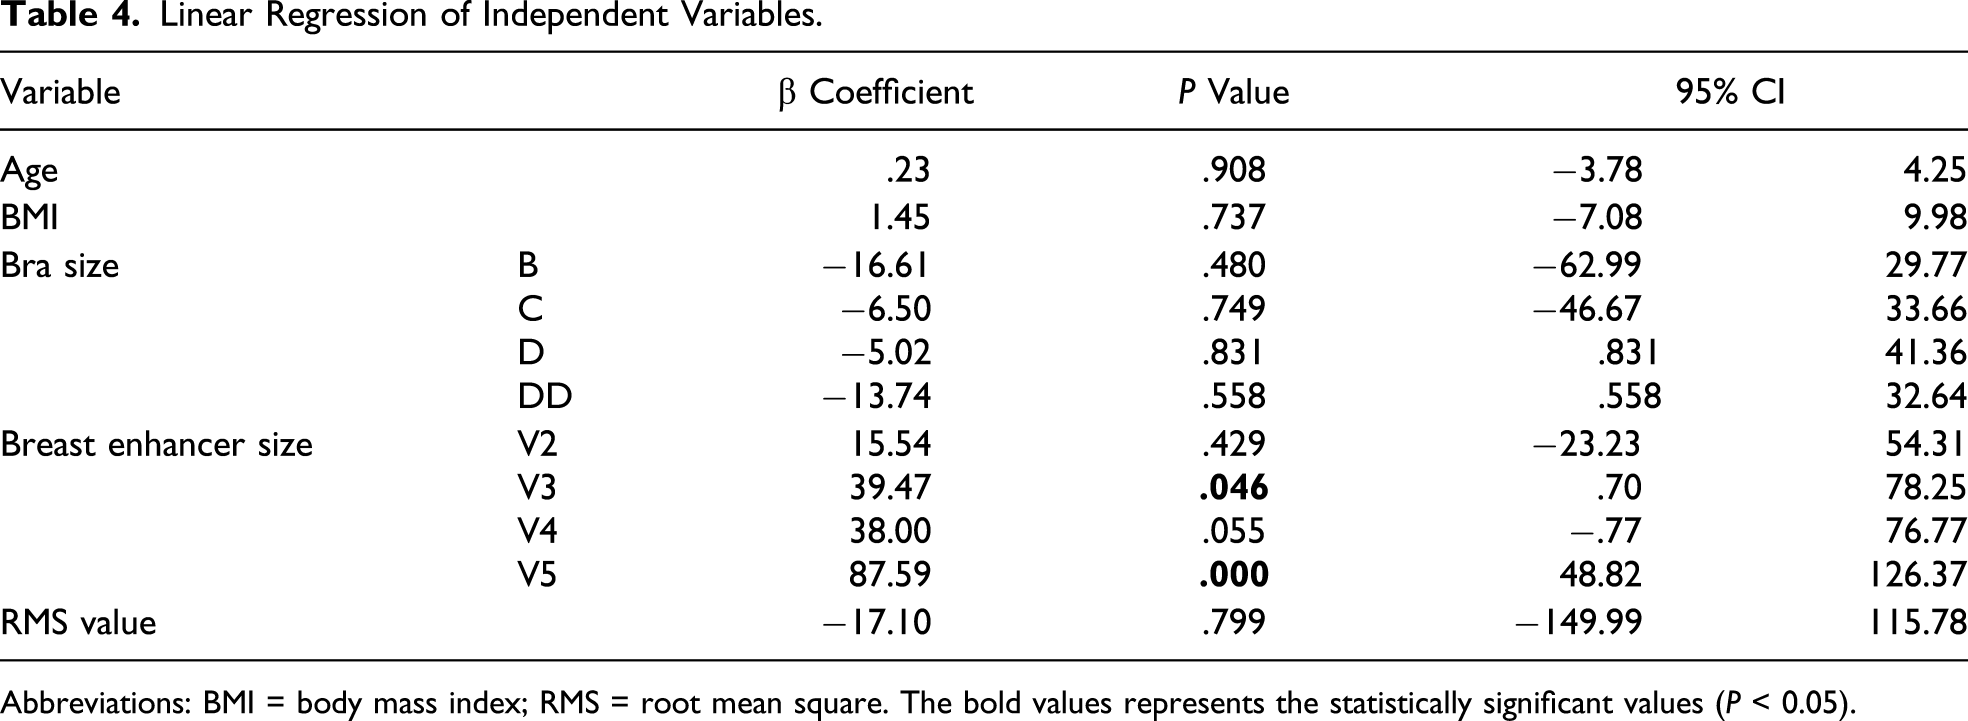
Abbreviations: BMI = body mass index; RMS = root mean square. The bold values represents the statistically significant values (P < 0.05).
Reproducibility
CV was on average 5.76% for 1 assessor for all measured volumes. Standard deviation was consistently lower in the 30° group compared to the 90° group (ranging 23.08-55.45 mL and 44.50-77.84 mL, respectively). This was also the case for standard error (3.85-9.24% and 7.42-12.97%, respectively).
Discussion
Advancements in 3D surface imaging technology over the last decade have brought about a great potential for objective analysis of the breast, which has been limited by tools that are inherently subjective or confined to 2 dimensions. 24 A multitude of camera systems and software now exist on the market that can provide measurements such as breast volume, which has been previously cumbersome to obtain by traditional methods. 25 This study purposed to utilise 5 known volumes of breast enhancers to simulate volumetric changes in 12 breasts to determine the accuracy and reliability of using the subtraction tool for breast volumetry.
The majority of volumetric studies of the breast in the literature have measured absolute breast volume using a single-captured surface, which can be used in clinical applications such as preoperative measurements to guide implant sizing or to assess asymmetry. 8 Validation studies have compared measured volumes to the weight or volume of breast tissue removed at mastectomy (mastectomy specimen volume) as their gold standard,9,20,26-28 and this study design has been seldom disputed. However, as Losken et al 9 pointed out, the different methods of volume assessment measure different areas of the breast, with MRI volumetry corresponding most closely with mastectomy specimen volume by using anatomical breast boundaries. 10 3D imaging, however, cannot locate anatomical breast tissue boundaries or delineate the posterior surface of the breast against the chest wall accurately, 29 which may explain the discrepancies between the measured volumes when compared to the gold standard.
By utilising breast enhancers in this study, we set out to determine whether differential change in breast volume could be accurately measured, rather than AV. This would allow for longitudinal evaluation of breast reconstructive surgery, which may prove to be a more useful and accurate indication of 3D surface imaging techniques. 9 There has not been any other published study to our knowledge that has utilised breast enhancers to simulate breast volumetric changes over time. Henseler et al 30 used implants placed on flat surfaces to determine the ability of the surface system to calculate the volume of static objects in the absence of human factors. Other studies looking at differential volume change have measured patients undergoing breast augmentation or reduction and compared measured volumes to implant volumes or resected tissue volumes, respectively;8,31,32 however, limitations of this method include post-operative swelling and changes in weight of the patient in between follow-up. This is also the first study to our knowledge to utilise the subtraction of superimposed images to obtain differential breast volume, a method that has previously been used by Kovacs et al 33 to evaluate stereophotogrammetry. Advantages of this method include absence of the need to define breast boundaries or to generate a curvature mimicking the posterior chest wall, both elements which are frequently mentioned as limitations when measuring AV. 34
To determine accuracy of 3D photography measurements, the Students paired t-test was used, which determines whether a systematic difference exists between the values given by 2 measurement techniques. Our study showed a statistically significant difference between the breast volumes measured with the patient upright at 90° compared to the breast enhancer AVs (P < .05, 95% CI −38.92 to 4.39). Interestingly, there was no significant difference shown between the volumes measured with the subject inclined at 30° (P = .078, 95% CI −22.25 to 1.23). Further assessment of the latter with the Bland–Altman plot showed there was evidence of proportional bias. These results show that a discrepancy between the actual and measured volumes was to a significant level when measured in a standard upright position. Losken et al, 9 who also used 3dMD software to assess breast volumetry, reported their results using Bland-Altman error and limits of agreement and concluded there was no systematic bias between measured volumes and mastectomy specimen volumes. The majority of studies used the correlation coefficient as their principle analytical tool, albeit stating in the aims that accuracy was their main objective. Good to strong correlations were presented.20,27,28,35 In view of this, a Pearson correlation coefficient was also performed for this study, which demonstrated a good positive correlation between measured and AVs in both positions (r = .770, P < .001 and r = .846, P < .001 for 90 and 30°, respectively). This demonstrates how a statistically significant discrepancy in the measurements of 2 methods can still report a good correlation. Reproducibility was evaluated by the CV of 3 measurement samples for each value, which was 5.76% for all measured volumes, which was lower than the 8.2% reported by Yip et al 27 from 3 measurements taken from a single examiner. Inter-rater reliability was not assessed in this study.
The position of 30° posterior incline has not been previously explored in the literature to our knowledge. In this study, the standard deviation and standard error of measurements performed with the subject at 30° were all lower than those of the 90° group (Table 3). We hypothesise that this position may facilitate a more accurate analysis of breast volume from a better exposure of the inferior breast, whilst maintaining sufficient exposure of the superior breast, although the small sample size of the study and lack of subjects with ptosis of the breast limit the conclusions we can derive from this study. Breast enhancer volume 5 (V5) gave the appearance of a ptotic breast however, and volumetric analysis was hindered due to shadowing in the inferior proportions of the breast, which may have contributed to V5 introducing bias in the univariate analysis. Henseler et al 36 explored a custom-made frame unto which patients can lean forward to resume a near-horizontal appearance in an effort to eliminate ptosis. When compared to volumes obtained with the water displacement method, they found the volume taken with 3D imaging was consistently significantly smaller in live models, suggesting that despite this position, the inferior portions of the breast may have still been inadequately imaged in the live subject. Distortion of the natural shape of the breast and restrictions for patients with poor mobility are also limitations to this position.
Challenges identified from this study using the double-surface subtraction method were predominantly the requirement for reproducing subject position for adequate superimposition of images for analysis. Changes in posture, position of arms33,37 or chest wall 38 could affect the accuracy of the volumetric analysis. Although the surface difference colour histograms were useful in demonstrating inadequate superimposition, realignment of surfaces relied on subjective parameters and may be subject to user variability, which was not explored in this study. On univariate analysis however, the RMS tool, which allows quantification of surface discrepancy, did not demonstrate a source of bias. A limitation to the methodology of this study was the requirement for a brassiere, which was restrictive to subjects with bra cup sizes D and DD, particularly with the addition of the larger breast enhancers. However, no significant bias was derived from breast size. Future studies with a larger sample size, less homogeneous population in regard to age and BMI and multiple analysts would add to the preliminary findings of this study.
Conclusion
3D surface imaging remains promising as a tool for volumetric assessment of the breast. Ptosis remains a challenge, but better imaging of the inferior portions of the breast may be achieved by positioning the subject at a 30° posterior incline. The double-surface subtraction method calculates differential volume and provides an alternative approach to breast volumetry. Future studies with a larger study population and robust exploration of methodology are required for this method to reach a status of clinical utility.
Footnotes
Author Contributions
All authors have made contributions to the following: (1) the conception and design of the study, or acquisition of data or analysis and interpretation of data, (2) drafting the manuscript or revising it critically for important intellectual content and (3) final approval of the version to be submitted.
Study concept and design: Faith Hyun Kyung Jeon, Michelle Griffin, Aurora Almadori, Peter E Butler
Acquisition of data: Faith Hyun Kyung Jeon, Aurora Almadori, Stephanie Bogan
Analysis and interpretation: Faith Hyun Kyung Jeon, Michelle Griffin, Jajini Varghese
Study supervision: Michelle Griffin, Ibby Younis, Ash Mosahebi, Peter E Butler
Declaration of Conflicting Interests
The authors declared no potential conflicts of interest with respect to the research, authorship, and/or publication of this article.
Funding
The authors received no financial support for the research, authorship, and/or publication of this article.